
[/caption]
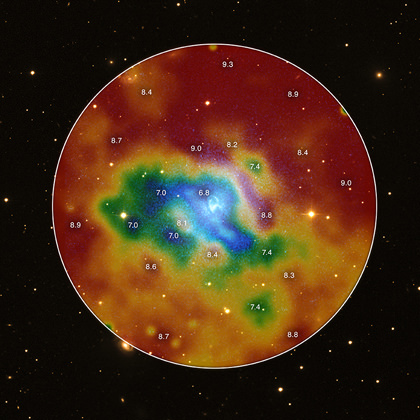
The role that supermassive black holes play in the formation of galaxies is a “hot” topic in astronomy. Using the Chandra X-Ray Observatory, an international team of astronomers have been able to create a temperature map of one galaxy, NGC 5813, which is located in the Virgo III Group of galaxies. The new map shows in unprecedented detail the history of various periods of activity of the Active Galactic Nucleus (AGN), which is associated with a supermassive black hole that resides at its center. They found that regular outbursts of the AGN maintained the temperature of the gas in the region of the galaxy, continually reheating the gas that would otherwise have cooled down.
Paper co-author Dr. Scott Randall of the Chandra Mission Planning Team at the Harvard-Smithsonian Center for Astrophysics said, “Although there are other systems that show AGN outburst shocks, this is still the only system where unambiguous shocks from multiple outbursts are seen. This allows us to directly measure the heating from shocks, and directly observe how often these shocks take place. Thus, at present NGC 5813 is *uniquely* well suited to the study of AGN heating.”
By studying images taken by the Chandra X-Ray Observatory, and combining these observations with those taken by the Giant Metrewave Radio Telescope (GMRT) and the Southern Astrophysical Research Telescope (SOAR), they were able to make out large cavities produced by periods of activity in the supermassive black hole. The researchers were able to determine that there were three pairs of large cavities, which corresponded to active outbursts of the galactic nucleus 3 million, 20 million and 90 million years ago (from our perspective here on Earth).
What makes the galaxy NGC 5813 especially suited to this study is its relative isolation from other galaxies that could influence the formation of these cavities – it is an older galaxy that is relatively undisturbed, allowing for these cavities in the gas to persist over such a long time period.
Current models of galaxy formation must take into account just how much of an influence the output of the supermassive black hole at the center of a galaxy has on the formation of stars within the galaxy, and the evolution of the shape and size of the galaxy as a whole. This process of “AGN feedback” has a dramatic influence on how the galaxy takes shape. The research by Dr. Randall, et. al shows an intimate portrait of this process.
Dr. Randall explained, “This is an important result for stellar formation and galaxy evolution. The AGN heats the gas, preventing it from cooling and forming large amounts of stars. There have been several galaxy evolution models proposed that require this kind of “AGN feedback” near the centers of galaxies to explain the observed differences in galaxies. Here we show explicitly that this kind of feedback can and does take place, at least in this system.”

As you can see in the image directly above, various outbursts of the AGN create shock waves in the gas near the center of the galaxy. As these shock waves expanded and the galaxy evolved over millions of years, the heat generated by the shocks spread outwards and into the gas surrounding NGC 5813. The gas between all of the galaxies in a cluster is called the intracluster medium (ICM). The heat – which is produced by the friction of the gases at the edge of each of the shock waves – radiates outward into the surrounding gas, increasing its temperature.
The output of the jets streaming from the supermassive black hole in the center vary over a span of roughly 10 million years, and the amount of energy that each outburst puts out is rather variable – the difference between the last two largest outbursts, for example, is almost an order of magnitude.
This process is cyclical, though the details of the mechanisms involved are still a topic that isn’t completely understood.
Dr. Randall explained this process as follows:
“…the gas cools radiatively, and flows in towards the AGN. The cool gas is rapidly accreted by the black hole, dirving [sic] an energetic outburst. The outburst heats the gas (via shocks), stopping the inflow and starving the AGN. The gas is then able to cool once more, and the cycle repeats, with, in this case, a period of about 10 million years. However, the fine details of how the jet and the ICM interact are not currently well uderstood [sic], and it is not clear how well this simple model describes reality. Our goal with the upcoming deep Chandra observation is to better understand the details of this process, most likely through comparisons with detailed numerical simulations.”
Further observations of NGC 5813 in the fall of 2011 using Chandra are in the works, Dr. Randall said. The results of their analysis will be published in the Astrophysical Journal. A preprint version of the paper, “Shocks and Cavities from Multiple Outbursts in the Galaxy Group NGC 5813: A Window to AGN Feedback,” is available on Arxiv.
Sources: Chandra press release, Arxiv paper, email interview with Dr. Scott Randall
… get a bigger thermometer!!!
Seriously, I’d really have to assume here you are talking about the temperature of gas here and not the stars?
The ‘mean’ power, talked about in the article, for all us ‘normal’ folk ★, is around ; 10^31 Watts — about 10,000 times that of the sun. Some of the outbursts in these galaxies may reach around ~10^46 Watts — ~10^20 times more energy than the sun generates every second! No wonder the holes (up to 27 kpc.) in these galaxies are so big!! Hot stuff indeed!
Not sure what universe you’re living in, but cgs units are the standard in astronomy (not SI), whether it seems logical or not. Just look at any paper in The Astrophysical Journal or The Astronomical Journal.
clarity…
Err. No, you wrong..
See the International Astronomical Union website which describes
SI Units.
To quote;
In Table 2 you will find; “Special names and symbols for SI derived units.”; the term Watt, being the number of Joules per second.
My electrical power bill comes in watts and in all my years I’ve never used “ergs.”
Typically…everywhere but the US.
Actually, what clarity says is correct, regardless of what it says on the IAU website (and your electric bill). Check just about any paper on ApJ, which is one of if not the main journals for general astrophysics: http://iopscience.iop.org/0004-637X. You can also check the main pre-print server at http://xxx.lanl.gov/archive/astro-ph. While there is some variation, you can easily see that, for better or worse, the use of cgs units is *very* common.
Can someone explain to me why the supposed location of the AGN is the coolest place in the galaxy?
The proposed process of gas being heated by an AGN, flowing out of it, cooling down
at some distance and falling back to the AGN seems to be clear, but cannot work in NGC5813. To cool hot gas down, a location is required that is cooler than the gas. However, the picture indicates that the coolest location is in the center, where the AGN resides.
The AGN of a galaxy may have an impressive power, but its mass is just a minute portion of the mass of the entire galaxy. As you design a model that is to explain what you see in the picture, you should account for that mass in your model. The hot gas cannot flow through a galaxy as if it were empty space.
If that was the requirement for cooling, refrigerators wouldn’t be possible.
Thermodynamically you want to move heat, dQ, and dQ = T*dS for quasi-static systems. (I.e. those that moves slow enough so the intensive parameter (here T) is relatively slow changing compared to the extensive (here S) – one can assume an equilibrium lies close in every point.) Moving heat is possible in open systems for various changes in T but also S, p, V, n et cetera – hence refrigerators, for example, among other heat engines.
It is when the system is closed and homogeneous that T is the only parameter that describes how heat flow.
I wrote this paper, so hopefully I can answer! The idea is this: the jets from the AGN inflate cavities in the surrounding gas. These cavities are relatively huge, much larger than the central AGN. The cavities expand supersonically and drive shocks into the gas. The shocks propagate outwards, and there is a sharp jump in temperature *at the shock front edge*. So, the shocks show up as hot regions outside of the group center, along the surface brightness edges (which are most easily seen in the blue X-ray image by itself, which isn’t above but in the original press release). However, this rise in temperature is transient. As pointed out by Torbjorn, what really matters for heating is the change in entropy. Since we can measure the temperature and density jumps across the shock fronts, we know the rise in entropy (i.e., the heating), and can compare that to the cooling rate of the gas. In this system we can do this for multiple outbursts, so we know how often the outbursts occur and can determine the average heating rate. We find that the shocks can easily heat the gas by the required amount, which is the key result of this paper. The details are, of course, in the paper.
The temperature is of gas in the shock waves. The cavity is empty. I have just read the abstract of the paper, so as yet I don’t know many details.
I was wondering how this temperature is measured exactly. I am presuming it is a blackbody measurement.
Astronomy does indeed use cgs, which I have always found funny. In particle physics cgs is used, but the scale of things is a bit more commensurate with that. The MKS units would honestly make more sense, and it would reduce the huge exponents (maybe not that much though) quoted.
LC
To cgs, etc. (See comment and IAU reference above.)
I’d assume the temperature is measured by the X-ray spectrum, much like we do with using the Wien curves with stars. It could also be measured with the electron temperatures akin Zanstra temperatures in planetary nebulae — measuring tempertures in low density gas environments..
I had not been familiar with the Zanstra ratio:
http://en.wikipedia.org/wiki/Zanstra_method
This works with optical radiation. I speculated this did involve some Wien curve method for ionized species. I have not read the paper, and given my current backlog as it is I probably will not get to it.
LC