In the 1960s, astronomers began noticing a pervasive microwave background visible in all directions. Thereafter known as the Cosmic Microwave Background (CMB), the existence of this relic radiation confirmed the Big Bang theory, which posits that all matter was condensed onto a single point of infinite density and extreme heat that began expanding ca. 13.8 years ago. By measuring the CMB for redshift and comparing these to local distance measurements (using variable stars and supernovae), astronomers have sought to measure the rate at which the Universe is expanding.
Around the same time, scientists observed that the rotational curves of galaxies were much higher than their visible mass suggested. This meant that either Einstein's Theory of General Relativity was wrong or the Universe was filled with a mysterious, invisible mass. In a new series of papers, members of the Atacama Cosmology Telescope (ACT) collaboration have used background light from the CMB to create a new map of Dark Matter distribution that covers a quarter of the sky and extends deep into the cosmos. This map confirms General Relativity and its predictions for how mass alters the curvature of spacetime.
The ACT is an international consortium of more than 160 scientists from the U.S., the U.K., Canada, France, Germany, Italy, Chile, Switzerland, Japan, South Africa, and NASA's Goddard Space Flight Center. Their goal is to provide improved measurements of parameters that describe the very early Universe by monitoring the light that emerged during " Cosmic Dawn " (when the Universe was only 380,000 years old), which is visible today as the CMB. By comparing this to measurements of the local Universe, astronomers and cosmologists hope to learn more about how it evolved.
According to the predominant cosmological model - the Lambda Cold Dark Matter (LCDM) model - Dark Matter accounts for 85% of the mass in the cosmos. Unfortunately, it doesn't interact with normal ("luminous") matter via electroweak or strong nuclear forces, only gravity (the weakest of the fundamental forces). To track down this illusive and "invisible" mass, the ACT collaboration uses the Atacama Cosmology Telescope (ACT), a custom-built six-meter (~20-foot) millimeter-wave telescope located at the Llano de Chajnantor Observatory in northern Chile.;
As they describe in their three new papers scheduled for publication in *The Astrophysical Journal*, the team relied on data from the ACT's Data Release 6 (DR6), which consisted of five seasons of CMB temperature and polarization observations. These light readings were essentially used to backlight all of the matter between the present day and the Big Bang (ca. 13.8 billion years ago). Said Suzanne Staggs, the Henry DeWolf Smyth Professor of Physics at Princeton University and the director of ACT:
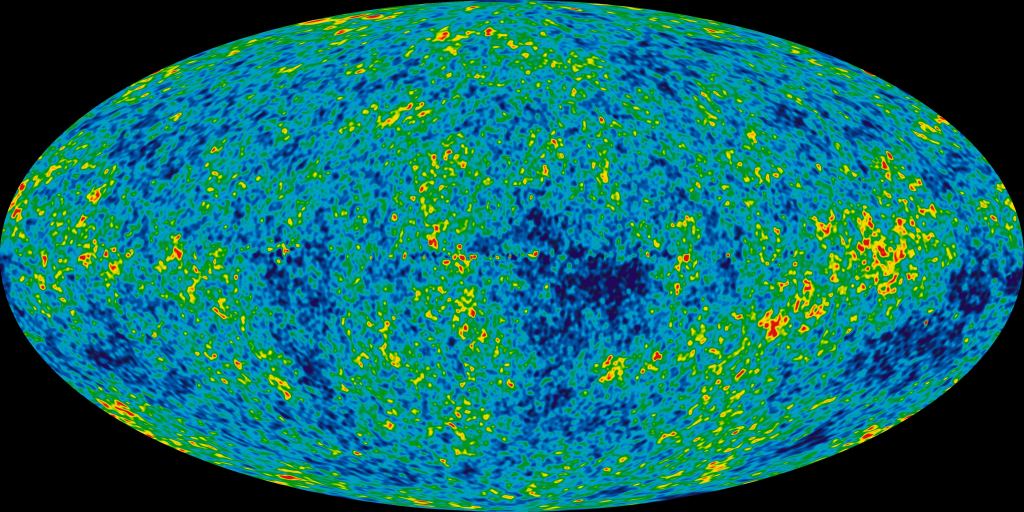
"It's a bit like silhouetting, but instead of just having black in the silhouette, you have texture and lumps of dark matter, as if the light were streaming through a fabric curtain that had lots of knots and bumps in it. The famous blue and yellow CMB image is a snapshot of what the Universe was like in a single epoch, about 13 billion years ago, and now this is giving us the information about all the epochs since."
The image alluded to here is the famous full-sky image based on data collected by the Wilkinson Microwave Anisotropy Probe (WMAP) between 2001 and 2003. This mission (which remained in operation until 2010) built on the previous work by the Cosmic Background Explorer (COBE), which collected data on the CMB from 1989 to 1993. Then came the ESA's Planck satellite, which measured the CMB from 2009 to 2013 to map tiny temperature fluctuations. The increasingly accurate maps that resulted have provided insight into the evolution of the cosmos by showing what its initial conditions were.
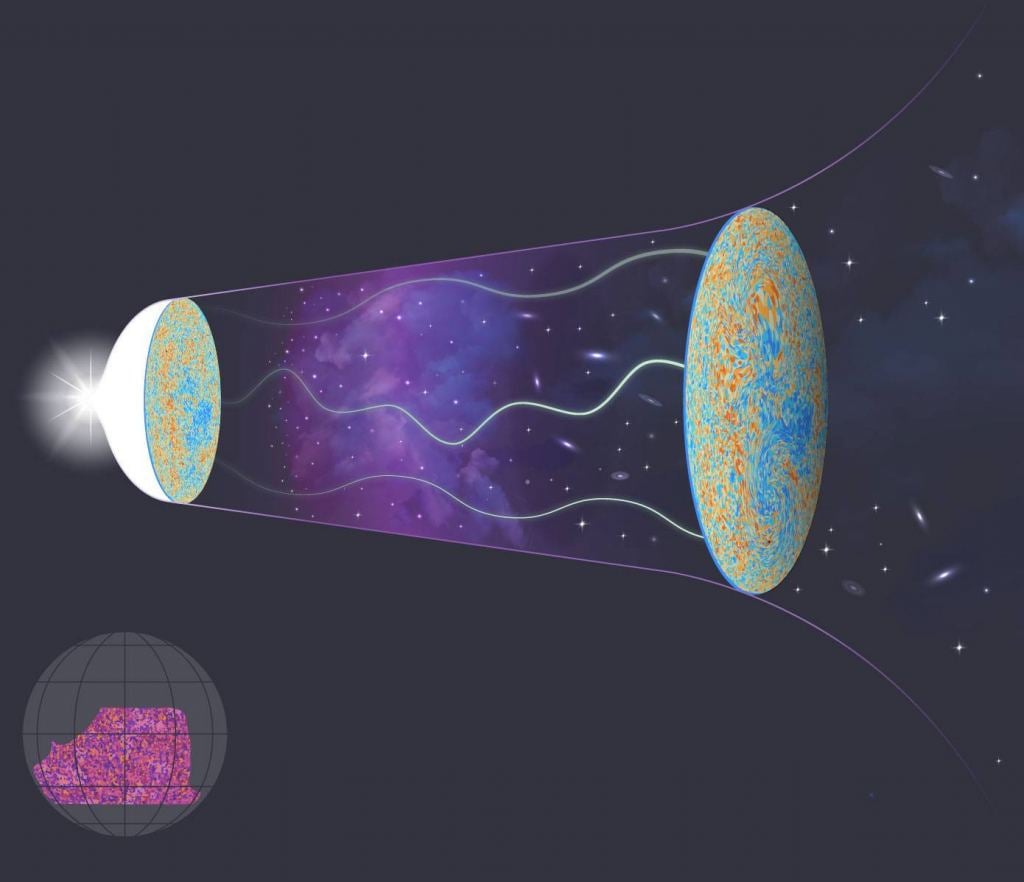
This latest map has taken that research a step further by using it to measure how the structure of matter has evolved since, 85% of which is Dark Matter. To visualize the presence and distribution of this mysterious mass, the research team examined how its gravity affected the curvature of spacetime between the CMB and Earth. This effectively showed how large collections of mass (both visible and invisible) altered the path its light followed as it traveled for billions of light-years (and billions of years) to reach us.
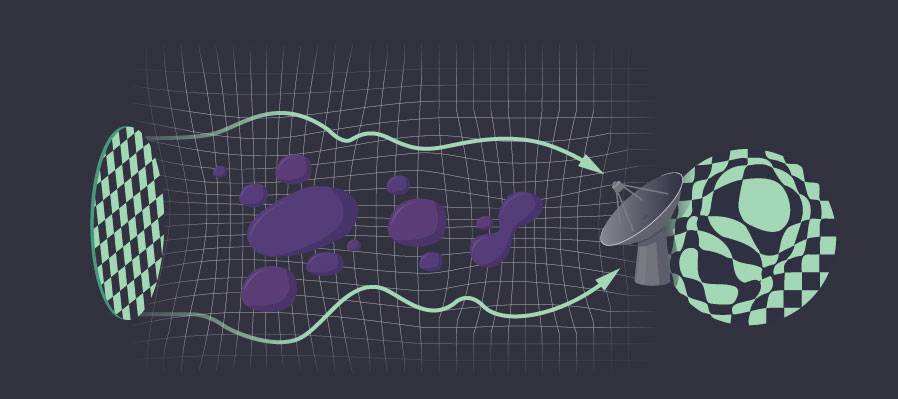
The team tracked how the gravitational pull of massive dark matter structures can warp the CMB on its 14-billion-year journey to us, just as antique, lumpy windows bend and distort what we can see through them. The resulting map revealed the "scaffold" of Dark Matter that holds visible matter and surrounds and connects galaxies and galaxy clusters. This led to the Universe's large-scale structure (often referred to as the "Cosmic Web"), which can be seen clearly in the image. The map also breaks with convention by measuring the distribution of matter in our Universe, not in terms of light but in terms of mass.
Said co-author Blake Sherwin, a 2013 Ph.D. alumnus of Princeton and a professor of cosmology at the University of Cambridge (where he leads the ACT research group):
"We have mapped the invisible dark matter distribution across the sky, and it is just as our theories predict. This is stunning evidence that we understand the story of how structure in our universe formed over billions of years, from just after the Big Bang to today. Remarkably, 80% of the mass in the universe is invisible. By mapping the dark matter distribution across the sky to the largest distances, our ACT lensing measurements allow us to clearly see this invisible world."
"We've made a new mass map using distortions of light left over from the Big Bang," said Princeton assistant professor Mathew Madhavacheril, a 2016-2018 Princeton postdoc and a lead author of one of the papers. "Remarkably, it provides measurements that show that both the 'lumpiness' of the Universe, and the rate at which it is growing after 14 billion years of evolution, are just what you'd expect from our standard model of cosmology based on Einstein's theory of gravity."
Mark Devlin, the Reese Flower Professor of Astronomy at the University of Pennsylvania and the deputy director of ACT, was one of a handful of researchers who saw the potential for this experiment back in the early 2000s. "When we proposed this experiment in 2003, we had no idea the full extent of information that could be extracted from our telescope," he said. "We owe this to the cleverness of the theorists, the many people who built new instruments to make our telescope more sensitive, and the new analysis techniques our team came up with."
Their results could also provide new insight into the so-called "Crisis in Cosmology," where light measurements using the CMB vs. local stars produce different values. Also known as the " Hubble Tension," this disparity suggests that Dark Matter was not "lumpy" enough and that the standard model of cosmology (LCDM) may be incorrect. However, the ACT team's latest results precisely assessed the size and distribution of these lumps and determined that they were perfectly consistent with the LCDM model. Staggs, whose team built the detectors that gathered the data over the past five years, believes their new map could turn this "crisis" into an opportunity:
"The CMB is famous already for its unparalleled measurements of the primordial state of the universe, so these lensing maps, describing its subsequent evolution, are almost an embarrassment of riches. We now have a second, very primordial map of the Universe. Instead of a 'crisis,' I think we have an extraordinary opportunity to use these different data sets together. Our map includes all of the dark matter, going back to the Big Bang, and the other maps are looking back about 9 billion years, giving us a layer that is much closer to us. We can compare the two to learn about the growth of structures in the universe. I think is going to turn out to be really interesting. That the two approaches are getting different measurements is fascinating."
While the ACT was decommissioned in September 2022 (after 15 years in operation), the data it gathered still inspire new research and breakthroughs. More papers presenting results from the final set of observations in the DR6 are expected soon, and the Simons Observatory will conduct future observations from the same sight. These will be done using a new telescope scheduled to begin operations in 2024 that will be capable of mapping the sky almost ten times as fast as the ACT. Perhaps we can look forward to all-sky surveys that map the distribution of Dark Matter going back to the beginning of the cosmos.
The pre-print versions of the ACT papers can be found here:
- A Measurement of the DR6 CMB Lensing Power Spectrum and its Implications for Structure Growth
- *Mitigating the impact of extragalactic foregrounds for the DR6 CMB lensing analysis*
- *DR6 Gravitational Lensing Map and Cosmological Parameters*
Further Reading: Princeton University