Cosmology is now stranger to large scale surveys. The discipline prides itself on data collection, and when the data it is collecting is about galaxies that are billions of years old its easy to see why more data would be better. Now, with a flurry of 29 new papers, the partial results from the largest cosmological survey ever - the Dark Energy Survey (DES) - have been released. And it largely confirms what we already knew.
The DES took place over 6 years from 2013 to 2019, and looked at over 1/8th of the night sky for a total of 758 nights. Results released on May 27th contain analysis of the data from the first half of that observational period, having already released results from the first year back in 2017.
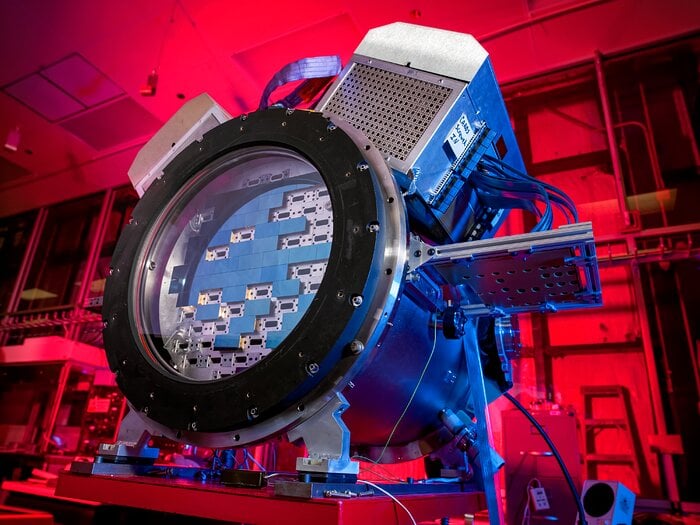
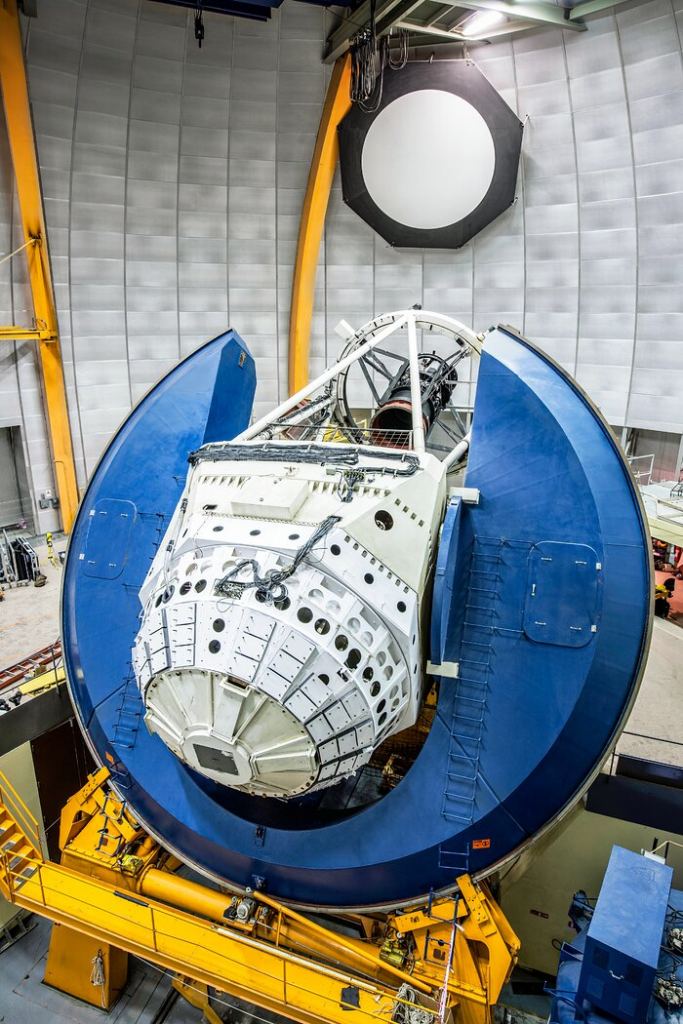
Video describing the work by the DES.Credit: NOIRLab YouTube ChannelEven using just half the data, the survey, which included 400 individual scientists from 25 institutions in 7 countries, observed over 226 million galaxies. Observations were done with the Victor M Blanco telescope at Cerro Tololo Inter-American Observatory in Chile. Measuring 4 meters in width, the Blanco telescope has a resolution of 570 megapixels - almost 50 times as much as a standard iPhone camera.
All that observational power is great to collect data, but the scientists need to know what to do with it when collected. The goal of the survey was to "quantify the distribution of dark matter and the effect of dark energy " according to a press release by Fermilab, which built and tested the camera used in the survey. These two poorly understood cosmic features make up 95% of all the known "stuff" in the universe.
Despite their prevalence, they are very hard to detect, hence the name "dark". However, DES provides more insight that ever before into some characteristics of these little understood phenomena. In particular, two cosmological features were central to the survey's efforts. The first was the " cosmic web ", while the second were weak gravitational lenses.
The cosmic web is what cosmologists use to describe the structure of galaxies. These massive clusters of gravitationally bound stars aren't randomly distributed, as one might assume if the universe was all started from the same state. They form a pattern, with clumps of galaxies banding together to form galaxy clusters.
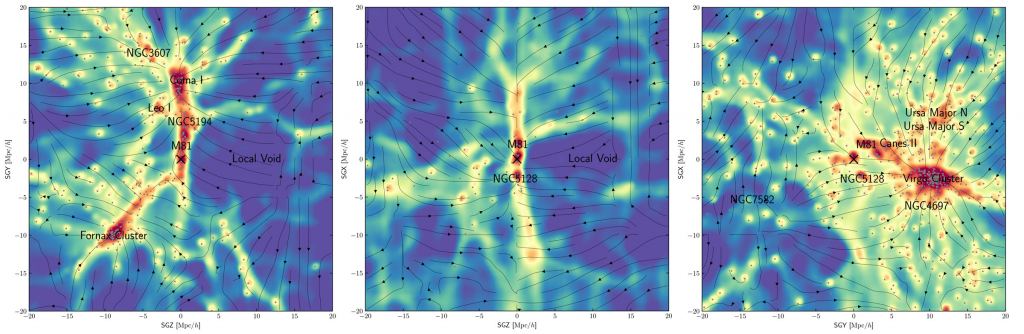
Cosmologists normally attribute those clumped up areas to the presence of higher densities of dark matter and, therefore, gravity. Mapping where they occur in space provides insight into what areas of the galaxy might feature high concentrations of dark matter to study. Results from universe growth models can then be compared to the cosmic web as a way to check their accuracy in predicting how the universe actually turned out.
Clustering isn't the only way to detect dark matter though. DES scientists also utilized a well-studied cosmological phenomena called gravitational lensing. This effect happens when light is bent around areas of high gravity, which pockets of dark matter certainly are. Strong gravitational lensing, such as that around black holes, is a common enough feature of cosmology, producing features such as Einstein rings that look spectacular.
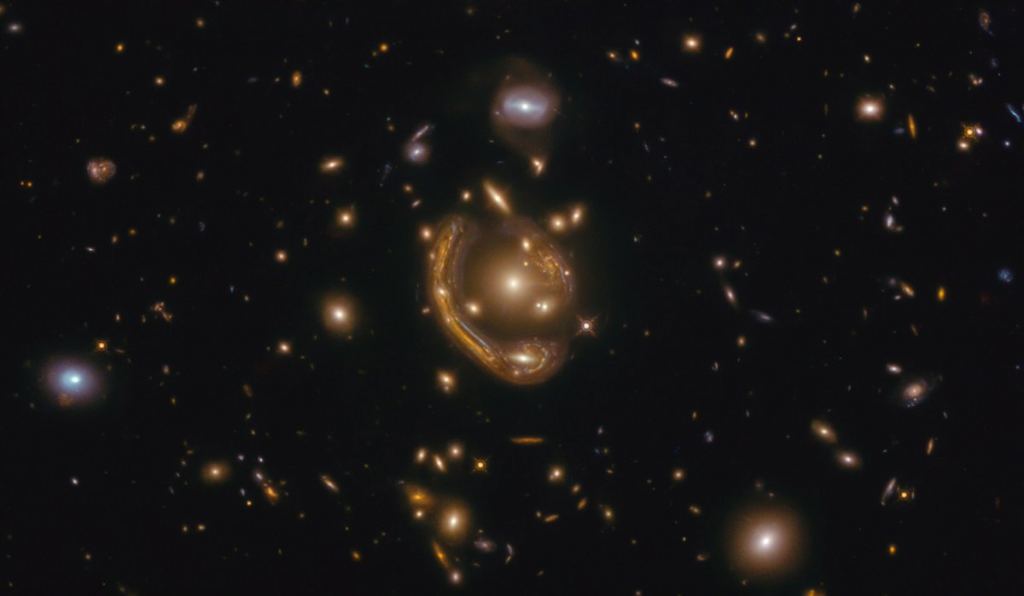
Weak gravitational lensing doesn't have quite as much visual impact as its stronger cousin, but it does provide more insight into that important map of dark matter and dark energy. It can also be notoriously difficult to calculate what effect the lensing has, which is where some additional analytical tools developed by the DES team come into play.
Redshifting is a feature of astronomical observations where things that are far away and getting further away appear to have the light they emit shifted to the red side of the light spectrum. It is notorious for confounding observational data of features like gravitational lensing or even of clustering itself.
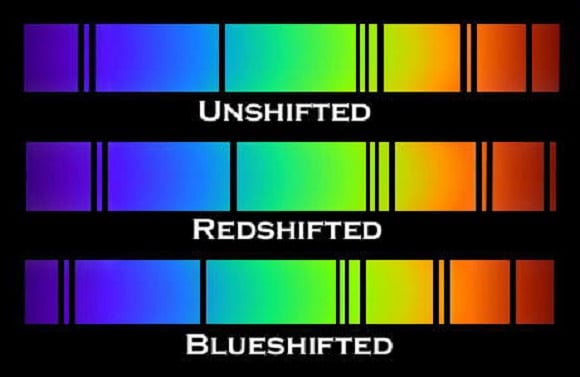
To deal with this issue, the DES team came up with a novel calibration technique. They chose 10 different regions of the sky to perform "deep field" searches of, which allowed them to see galaxies that were even farther away than their normal observational area. They then used the redshift values calculated in these deep fields to calibrate redshift values in the rest of the surveyed sky.
Even having removed the redshift, more data is always more useful in understanding cosmological phenomena. The DES team also analyzed a number of other phenomena, which included baryonic acoustic oscillations, frequency measurements for massive galaxy clusters, and calculations of some of the features of Type Ia supernovae captured in the survey.
The overall result of all this effort is another feather in the cap of the current model of the evolution of the universe. Survey results from the DES fit well with the predicted model that is used to map the universe from the beginning of time. In fact, it contradicts previous claims that there was a few percentage difference between the observed universe and the predicted one.
But the team's effort isn't done yet. They still have only analyzed half the data, so the other half is expected to add even more detail to the picture of dark energy and dark matter. In addition, new surveys using new instruments, such as the Vera Rubin Observatory, are already planned. There's always more cosmological data to be collected.
Webinar discussing the DES Year 3 survey.Credit: DES YouTube ChannelLearn More:
NOIRLab - Dark Energy Survey Releases Most Precise Look at the Universe’s Evolution
DES - DES Year 3 Cosmology Results: Papers
arXiv - Dark Energy Survey Year 3 Results: Redshift Calibration of the Weak Lensing Source Galaxies
UC - Dark Energy Survey releases most precise look yet at the universe’s evolution
Lead Image:
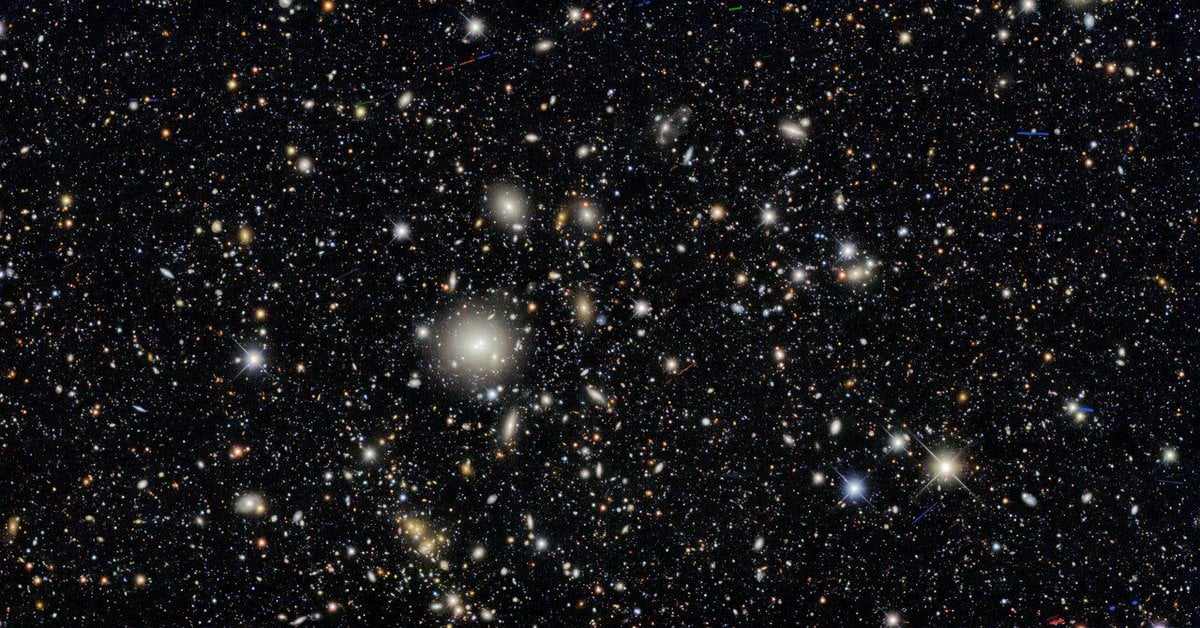
Deep field image of some of the 226 million galaxies the DES surveyed.
Credit: Dark Energy Survey / DOE / FNAL / DECam / CTIO / NOIRLab / NSF / AURA
Acknowledgments: T.A. Rector (University of Alaska Anchorage/NSF's NOIRLab), M. Zamani (NSF's NOIRLab) & D. de Martin (NSF's NOIRLab)