One of the most fascinating things about planet Earth is the way that life shapes the Earth and the Earth shapes life. We only have to look back to the Great Oxygenation Event (GOE) of 2.4 billion years ago to see how lifeforms have shaped the Earth. In that event, phytoplanktons called cyanobacteria pumped the atmosphere with oxygen, extinguishing most life on Earth, and paving the way for the development of multicellular life.
Early Earth satisfied the initial conditions for life to appear, and now, lifeforms shape the atmosphere, the landscape, and the oceans in many different ways.
At the base of many of these changes is phytoplankton.
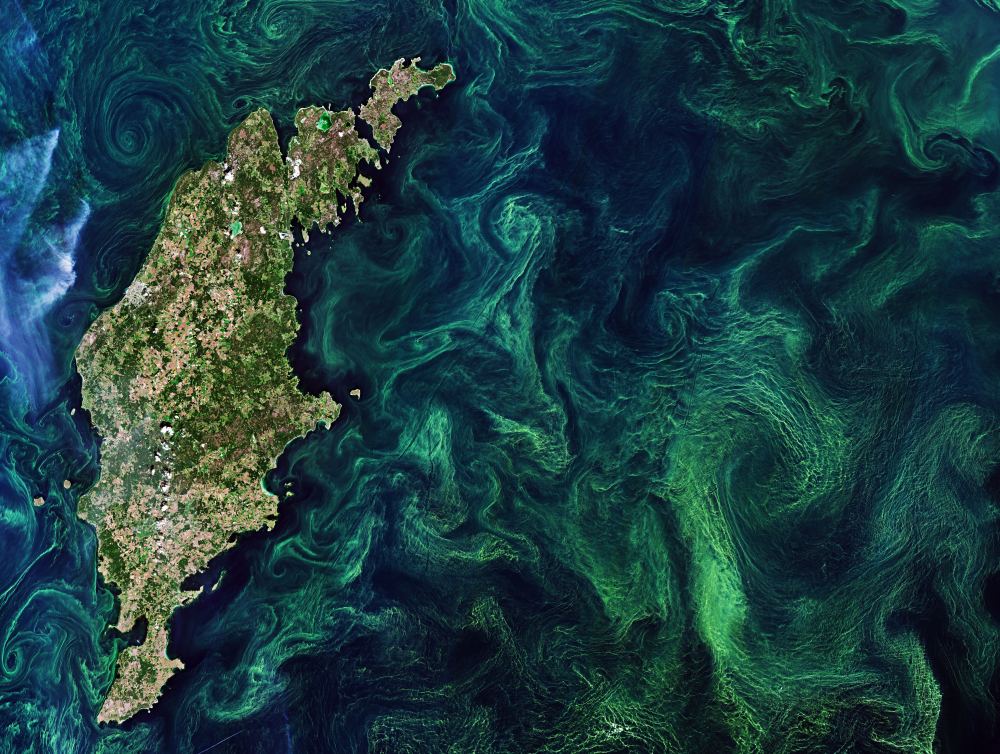
Phytoplankton is made up of microscopic lifeforms that live in both salt and fresh water. They’re primary producers, which means they’re at the base of the food chain. They’re autotrophic, meaning that the organisms that comprise phytoplankton make their own food. They produce their own organic compounds like carbohydrates, proteins, and fats, from simple substances in the atmosphere like carbon dioxide (CO2), and it’s all driven by the Sun. They also take in nutrients from the water that surrounds them.

Now a new study from the European Space Agency’s Climate Change Inititative looks at global phytoplankton over a 20 year time-span. A press release from the ESA announcing the study calls phytoplankton the planet’s “carbon pump.”
What does that mean?
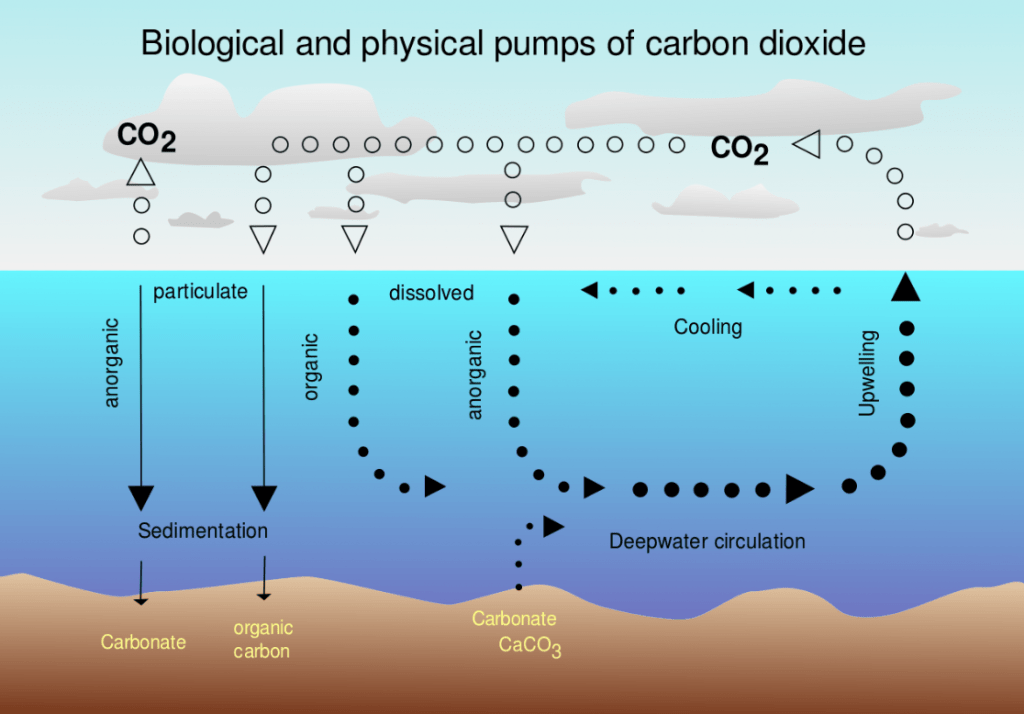
Carbon pumping, also called biological pumping, is the transformation of carbon out of the atmosphere and into organic carbon. That organic carbon then sinks into the deep ocean and decomposes. As a result, the ocean holds the carbon, rather than the atmosphere. A portion of that carbon ends up in sediment, and can be locked away out of the atmosphere for millions of years. Carbon pumping helps regulate the atmosphere, and without it, the atmosphere would hold about 200 ppm more carbon than it does.
This is an illustrative example of how life shapes Earth: what would things be like if our atmospheric wasn’t 407 ppm CO2 (2018), but was over 600 ppm?

Phytoplankton plays another important role: producing oxygen. Scientists say they produce between 50% and 85% of the world’s oxygen. It’s difficult to know exactly, because the phytoplankton population changes with the seasons.
The new paper is titled “Primary Production, an Index of Climate Change in the Ocean: Satellite-Based Estimates over Two Decades.” The lead author is Gemma Kulk, a phytoplankton physiologist from Plymouth Marine Laboratory in the UK. The paper is published in the journal Remote Sensing.
Since phytoplankton are primary producers at the base of the food chain, variations in their population have far-reaching consequences for Earth. Changes can affect not only the concentration of CO2 in the atmosphere, but also things like biodiversity and fish populations.
“Everyone understands why the rainforests and trees are important – they are the lungs of the Earth, taking up carbon dioxide from the atmosphere,” lead author Kulk said in a press release. “What is overlooked is that the oceans are of equal importance – every second breath you take comes from the oceans.”
With the growing influence of climate change in our world, the state of phytoplankton is catching the critical eye of scientists. They want to know how phytoplankton will respond to the warming of the ocean at the surface, where phytoplankton live. Satellite data is a critical piece of their understanding.
Phytoplankton and their effects vary a great deal, due to geographic location, seasonal changes, and year-to-year changes. But overall, the two-decade study found that primary production varied between around 38 to 42 gigatonnes of carbon per year. The study also highlighted some regional differences. Primary production is greater in coastal areas compared to open oceans.
In their paper the authors write, “Phytoplankton primary production is forced by physico-chemical conditions in the water column, including temperature, light and micro- and macronutrients. These drivers are influenced by seasonal, inter-annual and multidecadal variations in oceanic and atmospheric processes.”
The team pointed to the polar regions for an example. “For example, phytoplankton primary production in polar regions is strongly influenced by seasonal solar irradiance patterns and the formation of surface mixed layers due to ice melt in spring and summer.”
The study also showed that phytoplankton activity changed in response to things like El Niño, the North Atlantic Oscillation, and the Indian Ocean Dipole. Those three phenomena are changes in ocean temperature in the cases of El Niño and the Indian Ocean Dipole, and atmospheric pressure in the North Atlantic Oscillation.
Long-term studies like this one can serve two purposes. They can show how phytoplankton responds to shifts in climate, and they can signal shifts as well.

Shubha Sathyendranath is from Plymouth Marine Laboratory, and is also Science Leader of the Ocean Colour Climate Change Initiative. Sathyendranath is a co-author of the study, and in a press release she said, “Although the data records span 20 years, it is important to wait at least 30 years to be able to identify any clear climate trend with sufficient confidence.”
“It is critical that the ocean colour dataset as part of the Climate Change Initiative be extended and maintained on a regular basis, so that we have an empirical record of the response of ocean biota to changes in climate,” Sathyendranath continued. “From this, we can develop reliable models, so we can accurately predict change in order to adapt to the impacts of a changing world.”
Studying phytoplankton effects is not easy, and satellite remote-sensing can’t do it alone. It also requires in-situ measurements. That’s partly because remote-sensing has to assign a rate of photosynthetic activity to the colors it sees on the ocean where phytoplankton is active. Satellites measurements can’t easily distinguish between photosynthesis activity and irradiance. The study makes use of what’s called the photosynthesis versus irradiance (P-I) curve.
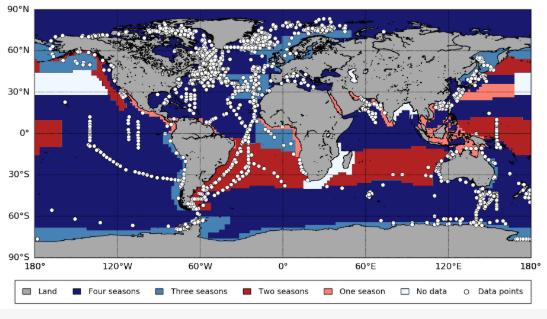
In this study, the authors used 83 different provinces of the ocean, or marine provinces, and they also relied on in-situ measurements of phytoplankton from other studies.

This study is significant not just because it spans two decades. It’s also exceptionally thorough, and makes use of technology that wasn’t available in the past.
In the conclusion of their paper, the authors write “It is the first time that highly quality-controlled, multisensor, inter-sensor-bias-corrected, ocean-colour observations extending over some two decades have been combined with increased spatial and temporal coverage of in situ observations of the photosynthetic parameters of phytoplankton, to compute the magnitude and variability of primary production on a global scale.”
But even with this impressive study, the authors—cautious as scientists—say that this two decades of data can’t tell us about climate change. “Variability in global annual primary production could be related to inter-annual and multidecadal oscillations, such that the present record of ocean-colour observations is not of sufficient length to detect trends associated with climate change.”
The authors also point out the weakness in the data. “Yet, the need to improve P-I data coverage in large areas of the global ocean still remains. In particular, large areas of the Pacific and Indian Oceans remain poorly sampled.”
