Another Ceasing Cepheid

a

[/caption]

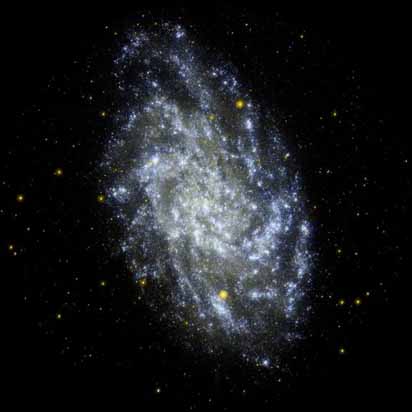
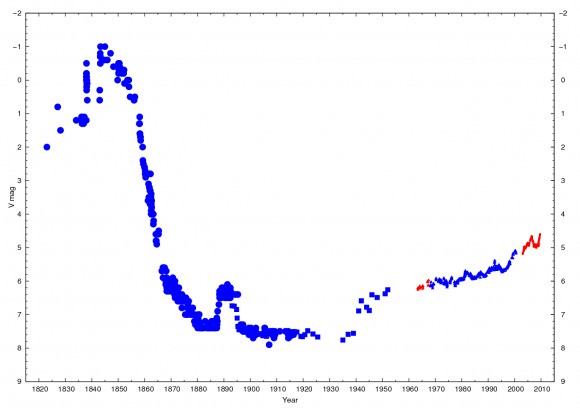
Earlier this year, I wrote an article about a Cepheid variable star named V19 in M31. This Cepheid was one that once pulsated strongly and was one of the variables Hubble first used to find the distance to the Andromeda galaxy. But today, V19 is a rare instance of a Cepheid that has seemingly, stopped pulsating. Another example of this phenomenon is that of Polaris, which has decreased in the amplitude of brightnesses by nearly an order of magnitude in the past century, although some reports indicate that it may be beginning to increase again. Meanwhile, a new paper is looking to add another star, HDE 344787, to this rare category and according to the paper, it may be “even more interesting than Polaris”.

The star in question, HDE 344787, is a F class supergiant. Although the variations in brightness have been difficult to observe, due to their small amplitude, astronomers have revealed two fundamental pulsation modes corresponding to 5.4 days and 3.8 days. But perhaps even more interesting, is that the 5.4 day period seems to be growing. Careful analysis of the data suggests that this period is growing by about 13 seconds per year. This finding is in strong agreement with what is predicted by models of stellar evolution for stars with metallicity similar to the sun passing through the instability strip for the first time.

HDE 344787 is similar in Polaris in that both stars share the same spectral type. However, the existence of two modes of pulsation is not seen in Polaris. The lengthening of the period of pulsation, however, is seen. For Polaris, its variation is growing by 4.5 seconds per year. Another similarity is that, like Polaris and V19, has been decreasing in the amplitudes of its brightness since at least 1890.

While the addition of this star to the collection of Cepheids that have decreased their amplitude, it does little to solve the mystery of why they might do so. Currently, both Polaris and HDE 344787 lie near the middle of the instability strip and, as such, are not simply evolving out of the region of instability. However, the confirmation of second pulsational mode may lend support to the notion that a change in one of these modes may serve to dampen the other, creating an effect known as the Blazhko Effect.

Ultimately, this star will require further observations to understand its nature better. Due the the faintness of this star (~10th magnitude) as well as the small change in brightness from the pulsations and the dense stellar field on which it lies, observations have been notoriously challenging.

M33’s “Object-X”

Often times, objects that are unremarkable in one portion of the spectra, can often be vivid in others. In M33, the Triangulum Galaxy, a star that’s barely visible in the optical, stands out as the second brightest source (and single brightest single star) in the mid-infrared. This unusual star has been the target of a recent study, led by Rubab Khan at the Ohio State University and may help astronomers to understand an unusual supernova from 2008.

The supernova 2008S occurred February first in NGC 6946, the Fireworks Galaxy. Since it happened in a galaxy that is relatively nearby, astronomers seized the opportunity to explore the progenitor star in archival images. Yet images from the Large Binocular Telescope and other optical observatories could not find a star that could be identified as a parent. Instead, the detection of the star responsible came from Spitzer, an infrared observatory. Observations from this instrument indicated that the star responsible may have been unexpectedly low mass for such a powerful explosion leading other astronomers to question whether or not SN 2008S was a true supernova, or merely an impostor in the form of an eruption of a Luminous Blue Variable (LBV), which tend to be more massive stars and would be in stark contradiction to the Spitzer findings.

Yet, regardless of the nature of the nature of SN 2008S, teams all seemed to agree that the progenitor had only been detected in the infrared because it was veiled by a thick curtain of dust. So to help better understand this class of dusty stars, astronomers have been working to uncover more of them, against which they can test their hypotheses.

To find these objects, astronomers have been searching the infrared portion of the spectrum for objects that are exceptionally bright yet lack optical counterparts. The brightest of the stellar sources in M33 features faint star in the red portion of the optical spectrum from the Local Group Galaxies Survey published in 2007, but no star at all in archival records with similar limiting magnitudes from 1949 and 1991. The authors of the new study have dubbed this odd source, Object-X.

The team rules out the possibility that the object could be a young stellar object (YSO), blocked by a thick dust disc along the line of sight, noting that models of even the thickest dust discs still predict more light to be scattered back along the line of sight. Instead, the team concludes that Object-X must be a self-obscured star that has undergone relatively recent mass loss which has cooled to form either graphite or silicate dust. Depending on which type of dust is predominant, the team was able to fit the data to two wildly different temperatures for the star: either 5000 K for graphite, or 20,000 K for the silicate. In all cases, the predicted mass for the central star was always greater than 30 solar masses.

In general, there are two mechanisms by which a star can eject material to form such a curtain. The first is through stellar winds, which increase as the star enters the red giant phase, swelling up and lowering the force of gravity near the surface. The second is “impulsive mass ejections” in which stars shudder and throw mass off that way. A classical example of this is Eta Carinae. The team predicts from the features they found, that Object-X is most likely a cool hypergiant. The fact that the star was completely obscured until very recently hints that the mass loss is not constant (as stellar wind), but patchy, coming from frequent eruptions. As the shell of dust expands, the star should reemerge in the optical, becoming visible again in the next few decades.

Darwin vs. the Sun

The Age of the Sun and Darwinism

[/caption]

Today, we take it for granted that the Sun produces energy via nuclear fusion. However, this realization only came about in the early 1900’s and wasn’t confirmed until several decades later (see the Solar Neutrino Problem). Prior to that, several other methods of energy production had been proposed. These ranged from burning coal to a constant bombardment of comets and meteors to slow contraction. Each of these methods seemed initially plausible, but when astronomers of the time worked out how long each one could sustain such a brightness, they came up against an unlikely opponent: Charles Darwin.

In a “Catholic Magazine and Review” from 1889, known as The Month, there is a good record of the development of the problem faced in an article titled “The Age of the Sun and Darwinism”. It begins with a review of the recently discovered Law of Conservation of Energy in which they establish that a method of generation must be established and that this question is necessarily entangled with the age of the Sun and also, life on Earth. Without a constant generation of energy, the Sun would quickly cool and this was known to be unlikely due to archaeological evidences which hinted that the Sun’s output had been constant for at least 4,000 years.

While burning coal seemed a good candidate since coal power was just coming into fashion at the time, scientists had calculated that even burning in pure oxygen, the Sun could only last ~6,000 years. The article feared that this may signal “the end of supplies of heat and light to our globe would be very near indeed” since religious scholars held the age of the Earth to be some “4000 years of chronological time before the Christian era, and 1800 since”.

The bombardment hypothesis was also examined explaining that the transference of kinetic energy can increase temperatures citing examples of bullets striking metal surfaces or hammers heating anvils. But again, calculations hinted that this too was wrong. The rate with which the Sun would have to accumulate mass was extremely high. So much so that it would lead to the “derangement of the whole mechanism of the heavens.” The result would be that the period of the year over the past ~6,000 years would have shortened by six weeks and that the Earth too would be constantly bombarded by meteors (although some especially strong meteor showers at that time lent some credence to this).

The only strong candidate left was that of gravitational contraction proposed by Sir William Thomson (later Lord Kelvin) and Hermann von Helmholtz in a series of papers they began publishing in 1854. But in 1859, Darwin published the Origin of Species in which he required an age of at least two billion years. Thomson’s and Helmholtz’s hypothesis could only support an age of some tens of millions of years. Thus astronomy and biology were brought head to head. Darwin was fully aware of this problem. In a letter to a friend, he wrote that, “Thomson’s views of the recent age of the world have been for some time one of my sorest troubles”.

To back the astronomers was the developing field of spectroscopy in which they determined that the sun and other stars bared a strong similarity to that of nebulae. These nebulae could contract under their own gravity and as such, provided a natural establishment for the formation of stars, leading gracefully into the contraction hypothesis. Although not mentioned in the article, Darwin did have some support from geologists like Charles Lyell who studied the formation of mountain ranges and also posited an older Earth.

Some astronomers attempted to add other methods in addition to gravitational contraction (such as tidal friction) to extend the age of the solar system, but none could reach the age required by Darwin. Similarly, some biologists worked to speed up evolutionary processes by positing separate events of abiogenesis to shave off some of the required time for diversification of various kingdoms. But these too could not rectify the problem.

Ultimately, the article throws its weight in the camp of the doomed astronomers. Interestingly, much of the same rhetoric in use by anti-evolutionists today can be found in the article. They state, “it is not surprising to find men of science, who not only have not the slightest doubt about the truth of their own pet theories, but are ready to lay down the law in the realms of philosophy and theology, in science which with, to judge from their immoderate assertions, their acquaintance is of the most remote? Such language is to be expected from the camp-followers in the army of science, who assurance is generally inversely proportional to their knowledge, for many of those in a word who affect to popularize the doctrine of Natural Selection.”

In time, Darwin would win the battle as astronomers would realize that gravitational contraction was just the match that lit the fuse of fusion. However, we must ask whether scientists would have been as quickly able to accept the proposition of stellar fusion had Darwin not pointed out the fundamental contradiction in ages?

Longstanding Cepheid Mass Mystery Finally Solved

An artist's impression of the binary system OGLE-LMC-CEP0227, which contains a classical Cepheid variable star. By measuring this system, astronomers were able to settle a longstanding debate over the masses of these types of stars. Image credit: ESO/L. Calçada

[/caption]

Cepheid variable stars – a class of stars that vary in brightness over time – have long been used to help measure distances in our local region of the Universe. Since their discovery in 1784 by Edward Pigott, further refinements have been made about the relationship between the period of their variability and their luminosity, and Cepheids have been closely studied and monitored by professional and amateur astronomers.

But as predictable as their periodic pulsations have become, a key aspect of Cepheid variables has never been well-understood: their mass. Two different theories – stellar evolution and stellar pulsation – have given different answers as to the masses that these stars should be. What has long been needed to correct this error was a system of eclipsing binary stars that contained a Cepheid, so that the orbital calculations could yield the mass of the star to a high degree of accuracy. Such a system has finally been discovered, and the mass of the Cepheid it contains has been calculated to within 1%, effectively ending a discrepancy that has persisted since the 1960s.

The system, named OGLE-LMC-CEP0227, contains a classical Cepheid variable (as opposed to a Type II Cepheid, which is of lower mass and takes a different evolutionary track) that varies over 3.8 days. It is located in the Large Magellanic Cloud, and as the stars orbit each other over a period of 310 days, they eclipse each other from our perspective on Earth. It was detected as part of the Optical Gravitational Lensing Experiment, and you can see from the acronym soup that this yields the first part of the name, the Large Magellanic Cloud the second, and CEP stands for Cepheid.

A team of international astronomers headed by Grzegorz Pietrzynski of Universidad de Concepción, Chile and Obserwatorium Astronomiczne Uniwersytetu Warszawskiego, Poland measured the spectra of the system using the MIKE spectrograph at the 6.5-m Magellan Clay telescope at the Las Campanas Observatory in Chile and the HARPS spectrograph attached to the 3.6-m telescope of the European Southern Observatory at La Silla.

The team also measured the changes in brightness and slight red and blueshift of the light from the stars as they orbited each other, as well as the pulsing of the Cepheid. By taking all of these measurements, they were able to create a model of the masses of the stars that should yield the orbital mechanics of the system. In the end, the mass predicted by stellar pulsation theory agreed much more with the calculated mass than that predicted by stellar evolution theory. In other words, stellar pulsation theory FTW!!

They published their results today in a letter to Nature, and write in the conclusion of the letter: “The overestimation of Cepheid masses by stellar evolution theory may be the consequence of significant mass loss suffered by Cepheids during the pulsation phase of their lives – such loss could occur through radial motions and shocks in the atmosphere. The existence of mild internal core mixing in the main-sequence progenitor of the Cepheid, which would tend to decrease its evolutionary mass estimate, is another possible way to reconcile the evolutionary mass of Cepheids with their pulsation mass.”

Cepheid variables take their names from the star Delta Cephei (in the constellation Cepheus), which was discovered by John Goodricke to be a variable star a few months after Pigott’s discovery in 1784. There are many different types of variable stars, and if you are interested in learning more or even participating in observing and recording their variability, the American Association of Variable Star Observers has a wealth of information.

Source: ESO, original Nature letter

ω Centauri’s Red Giants Confirm Stellar Evolution Models

As the get older, Sun-like stars become red giants. 30-50 percent of these red giants exhibit a strange variability in their brightness that has so far eluded explanation. Image Credit: ESO/S. Steinhofel

[/caption]

While science education often focuses on teaching the scientific method (or at least tries to), the real process of science is often far less linear. Theories tie together so many points of data, that making singular predictions that confirm or refute a proposition is often challenging. Such is the case for stellar evolution. The understanding is woven together from so many independent pieces, that the process is more of a roaring sea than a directed river.

Realizing this, I’ve been keen on instances in which necessary predictions are observationally confirmed later. A new study, led by Mariela Vieytes from the University of Buenos Aires and accepted in an upcoming publication of Astronomy & Astrophysics, does just that by demonstrating one of the necessary conditions for predictions of post main sequence evolution. Specifically, astronomers need to establish that stars undergo significant amounts of mass loss (~0.1-0.3 M) during their red giant branch evolution. This requirement was set forth as part of the expected behavior necessary to explain: “i) the very existence of the horizontal branch (HB) and its morphology, ii) the pulsational properties of RR Lyrae stars, iii) the absence of asymptotic giant branch (AGB) stars brighter than the red giant branch (RGB) tip, and the chemistry and characteristics in the AGB, post-AGB and planetary nebula evolutionary phases, iv) the mass of white dwarf (WD) stars.”

Astronomers expected to find confirmation of this mass loss by detecting gas congregating in the cores of globular clusters after being shed by stars evolving along the RGB. Yet searches for this gas came up mostly empty. Eventually astronomers realized that gas would be stripped relatively quickly as globular clusters plunged through the galactic plane. But this left them with the need to confirm the prediction in some other manner.

One way to do this is to look at the stars themselves. If they show velocities in their photospheres greater than the escape velocity, they will lose mass. Just how much higher will determine the amount of mass lost. By analyzing the Doppler shift of specific absorption lines of several stars in the cluster ω Centauri, the team was able to match the amount of mass being lost to predictions from evolutionary models. From this, the team concluded that their target stars were losing between the rates of mass loss are estimated as a few 10-9 and 10-10 M yr-1. This is in general agreement with the predictions set forth by evolutionary models.

Poor in one, Rich in another

Tycho's Supernova Remnant. Credit: Spitzer, Chandra and Calar Alto Telescopes.

[/caption]

Just over three years ago, I wrote a blog post commemorating the 50th anniversary of one of the most notable papers in the history of astronomy. In this paper, Burbidge, Burbidge, Fowler, and Hoyle laid out the groundwork for our understanding of how the universe builds up heavy elements.

The short version of the story is that there are two main processes identified: The slow (s) process and the rapid (r) process. The s-process is the one we often think about in which atoms are slowly bombarded with protons and neutrons, building up their atomic mass. But as the paper pointed out, this often happens too slowly to pass roadblocks to this process posed by unstable isotopes which don’t last long enough to catch another one before falling back down to lower atomic number. In this case, the r-process is needed in which the flux of nucleons is much higher in order to overcome the barrier.

The combination of these two processes has done remarkably well in matching observations of what we see in the universe at large. But astronomers can never rest easily. The universe always has its oddities. One example is stars with very odd relative amounts of the elements built up by these processes. Since the s-process is far more common, they’re what we should see primarily, but in some stars, such as SDSS J2357-0052, there exists an exceptionally high concentration of the rare r-process elements. A recent paper explores this elemental enigma.

As the designation implies, SDSS J2357-0052’s uniqueness was discovered by the Sloan Digital Sky Survey (SDSS). The survey uses several filters to image fields of stars at different wavelengths. Some of the filters are chosen to lie in wavelength ranges in which there are well known absorption lines for elements known to be tracers of overall metallicity. This photometric system allowed an international team of astronomers, led by Wako Aoki of the National Astronomical Observatory in Tokyo, to get a quick and dirty view of the metal content of the stars and choose interesting ones for followup study.

These followup observations were done with high resolution spectroscopy and showed that the star had less than one one-thousandth the amount of iron that the Sun does ([Fe/H] = -3.4), placing it among the most metal poor stars ever discovered. However, iron is the end of the elements produced by the s-process. When going beyond that atomic number, the relative abundances drop off very quickly. While the drop off in SDSS J2357-0052 was still steep, it wasn’t near as dramatic as in most other stars. This star had a dramatic enhancement of the r-process elements.

Yet this wasn’t exceptional in and of itself. Several metal poor stars have been discovered with such r-process enhancements. But none coupled with such an extreme deficiency of iron. The implication of this combination is that this star was very close to a supernova. The authors suggest two scenarios that can explain the observations. In the first, the supernova occurred before the star formed, and SDSS J2357-0052 was formed in the immediate vicinity before the enhanced material would be able to disperse and mix into the interstellar medium. The second is that SDSS J2357-0052 was an already formed star in a binary orbit with a star that became a supernova. If the latter case is true, it would likely give the smaller star a large “kick” as the mass holding the system would change dramatically. Although no exceptional radial velocity was detected for SDSS J2357-0052, the motion (if it exists) could be in the plane of the sky requiring proper motion studies to either confirm or refute this possibility.

The authors also note that the first star with somewhat similar characteristics (although not as extreme), was discovered first in the outer halo where the likelihood of the necessary supernova occurring is low. As such, it is more likely that that star was ejected in such a process establishing some credibility for the scenario in general, even if not the case for SDSS J2357-0052.

Main Sequence

Hertzsprung-Russell Diagram. Credit: ESO.

If you make a plot of the brightness of a few thousand stars near us, against their color (or surface temperature) – a Hertzsprung-Russell diagram – you’ll see that most of them are on a nearly straight, diagonal, line, going from faint and red to bright and blue. That line is the main sequence (of course, you must plot the absolute brightness – or luminosity – not the apparent brightness; do you know why?).

As you might have expected, the discovery of the main sequence had to wait until the distances to at least a few hundred stars could be reasonably well estimated (so their absolute magnitudes, or luminosities, could be worked out). This happened in the early years of the 20th century (fun fact: Russell’s discovery was how absolute luminosity was related to spectral class – OBAFGKM – rather than color).

So why, then, do most stars seem to lie on the main sequence? Why don’t we find stars all over the H-R diagram?

Back in the 19th century, it would have been impossible to answer these questions, because quantum theory hadn’t been invented then, and no one knew about nuclear fusion, or even what powered the Sun. By the 1930s, however, the main outlines of the answers became clear … stars on the main sequence are powered by hydrogen fusion, which takes place in their cores, and the main sequence is just a sequence of mass (faint red stars are the least massive – starting at around one-tenth that of the Sun – and bright blue ones the most – about 20 times). Stars are found elsewhere on the Hertzsprung Russell diagram, and their positions reflect what nuclear reactions are powering them, and where they are taking place (or not; white dwarfs are cinders, slowly cooling). So, broadly speaking, there are so many stars on the main sequence – compared to elsewhere in the H-R diagram – because stars spend much more of their lives burning hydrogen in their cores than they do producing energy in any other way!

It took many decades of research to work out the details of stellar evolution – what nuclear reactions for what mass and composition of a star, how the size of a star reflects its internal structure and composition, how some stars can live on long after they should be white dwarfs, etc, etc, etc – and there are still many unanswered questions today (maybe you can help solve them?).

The Main Sequence (University of Utah), Main Sequence Stars (University of Oregon), and Stars (NASA’s Imagine the Universe) are three good places to go to learn more.

Dating a Cluster – A New Trick, V is For Valentine… V838, and Capture A FUor! are just three of the many Universe Today stories which feature the main sequence.

Astronomy Cast covers the main sequence from the point of view of stellar evolution in The Life of the Sun and The Life of Other Stars; be sure to check them out.

References:
NASA
Hyperphysics

Nucleosynthesis

‘Nucleo-‘ means ‘to do with nuclei’; ‘synthesis’ means ‘to make’, so nucleosynthesis is the creation of (new) atomic nuclei.

In astronomy – and astrophysics and cosmology – there are two main kinds of nucleosynthesis, Big Bang nucleosynthesis (BBN), and stellar nucleosynthesis.

In the amazingly successful set of theories which are popularly called the Big Bang theory, the early universe was very dense, and very hot. As it expanded, it cooled, and the quark-gluon plasma ‘froze’ into neutrons and protons (and other hadrons, but their role in BBN was marginal), which interacted furiously … lots and lots of nuclear reactions. The universe continued to cool, and soon became too cold for any further nuclear reactions … the unstable isotopes left then decayed, as did the neutrons not already in some nucleus or other. Most matter was then hydrogen (actually just protons; the electrons were not captured to form atoms until much later), and helium-4 (alpha particles) … with a sprinkling of deuterium, a dash of helium-3, and a trace of lithium-7.

That’s BBN.

The atoms in your body – apart from the hydrogen – were all made in stars … by stellar nucleosynthesis.

Stars on the main sequence get the energy they shine by from nuclear reactions in their cores; off the main sequence, the energy comes from nuclear reactions in a shell (or more than one shell) around the core. There are several different nuclear reaction cycles, or processes (e.g. triple alpha, s process, proton-proton chain, CNO cycle), but the end result is the fusion of hydrogen (and helium) to produce carbon, nitrogen, oxygen, … and the iron group (iron, cobalt, nickel). In the red giant phase of a star’s life, much of this matter ends up in the interstellar medium … and one day in your body.

There are other ways new nuclei can be created, in the universe (other than BBN and stellar nucleosynthesis); for example, when a high energy particle (a cosmic ray) collides with a nucleus in the interstellar medium (or the Earth’s atmosphere), it breaks it into two or more pieces (this process is called cosmic ray spallation). This produces most of the lithium (apart from the BBN 7Li), beryllium, and boron.

And one more: in a supernova, especially a core collapse supernova, huge quantities of new nuclei are synthesized, very quickly, in the nuclear reactions triggered by the flood of neutrons. This ‘r process’, as it is called (actually there’s more than one) produces most of the elements heavier than the iron group (copper to uranium), directly or by radioactive decay of unstable isotopes produced directly.

Like to learn more? Here are a few links that might interest you: Nucleosynthesis (NASA’s Cosmicopia), Big Bang Nucleosynthesis (Martin White, University of California, Berkeley), and Stellar Nucleosynthesis (Ohio University).

Plenty of Universe Today stories on this topic too; for example Stars at Milky Way Core ‘Exhale’ Carbon, Oxygen, Astronomers Simulate the First Stars Formed After the Big Bang, and Neutron Stars Have Crusts of Super-Steel.

Check out this Astronomy Cast episode, tailor-made for this Guide to Space article: Nucleosynthesis: Elements from Stars.

Sources:
NASA
Wikipedia
UC-Berkeley

Spitzer Peers Into the Small Magellanic Cloud

Spitzer Image of the Small Magellanic Cloud

This week at the AAC Conference, astronomers released a new image of the Small Magellanic Cloud (SMC, a dwarf galaxy just outside our Milky Way) from Spitzer. The purpose of the image was to study “the life cycle of dust in this galaxy.” In this life cycle, clouds of gas and dust collapse to form new stars. As those stars die, they create new dust in their atmosphere which will enrich the galaxy and, when the stars give off that dust, will be made available future generations of stars. The rate at which this process occurs determines how fast the galaxy will evolve. This research has shown that the SMC is far less evolved than our on galaxy and only has 20% of the heavy elements that our own galaxy has. Such unevolved galaxies are reminiscent of the building blocks of larger galaxies.

As with most astronomical images, this new image is taken in different filters which correspond to different wavelengths of light. The red is 24 microns and traces mainly cool dust which is part of the reservoir from which new star formation can occur. Green represents the 8 micron wavelength and traces warmer dust in which new stars are forming. The blue is even warmer at 3.6 microns and shows older stars which have already cleared out their local region of gas and dust. By combining the amount of each of these, astronomers are able to determine the current rate at which evolution is taking place in order to understand how the evolution of the SMC is progressing.

The new research shows that the tail (lower right in this image) is tidal in nature as it’s being tugged on by gravitational interactions with the Milky Way. This tidal interaction has caused new star formation in the galaxy. Surprisingly, the team of researchers also indicated that their work may indicate that the Magellanic Clouds are not gravitational bound to the Milky Way and may just be passing.

More images can be found at the JPL website.

Eta Carinae- A Naked Eye Enigma

Credit: X-ray: NASA/CXC/GSFC/M.Corcoran et al.; Optical: NASA/STScI

[/caption]

Eta Carinae is a beast of a star. At more than 100 solar masses and 4 million times the luminosity of our Sun, eta Car balances dangerously on the edge of stellar stability and it’s ultimate fate: complete self-destruction as a supernova. Recently, Hubble Space Telescope observations of the central star in the eta Carinae Nebula have raised an alert on eta Car among the professional community. What they discovered was totally unexpected.

“It used to be, that if you looked at eta Car you saw a nebula and then a faint little core in the middle” said Dr. Kris Davidson, from the University of Minnesota. “Now when you look at it, it’s basically the star with a nebula. The appearance is completely different. The light from the star now accounts for more than half the total output of eta Car. I didn’t expect that to happen until the middle of this century. It’s decades ahead of schedule. We know so little about these very massive objects, that if eta Car becomes a supernova next Thursday we should not be very surprised.”

In 1843, eta Carinae underwent a spectacular eruption, making it the second brightest star in the sky behind Sirius. During this violent episode, eta Car ejected 2 to 3 solar masses of material from the star’s polar regions. This material, traveling at speeds close to 700 km/s, formed two large, bipolar lobes, now known as the Homunculus Nebula. After the great eruption, Eta Car faded, erupted again briefly fifty years later, then settled down, around 8th magnitude. Davidson picks up the story from there.

This light curve depicts the visual apparent brightness of Eta Car from 1822 to date. It contains visual estimates (big circles), photographic (squares), photoelectric (triangles) and CCD (small circles) observations. All of them have been fitted for consistency of the whole data. Red points are recent observations from La Plata (Feinstein 1967; Fernández-Lajús et al., 2009, 2010). Used by permission.

“Around 1940, Eta suddenly changed its state. The spectrum changed and the brightness started to increase. Unfortunately, all this happened at a time when almost no one was looking at it. So we don’t know exactly what happened. All we know is that by the 1950’s, the spectrum had high excitation Helium lines in it that it didn’t have before, and the whole object, the star plus the Homunculus, was gradually increasing in brightness. In the past we’ve seen three changes of state. I suspect we are seeing another one happening now.”

During this whole time eta Car has been shedding material via its ferocious stellar winds. This has resulted in an opaque cloud of dust in the immediate vicinity of the star. Normally, this much dust would block our view to the star. So how does Davidson explain this recent, sudden increase in the luminosity of eta Carinae?

“The direct brightening we see is probably the dust being cleared away, but it can’t be merely the expansion of the dust. If it’s clearing away that fast, either something is destroying the dust, or the stellar wind is not producing as much dust as it did before. Personally, I think the stellar wind is decreasing, and the star is returning to the state it was in more than three hundred years ago. In the 1670’s, it was a fourth magnitude, blue, hot star. I think it is returning to that state. Eta Carinae has just taken this long to readjust from its explosion in the 1840’s.”

After 150 years what do we really know about one of the great mysteries of stellar physics? “We don’t understand it, and don’t believe anyone who says they do,” said Davidson.  “The problem is we don’t have a real honest-to-God model, and one of the reasons for that is we don’t have a real honest-to-God explanation of what happened in 1843.”

Can amateur astronomers with modest equipment help untangle the mysteries of eta Carinae? Davidson think so, “The main thing is to make sure everyone in the southern hemisphere knows about it, and anyone with a telescope, CCD or spectrograph should have it pointed at eta Carinae every clear night.”