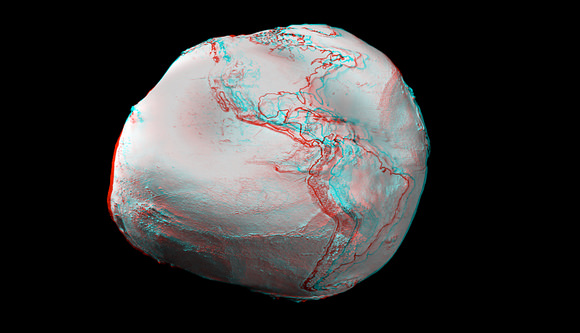
GOCE Satellite Begins Mapping Earth’s Gravity in Lower Orbit Than Expected

Anaglyph images created from an ESA video animation of global gravity gradients. A more accurate global map will be generated by ESA's GOCE craft. Credit: ESA and Nathaniel Burton Bradford.

[/caption]
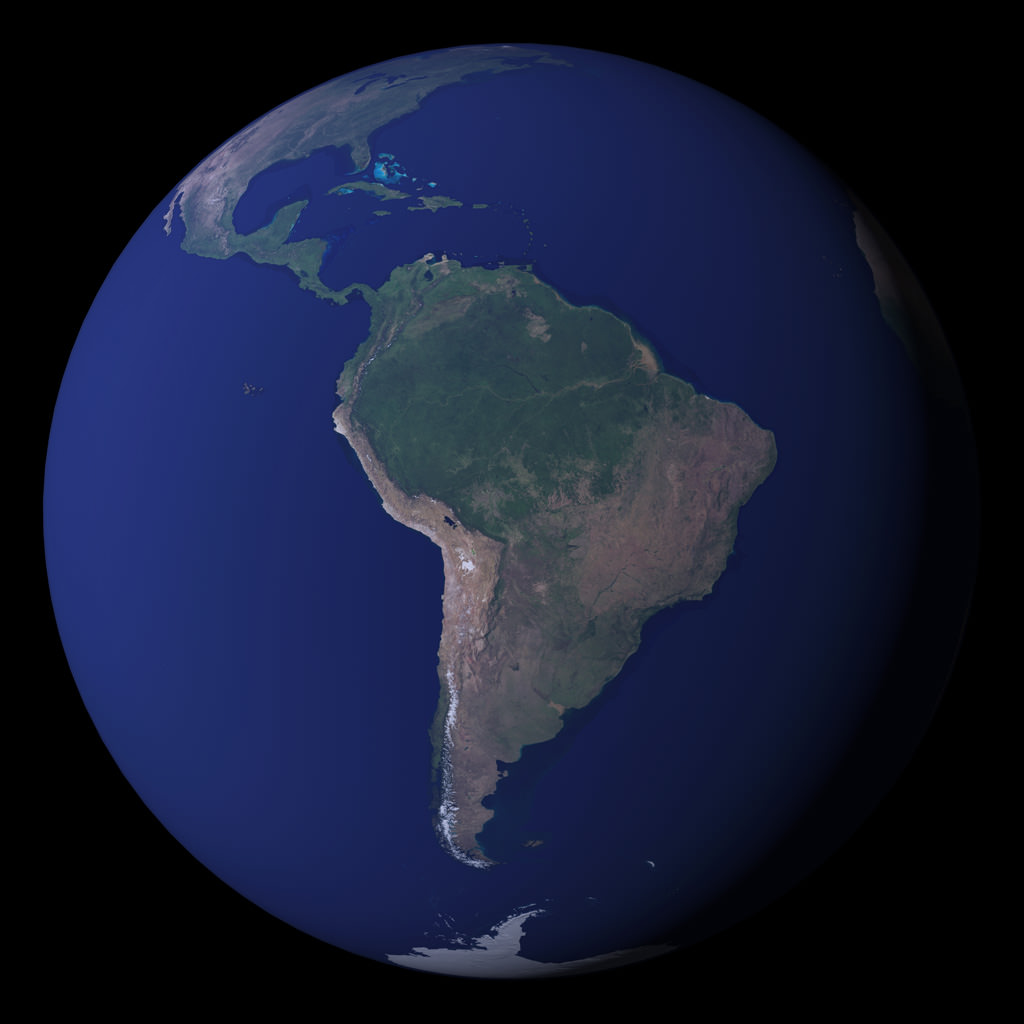
Is Earth’s gravity field as intriguing and misshapen as this image above? We’re about to find out. The sexy looking Gravity field and steady-state Ocean Circulation Explorer or GOCE satellite has completed its calibration and is now in its science orbit to map the tiny variations of Earth’s gravity in unprecedented detail. And it turns out the sun’s current period of low solar activity has a side benefit for the GOCE mission. Less solar activity means a calmer environment for GOCE in its low Earth orbit, so its current orbit of 255 km is a few kilometers lower than engineers had originally planned. This is good news – the gravity measurements being made at the moment will be even more accurate.

“The completion of the commissioning and first in-flight calibration marks an important milestone for the mission, ” said Rune Floberghagen, ESA’s GOCE Mission Manager. “We are now entering science operations and are looking forward to receiving and processing excellent three-dimensional information on the structure of Earth’s gravity field.”

Anaglyph created from an ESA GOCE craft animation. Credit:  ESA and Nathanial Burton Bradford
Anaglyph created from an ESA GOCE craft animation. Credit: ESA and Nathanial Burton Bradford

Gravity is stronger closer to Earth, so GOCE was designed to orbit as low as possible while remaining stable as it flies through the fringes of our atmosphere. GOCE’s sleek aerodynamic design helps this the satellite to cut though the tenuous fringes of Earth’s atmosphere at this low altitude. Moreover, the electric ion thruster at the back continuously generates tiny forces to compensate for any drag that GOCE experiences along its orbit.

To help avoid drag and ensure that the gravity measurements are of true gravity, the satellite has to be kept stable in ‘free fall’. Any buffeting from residual air at this low altitude could potentially drown out the gravity data.

Space gradiometry and the use of the sophisticated electric propulsion are both ‘firsts’ in satellite technology, so the commissioning and calibration were particularly important for the success of the mission. This phase was completed in the summer, ready for the tricky task of bringing GOCE down to its operational altitude, which took a couple of months.

Worldwide gravity gradients from simulations. GOCE is now gathering data such as shown here to map Earth's gravity with unprecedented accuracy and spatial resolution. Credit:  ESA
Worldwide gravity gradients from simulations. GOCE is now gathering data such as shown here to map Earth's gravity with unprecedented accuracy and spatial resolution. Credit: ESA

Over two six-month uninterrupted periods, GOCE will map these subtle variations with extreme detail and accuracy. This will result in a unique model of the ‘geoid’ – the surface of an ideal global ocean at rest.

A precise knowledge of the geoid is crucial for accurate measurement of ocean circulation and sea-level change, both of which are influenced by climate. The data from GOCE are also much-needed to understand the processes occurring inside Earth. In addition, by providing a global reference to compare heights anywhere in the world, the GOCE-derived geoid will be used for practical applications in areas such as surveying and leveling.

Stay tuned for some unique data about our home planet from GOCE.

Thanks to Nathanial Burton-Bradford for the terrific anaglyphs he created from a GOCE animation. See more of Nathanial’s images on his Flickr page.

Source: ESA

Satellite Map of the World

World satellite map. Image credit: NASA

There’s no better way to appreciate the planet you live on than to have a great big picture of it on your wall. Here are some ways you can get your hands on a satellite map of the world.

If you’ve got a nice printer and you’d like to save yourself some money, why not download a satellite map of the world for free from NASA. You can get free satellite images from the NASA Earth Observatory.

[/caption]

Each month NASA releases a new composite satellite image of the entire planet. This lets you track changes from month to month. You can view the full images on this page.

NASA satellite map of the Earth

You can also get a free satellite map of the world captured at night. This photo shows whole planet Earth, but now you’re seeing it at night. The bright spots are cities and populated areas. It’s easy to see the differences between 1st world countries and more developing nations.

Earth lights at night.

If you want to just buy a poster that you can put on your wall, you can find a bunch of satellite world maps from Amazon.com. Here’s a link to buy the Earth at night poster. And here’s an image of the whole Earth by day.

50 Years Ago: Explorer 1

conference-5161.thumbnail.jpg

The launch of Sputnik in October 1957 changed the world overnight. And with the Soviet Union’s second successful launch of Sputnik 2 the following month, Americans were feeling a little left behind in the dust, especially after the US’s first satellite launch attempt with the Vanguard rocket exploded on the launchpad. But space pioneer Werner Von Braun, shown in this picture with JPL Director William Pickering and scientist James Van Allen, came through with his Jupiter C rocket that launched the US’s first satellite, Explorer 1, into space on January 31, 1958.

Explorer 1 was not all that big, with a length of 203 centimeters (80 inches), a diameter of 15.9 centimeters (6.25 inches), and a weight of 14 kilograms (30.8 pounds). But it did its job, which was, first and foremost, to reach orbit, and then return scientific information.

The Jet Propulsion Laboratory got the assignment of designing and building a scientific payload for the launch, which they accomplished in three months.

The primary science instrument on Explorer 1 was a cosmic ray detector designed to measure the radiation above the atmosphere. Dr. James Van Allen designed the experiment, which revealed a much lower cosmic ray count than expected. Van Allen theorized that the instrument may have been saturated by very strong radiation from a belt of charged particles trapped in space by Earth’s magnetic field. A subsequent launch by Explorer 3 two months later confirmed the existence of these radiation belts, which became known as the Van Allen Belts, in honor of their discoverer.

There were other scientific findings from Explorer 1 as well. Because of its symmetrical shape, Explorer 1 was used to help determine the upper atmospheric densities.

Two other instruments on board looked for micrometeorites in orbit: a micrometeorite detector and an acoustic microphone to detect the sound of an micrometeorite impact. The micrometeorite detector was made of a grid of electrical wires. A micrometeorite of about 10 microns would fracture a wire upon impact, destroy the electrical connection, and record the event. One or two of the wires were destroyed during launch. The equipment worked for about 60 days, but showed only one possible meteorite impact. Data from the acoustical sensor microphone were obtained only when an impact occurred while the satellite was over a ground recording station. However, over an 11-day period (February 1, 1958, to February 12, 1958), 145 impacts were recorded. The high impact rates on one portion of the orbit and the subsequent failures in the satellite’s electronic system were attributed to a meteor shower.

The batteries ran out on Explorer 1 on May 23, 1958 when the last signal was recorded. The US’s first satellite burned up in re-entry of the atmosphere in March of 1970.

Original News Source: Explorer 1