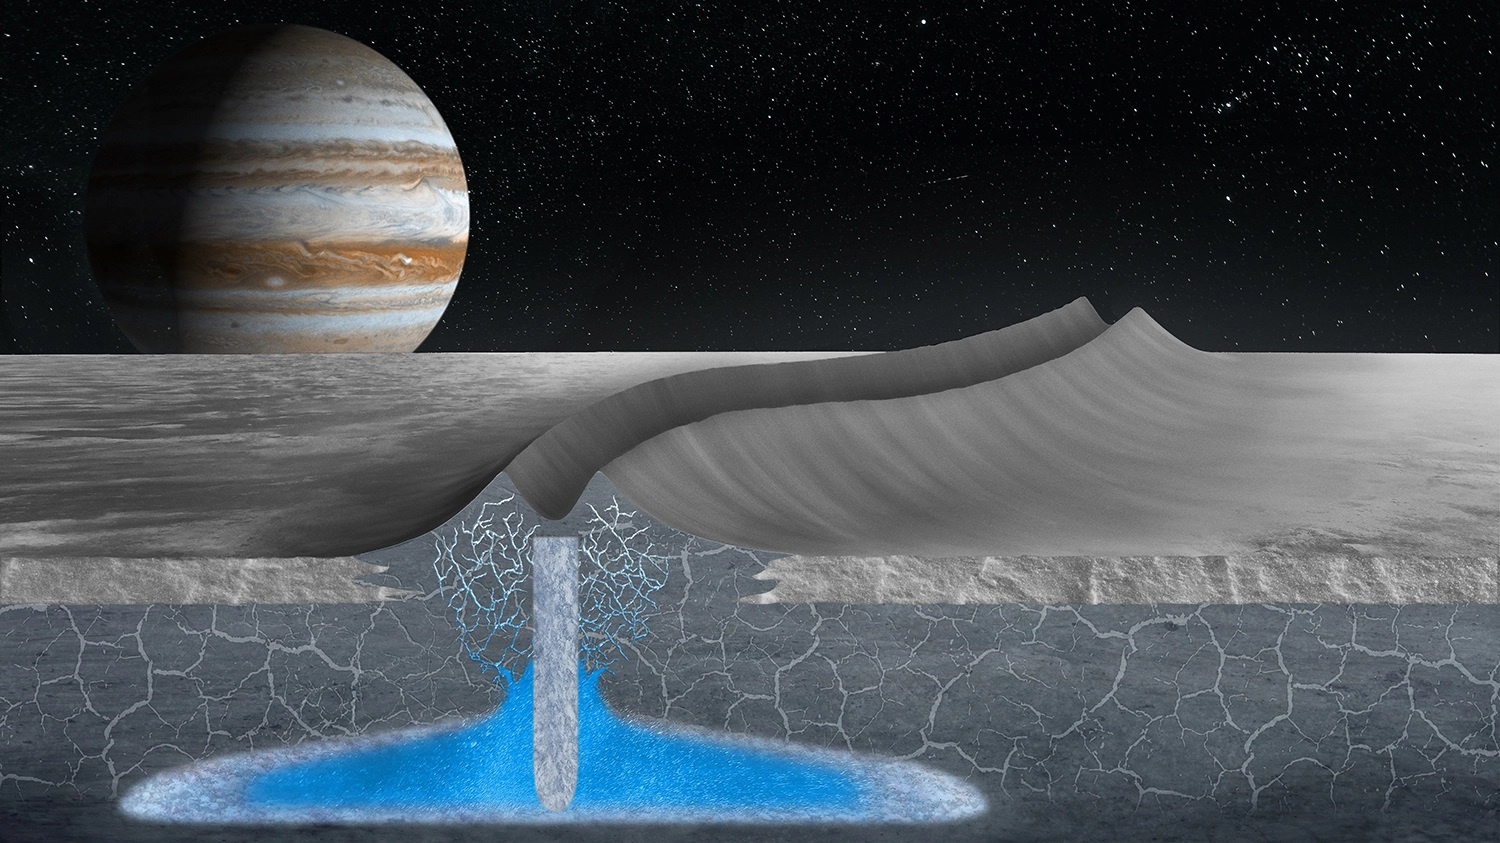
This artist’s conception shows how double ridges on the surface of Jupiter’s moon Europa may form over shallow, refreezing water pockets within the ice shell. This mechanism is based on the study of an analogous double ridge feature found on Earth’s Greenland Ice Sheet. (Image credit: Justice Blaine Wainwright)
Beneath the surface of Jupiter’s icy moon Europa, there’s an ocean up to 100 km (62 mi) deep that has two to three times the volume of every ocean on Earth combined. Even more exciting is how this ocean is subject to hydrothermal activity, which means it may have all the necessary ingredients for life. Because of this, Europa is considered one of the most likely places for extraterrestrial life (beyond Mars). Hence, mission planners and astrobiologists are eager to send a mission there to study it closer.
Unfortunately, Europa’s icy surface makes the possibility of sampling this ocean rather difficult. According to the two predominant models for Europa’s structure, the ice sheet could be a few hundred meters to several dozen kilometers thick. Luckily, new research by a team from Stanford University has shown that Europa’s icy shell may have an abundance of water pockets inside, as indicated by features on the surface that look remarkably like icy ridges here on Earth.
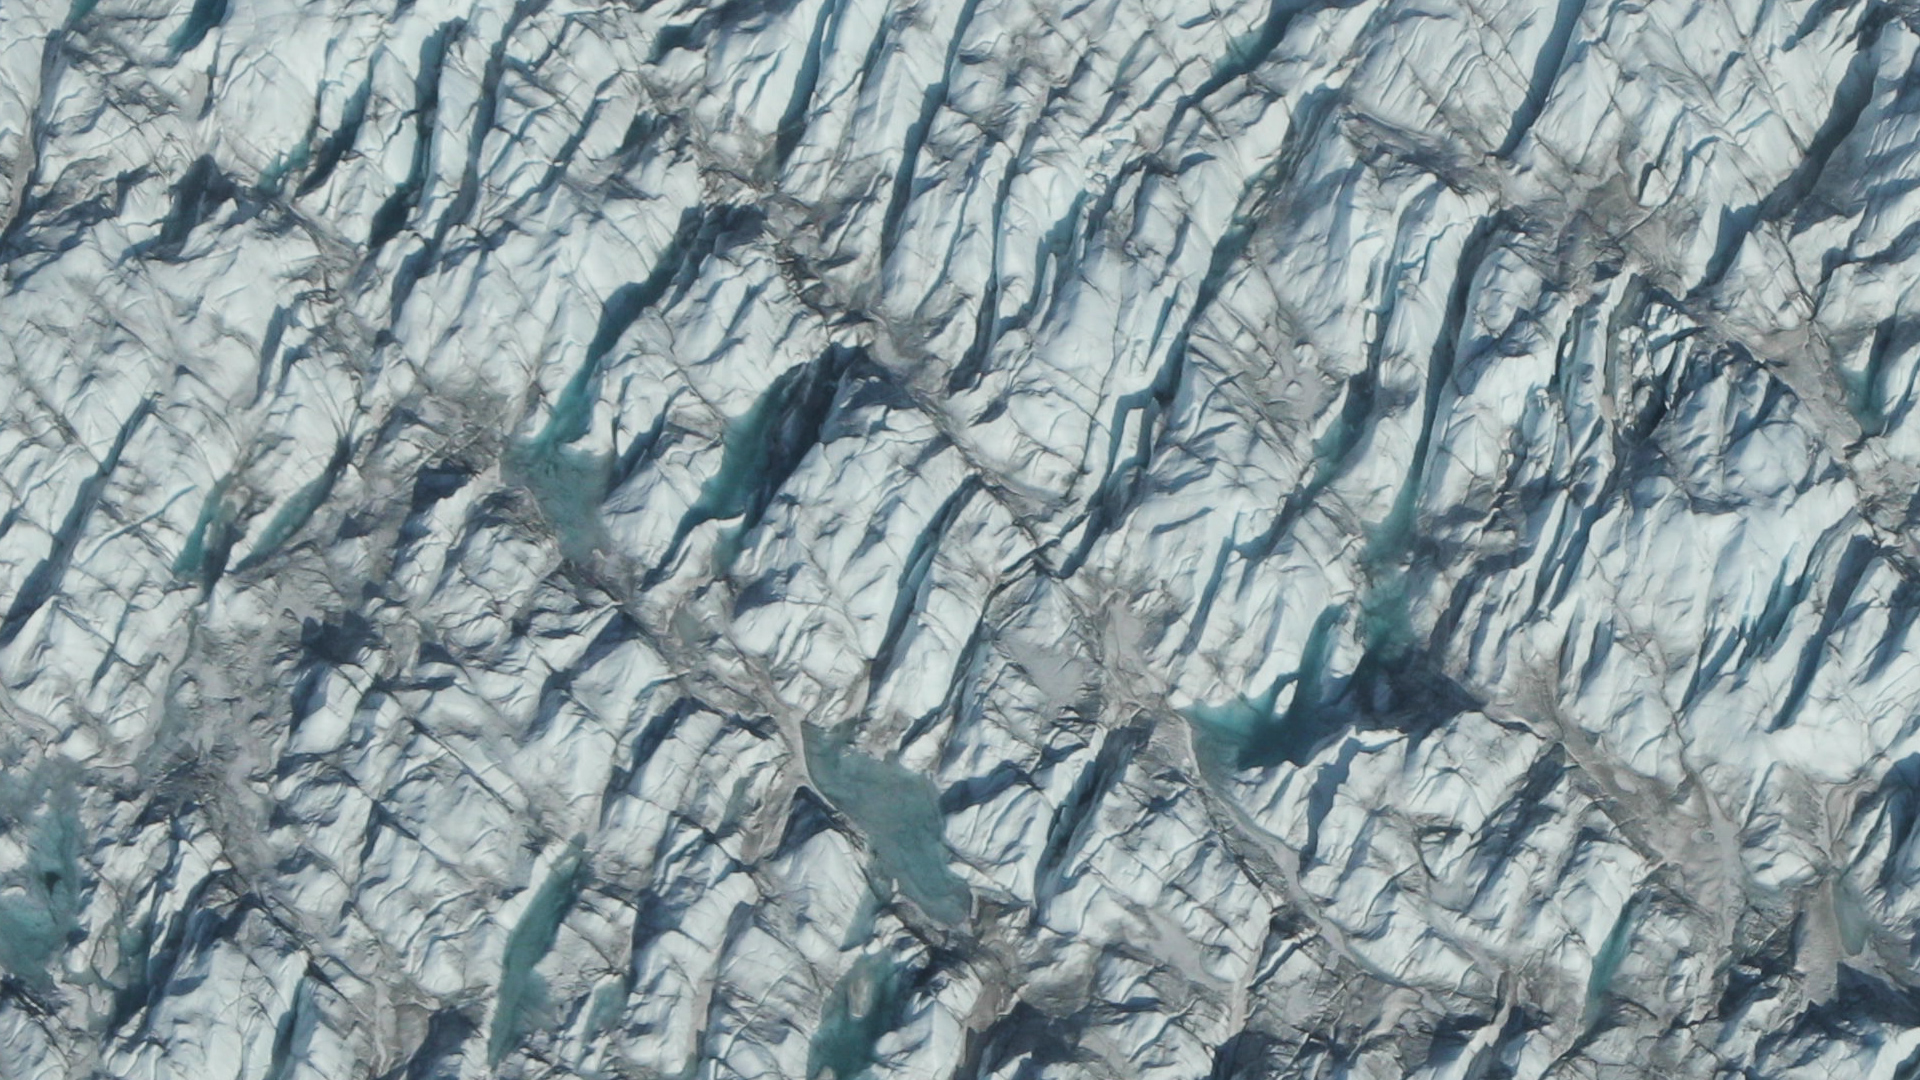
The Greenland ice sheet could be gone in a thousand years. Don't buy waterfront property. Image Credit: NASA
Great news! Humankind’s greatest-ever engineering project is nearing completion. Soon we will have warmed the Earth enough to get rid of all those pesky ice sheets and other frozen areas. The finish line is in sight.
If we all work together for the next thousand years, we’ll finally reach our goal!
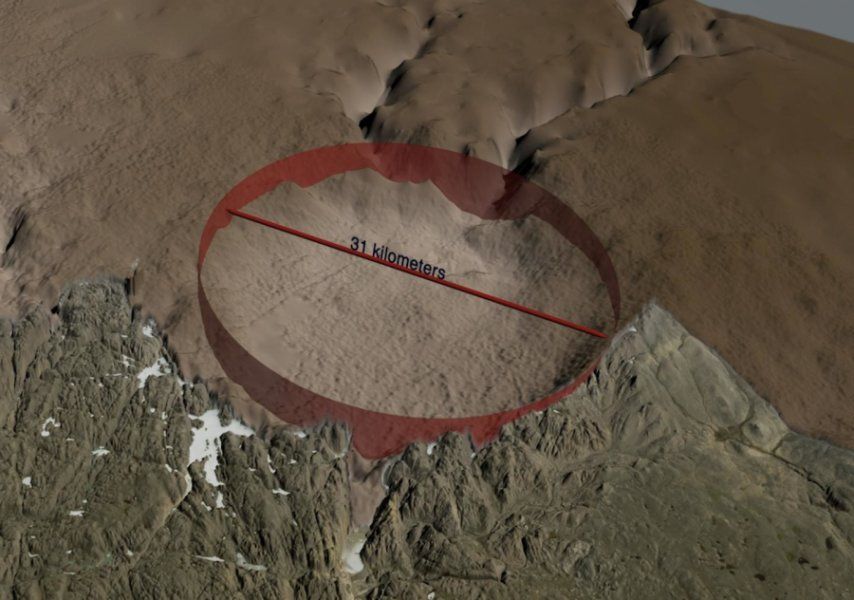
The newly-discovered crater is 31 km. across, larger than Paris. Image: NASA's Goddard Space Flight Center.
An international team of scientists have discovered what lay hidden under Arctic ice for thousands or even hundreds of thousands of years. Using data primarily from NASA’s Operation IceBridge, they discovered one of the 25 largest impact craters anywhere on Earth. And its discovery may re-ignite an old climate debate.
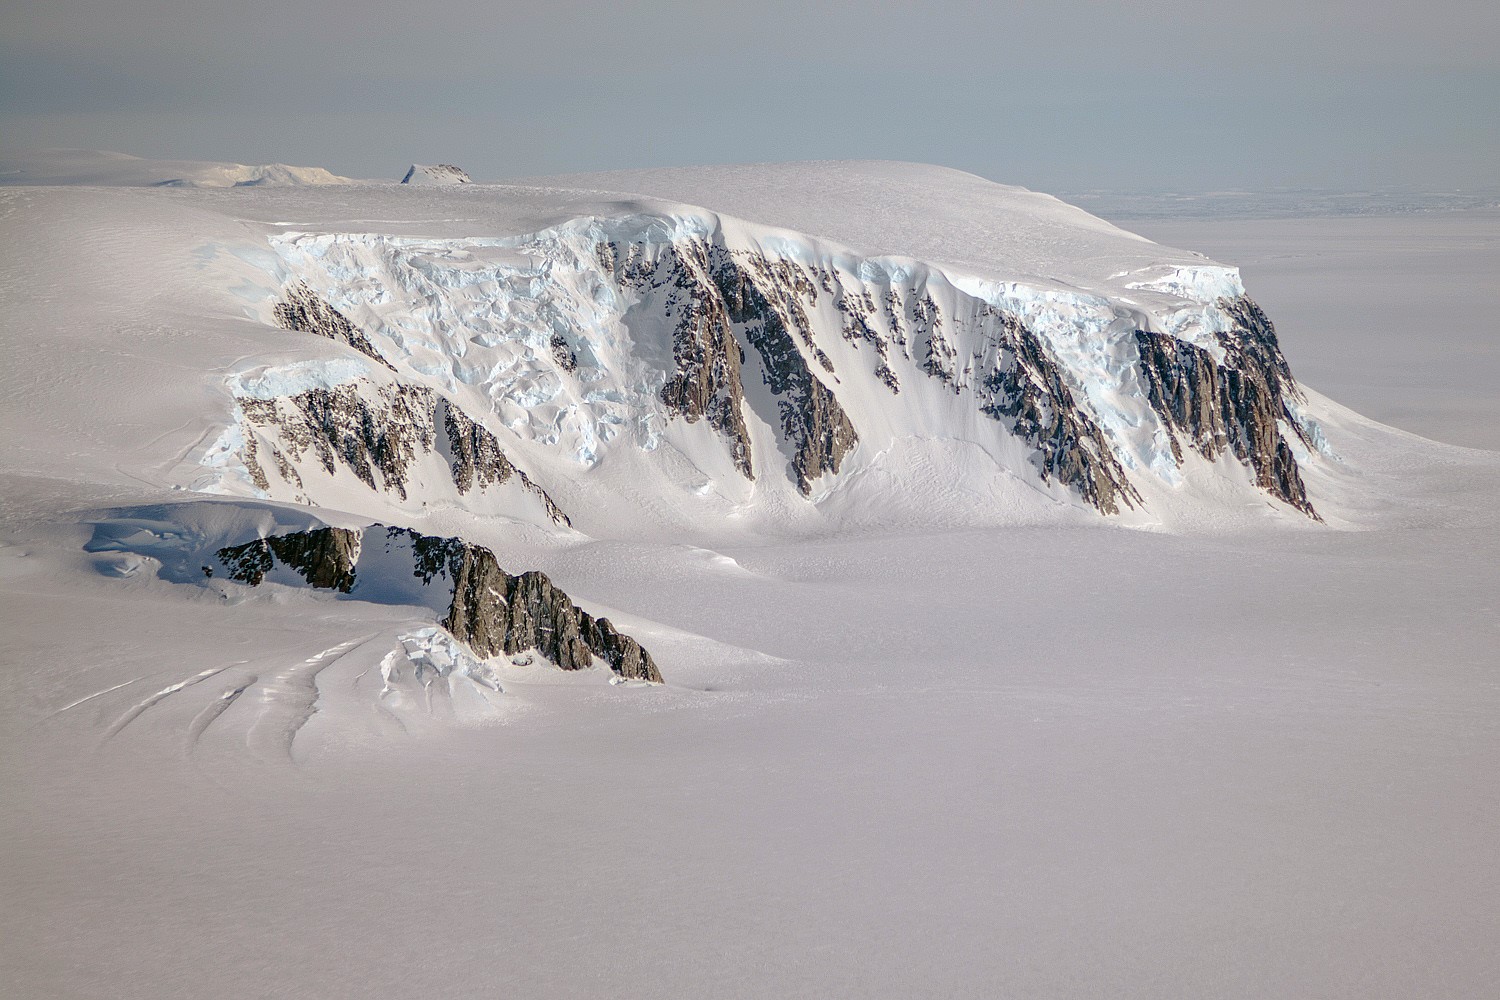
A view of mountains and glaciers in Antarctica’s Marie Byrd Land seen during the Nov. 2, 2014, IceBridge survey flight. Credit: NASA / Michael Studinger
One of the benefits of the Space Age is the way it has allowed human beings to see Earth in all of its complexity and splendor. In addition, it has allowed us to conduct studies of Earth’s surface and atmosphere from orbit, which helps us to see the impact we have on our the planet. It is with this purpose in mind that NASA’s Earth Observation Program has been monitoring the Arctic and Antarctic for many years.
For instance, Operation IceBridge has spent much of the past decade monitoring the Antarctic ice sheet for signs of cracks and flows. The purpose of this is to determine how and at what rate the ice sheet is changing due to Climate Change. Recently, NASA crews conducted a flight over the southern Antarctic Peninsula as part of Operation IceBridge ninth year, which resulted in some stunning pictures of the icy landscape.
The flight took place on November 4th, 2017, as part of IceBridge’s “Endurance West” mission to study sea ice. The path they chose follows the ground track of NASA’s Ice, Cloud, and land Elevation Satellite-2 (ICESat-2), an ice-mapping satellite that is scheduled for launch in late 2018. This path began at the northern tip of the Antarctic Peninsula and then moved southward across the Weddell Sea.
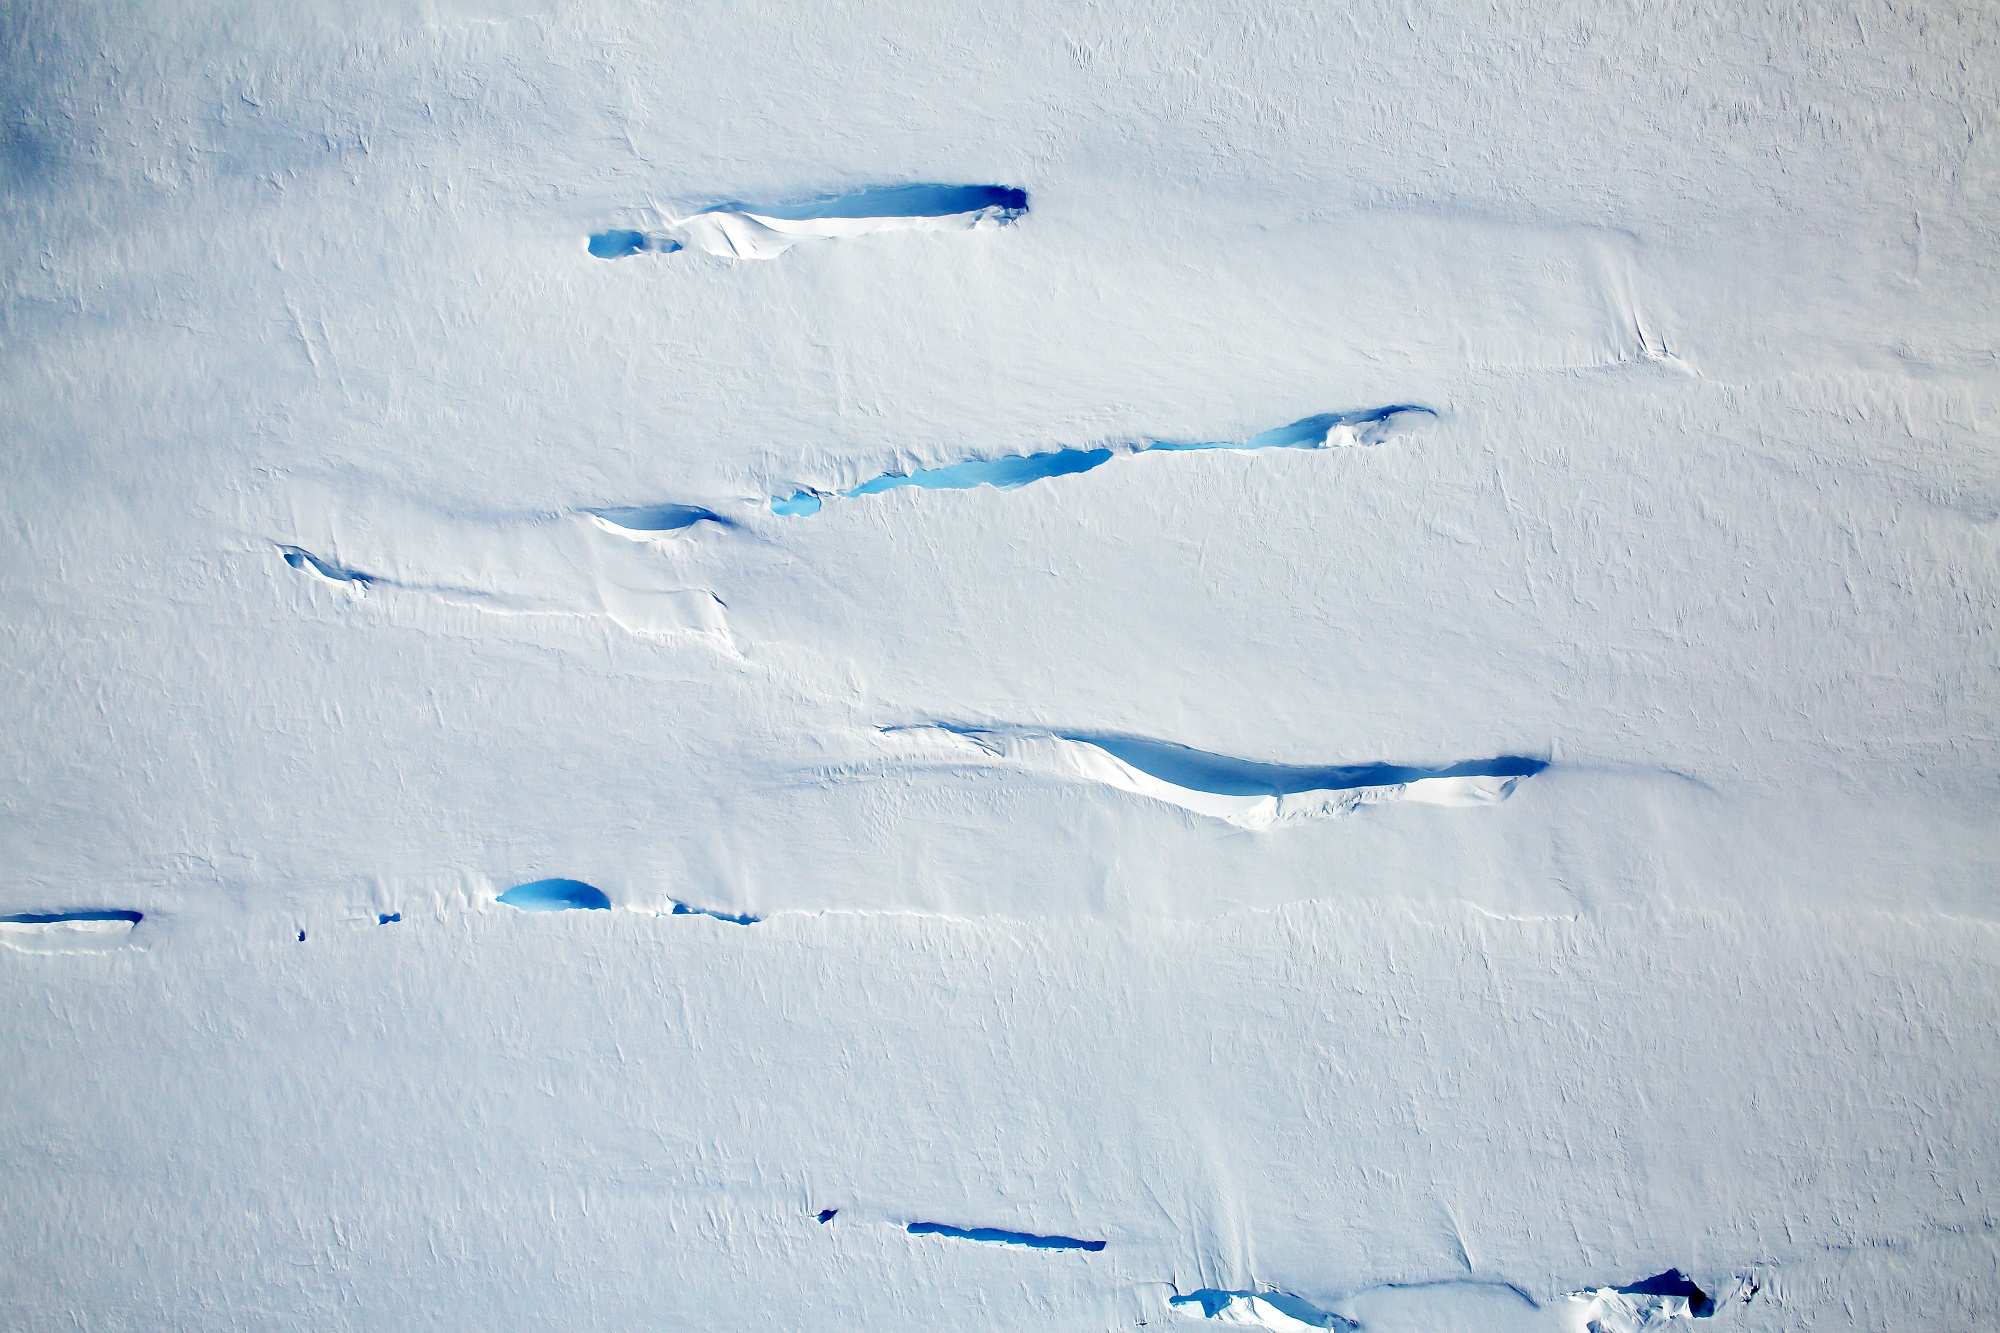
Semi-permanent cracks on the Antarctic Peninsula. Credit: NASA/Digital Mapping System.
The images the crew took aboard their P3 research plane were captured by a Digital Mapping System, a downward-pointing camera that collects thousands of high-resolution photographs during a single flight. While traveling over the southern Antarctic Peninsula, they imaged a landscape that resembled rapids, where the motion of rivers becomes amplified as the water flows through steeper, narrower terrain.
In a similar fashion, as ice flows through narrower canyons and down steeper bedrock, more fractures appear at the surface. But of course, the rate at which this takes place is much slower, which can make discerning movement in the ice sheet rather difficult. The first image (shown above) shows ice flowing into the southern part of the George VI ice shelf, which is located in Palmer Land south of the Seward Mountains.
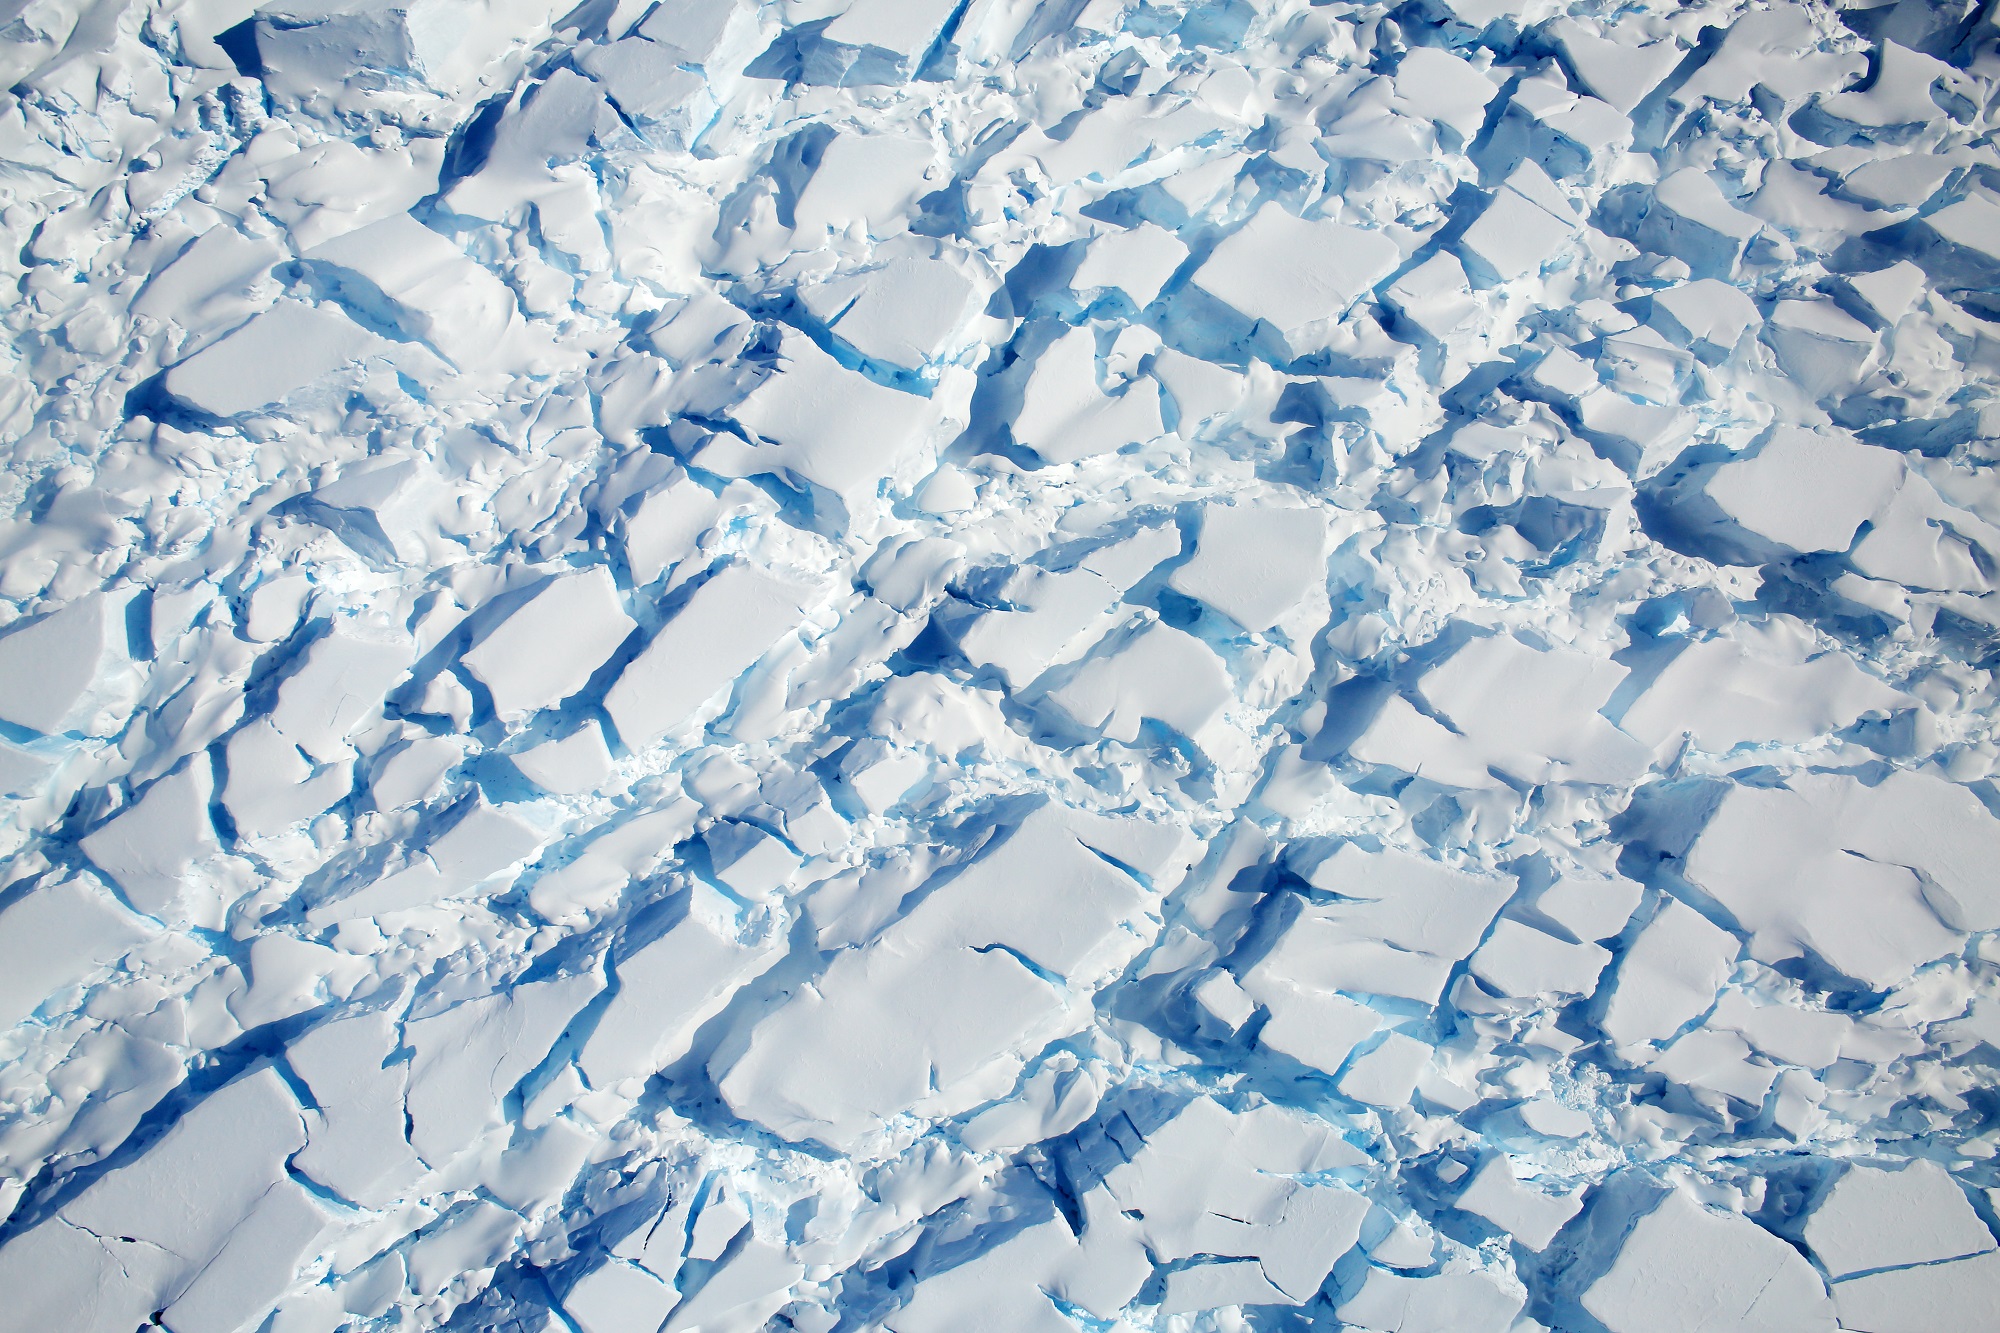
In this location, cracks are likely to be a regular feature that form as the ice flows over the bedrock. However, since the ice flow is relatively slow (even on the steeper part of the bedrock), the surface cracks are not as dramatic as in other regions. For example, the second image (shown below), which shows a heavily crevassed glacier that measures about 21 km (13 mi) long and 11 km (7 mi) wide.
The glacier appears to be flowing west from the Dyer Plateau to George VI Sound while the north side merges with the Meiklejohn Glacier. The third image (bottom) shows a heavily crevassed glacier north of Creswick Peaks that also flows west into George VI Sound. In short, the pictures confirm that ice on the southern end of the Antarctic Peninsula is flowing towards the ocean.
A heavily crevassed glacier flows west from the Dyer Plateau. Credit: NASA/Digital Mapping System
The purpose of IceBridge, which has been conducting regular measurements in the Antarctic Peninsula since 2009, has been to study just how fast and to what extent Climate Change has been impacting the region. While ice sheet loss is a well-documented phenomenon, scientists have known for some time that the most dramatic losses in Antarctica occur along its western side.
In addition, research has shown that the southern part of the peninsula is particularly vulnerable, as the glaciers and ice shelves there have become destabilized and are slowly feeding into the sea. And unlike sea ice, the land ice in this region has the potential to raise sea levels around the world. As Michael Studinger, the project manager for IceBridge, describes the operation:
“IceBridge exists because we need to understand how much ice the Greenland and Antarctic ice sheets will contribute to sea level rise over the next couple of decades. In order to do this, we need to measure how much the ice surface elevation is changing from year to year.”
Knowing how significant the impact of Climate Change will be is the first step in developing countermeasures. It also serves as a stark reminder that the problem exists, and that solutions need to be found before it is too late.
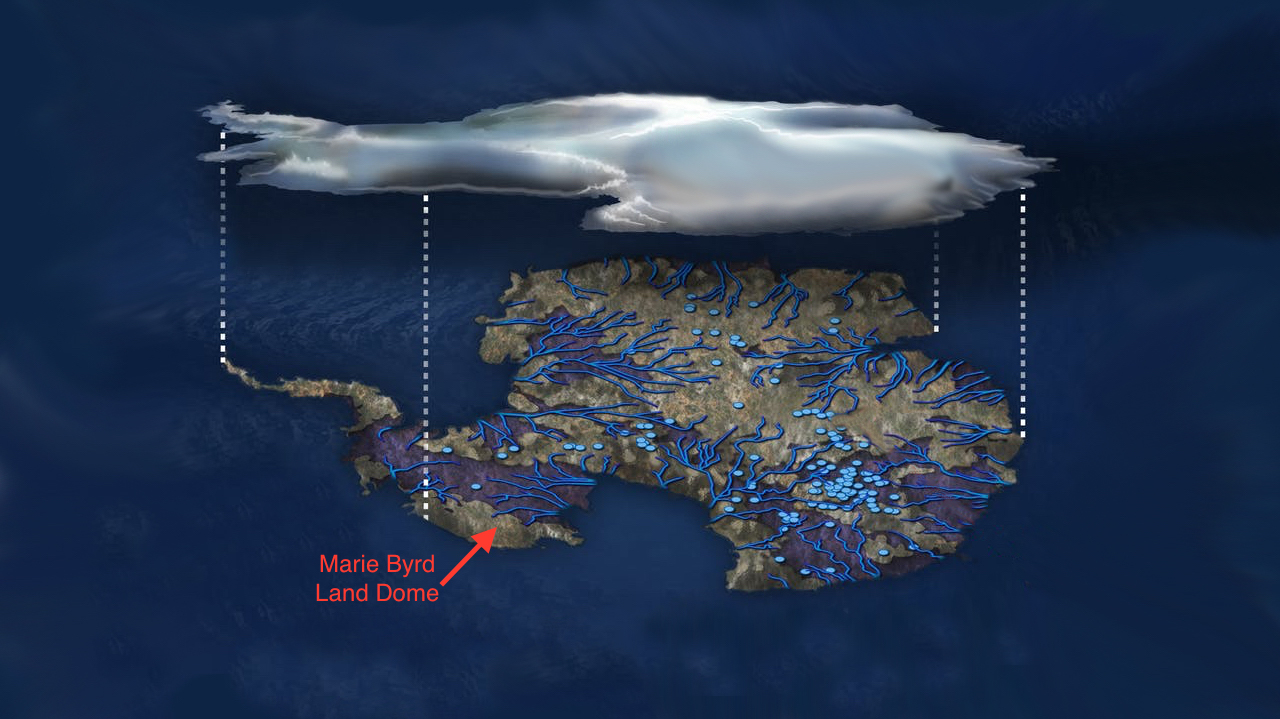
Illustration of flowing water under the Antarctic ice sheet. Blue dots indicate lakes, lines show rivers. Marie Byrd Land is part of the bulging "elbow" leading to the Antarctic Peninsula, left center. Credits: NSF/Zina Deretsky
Beneath the Antarctic ice sheet, there lies a continent that is covered by rivers and lakes, the largest of which is the size of Lake Erie. Over the course of a regular year, the ice sheet melts and refreezes, causing the lakes and rivers to periodically fill and drain rapidly from the melt water. This process makes it easier for Antarctica’s frozen surface to slide around, and to rise and fall in some places by as much as 6 meters (20 feet).
According to a new study led by researchers from NASA’s Jet Propulsion Laboratory, there may be a mantle plume beneath the area known as Marie Byrd Land. The presence of this geothermal heat source could explain some of the melting that takes place beneath the sheet and why it is unstable today. It could also help explain how the sheet collapsed rapidly in the past during previous periods of climate change.
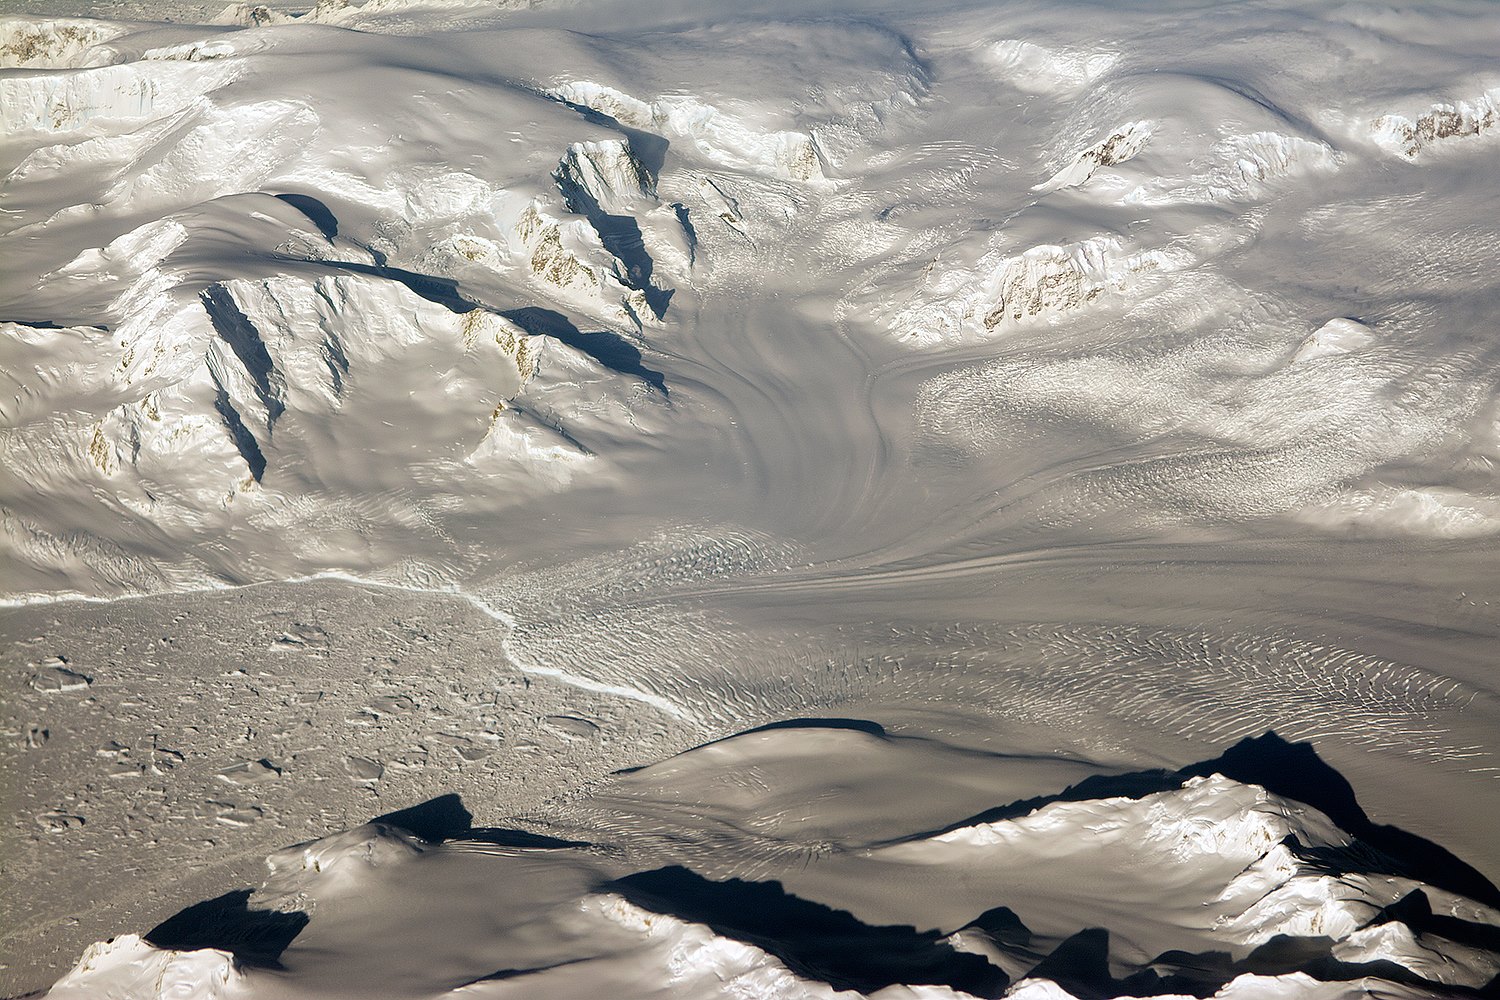
Glaciers seen during NASA’s Operation IceBridge research flight to West Antarctica on Oct. 29, 2014. Credit: NASA/Michael Studinger
The motion of Antarctica’s ice sheet over time has always been a source of interest to Earth scientists. By measuring the rate at which the ice sheet rises and falls, scientists are able to estimate where and how much water is melting at the base. It is because of these measurements that scientists first began to speculate about the presence of heat sources beneath Antarctica’s frozen surface.
The proposal that a mantle plume exists under Marie Byrd Land was first made 30 years ago by Wesley E. LeMasurier, a scientist from the University of Colorado Denver. According to the research he conducted, this constituted a possible explanation for regional volcanic activity and a topographic dome feature. But it was only more recently that seismic imaging surveys offered supporting evidence for this mantle plume.
However, direct measurements of the region beneath Marie Byrd Land is not currently possible. Hence why Seroussi and Erik Ivins of the JPL relied on the Ice Sheet System Model (ISSM) to confirm the existence of the plume. This model is essentially a numerical depiction of the physics of the ice sheet, which was developed by scientists at the JPL and the University of California, Irvine.
To ensure that the model was realistic, Seroussi and her team drew on observations of changes in altitude of the ice sheet made over the course of many years. These were conducted by NASA’s Ice, Clouds, and Land Elevation Satellite (ICESat) and their airborne Operation IceBridge campaign. These missions have been measuring the Antarctic ice sheet for years, which have led tot he creation of very accurate three-dimensional elevation maps.
A view of mountains and glaciers in Antarctica’s Marie Byrd Land seen during the Nov. 2nd, 2014, IceBridge survey flight. Credit: NASA / Michael Studinger
Seroussi also enhanced the ISSM to include natural sources of heating and heat transport that result in freezing, melting, liquid water, friction, and other processes. This combined data placed powerful constrains on the allowable melt rates in Antarctica, and allowed the team to run dozens of simulations and test a wide range of possible locations for the mantle plume.
What they found was that the heat flux caused by the mantle plume would not exceed more than 150 milliwatts per square meter. By comparison, regions where there is no volcanic activity typically experience a feat flux of between 40 and 60 milliwatts, whereas geothermal hotspots – like the one under Yellowstone National Park – experience an average of about 200 milliwatts per square meter.
Where they conducted simulations that exceeded 150 millwatts per square meter, the melt rate was too high compared to the space-based data. Except in one location, which was an area inland of the Ross Sea, which is known to experience intense flows of water. This region required a heat flow of at least 150 to 180 milliwatts per square meter to align with its observed melt rates.
In this region, seismic imaging has also shown that heating might reach the ice sheet through a rift in the Earth’s mantle. This too is consistent with a mantle plume, which are thought to be narrow streams of hot magma rising through the Earth’s mantle and spreading out under the crust. This viscous magma then balloons under the crust and causes it to bulge upward.
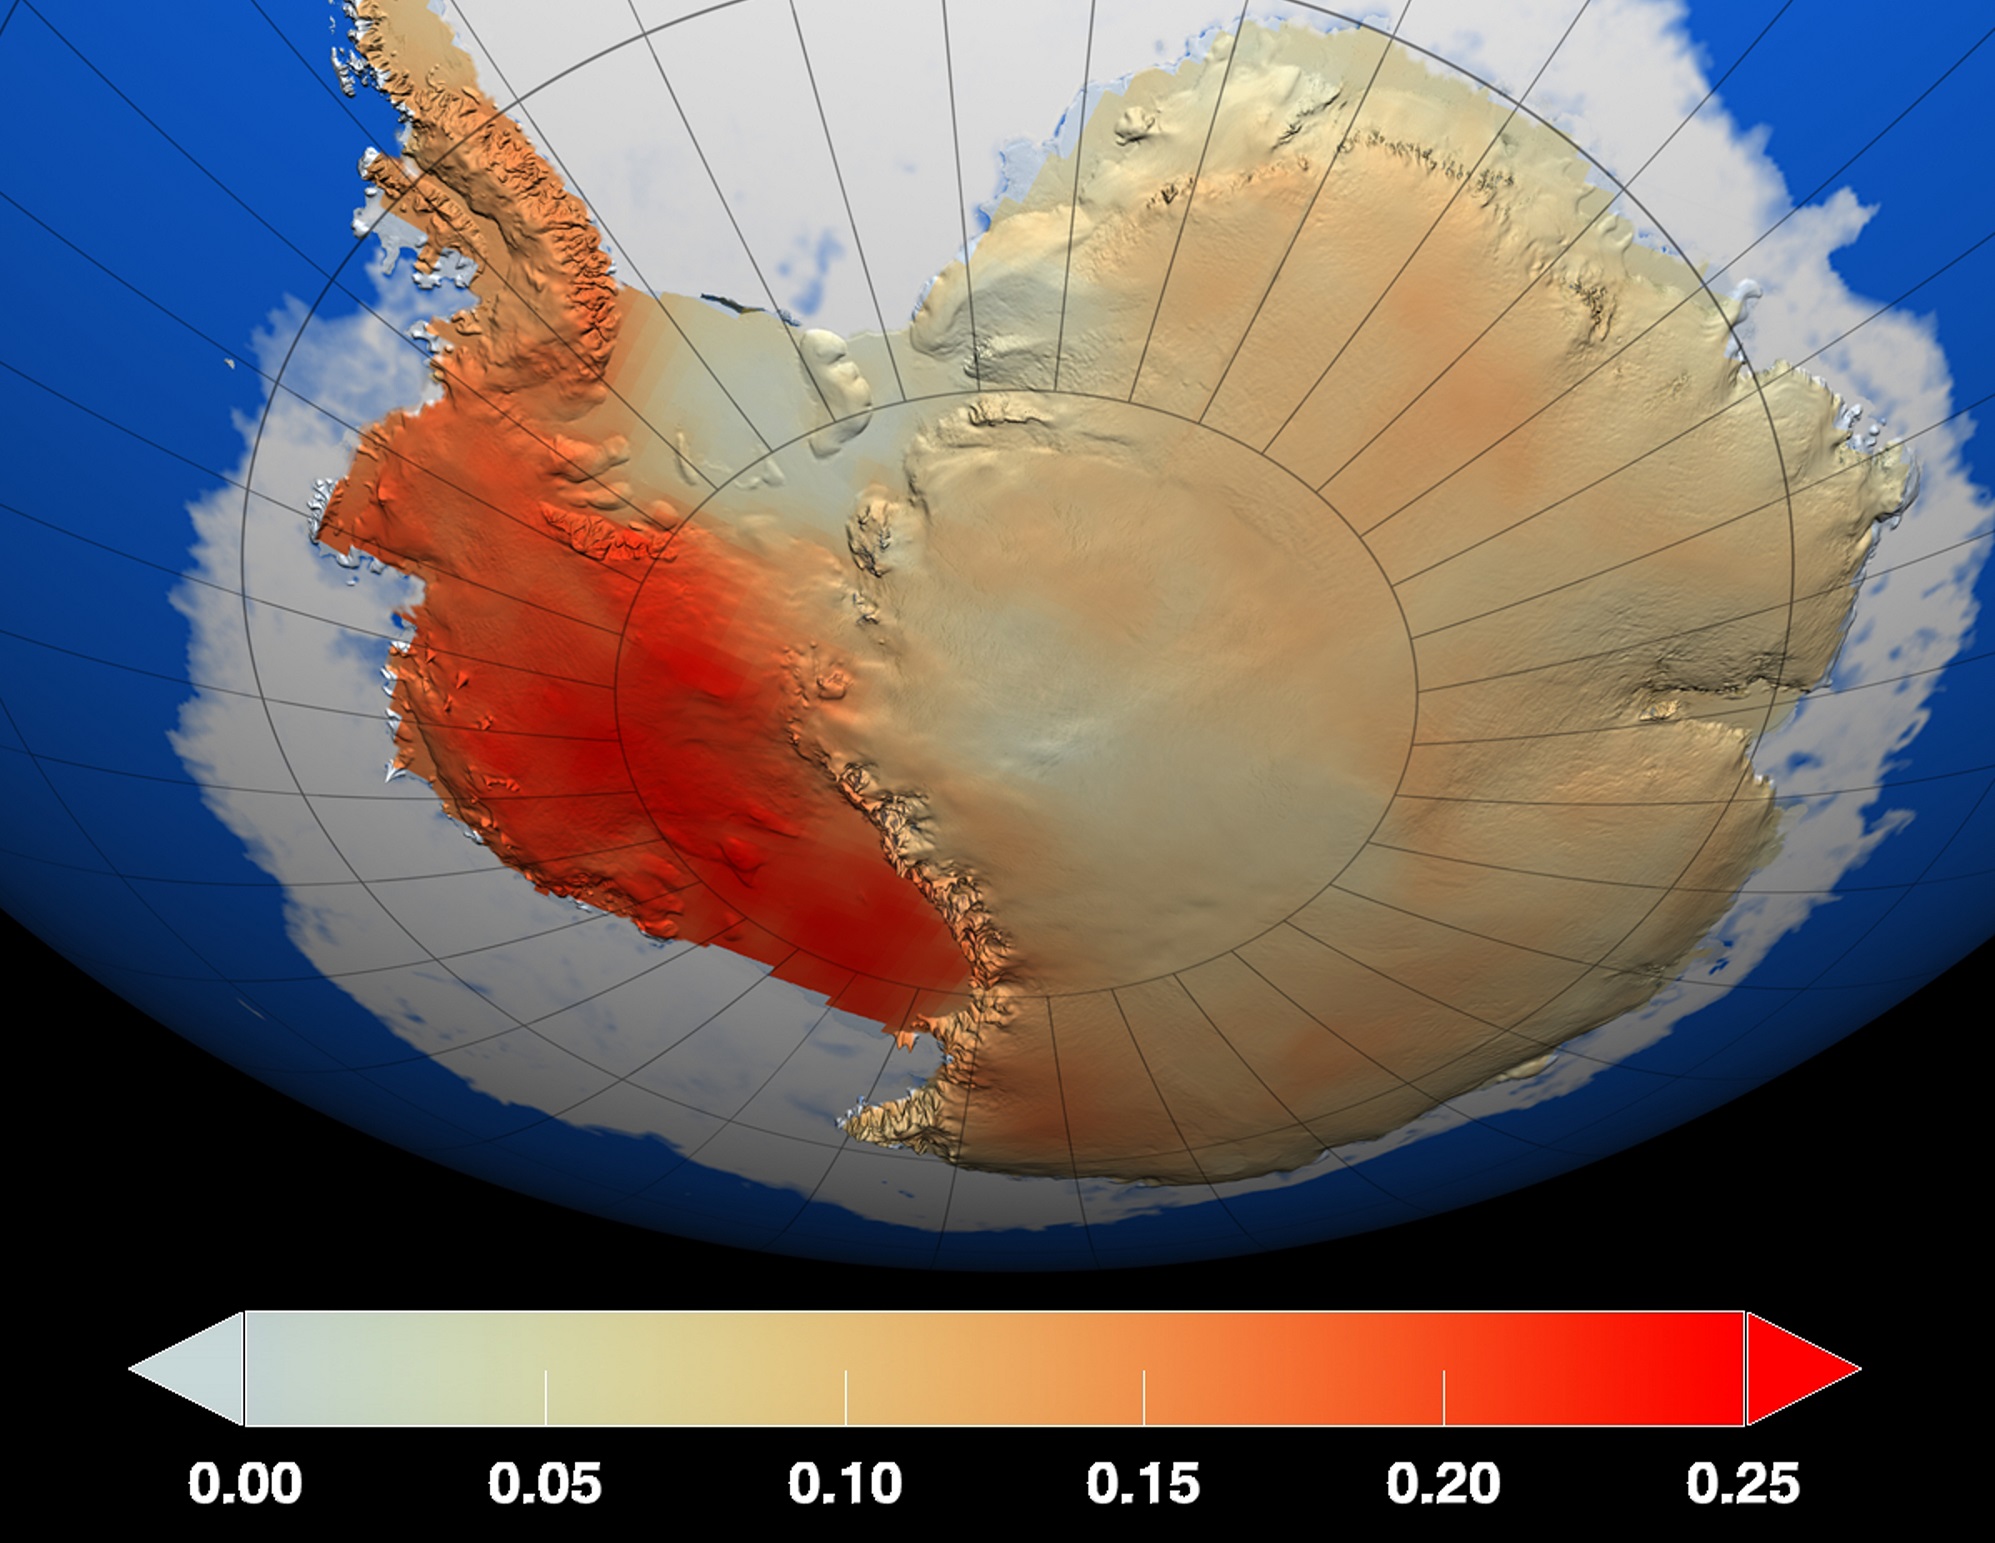
Temperature changes in the Antarctic ice sheet over the last 50 years, measured in degrees Celsius. Credit: NASA/GSFC Scientific Visualization Studio
Where ice lies over top of the plume, this process transfers heat into the ice sheet, triggering significant melting and runoff. In the end, Seroussi and her colleagues provide compelling evidence – based on a combination of surface and seismic data – for a surface plume beneath the ice sheet of West Antarctica. They also estimate that this mantle plume formed roughly 50 to 110 million years ago, long before the West Antarctic ice sheet came into existence.
Roughly 11,000 years ago, when the last ice age ended, the ice sheet experienced a period of rapid, sustained ice loss. As global weather patterns and rising sea levels began to change, warm water was pushed closer to the ice sheet. Seroussi and Irvins study suggests that the mantle plume could be facilitating this kind of rapid loss today, much as it did during the last onset of an inter-glacial period.
Understanding the sources of ice sheet loss under West Antarctica is important as far as estimating the rate at which ice may be lost there, which is essentially to predicting the effects of climate change. Given that Earth is once again going through global temperature changes – this time, due to human activity – it is essential to creating accurate climate models that will let us know how rapidly polar ice will melt and sea levels will rise.
It also informs our understanding of how our planet’s history and climate shifts are linked, and what effect these had on its geological evolution.
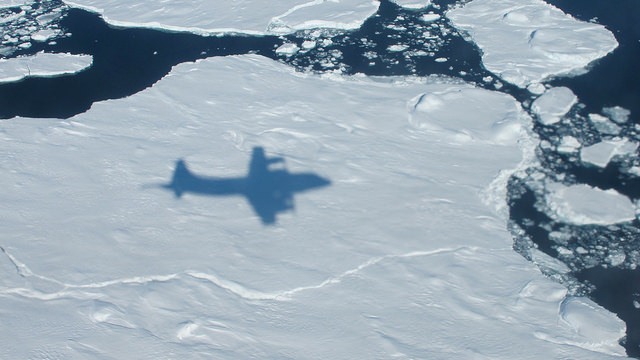
The NASA P-3B's shadow on sea ice off of southeast Greenland during an IceBridge survey on Apr. 9, 2013. Flying at a low altitude allows IceBridge researchers to gather detailed data. Credit: NASA / Jim Yungel
How much is the polar ice melting, and how are the sheets being affected by climate change? These are some of the questions that NASA’s Operation IceBridge seeks to answer. You can see a quick overview of the mission in the video above.
“IceBridge, a six-year NASA mission, is the largest airborne survey of Earth’s polar ice ever flown,” NASA stated in the YouTube description accompanying the video.
“It will yield an unprecedented three-dimensional view of Arctic and Antarctic ice sheets, ice shelves and sea ice. These flights will provide a yearly, multi-instrument look at the behavior of the rapidly changing features of the Greenland and Antarctic ice,” the agency added.
The aerial survey is intended to supplement information from NASA’s Ice Cloud and Land Elevation Satellite (ICESat), which has been orbiting Earth since 2003, and the forthcoming ICESat-2 that is expected to launch in early 2016.
The NASA P-3B's shadow on sea ice off of southeast Greenland during an IceBridge survey on Apr. 9, 2013. Flying at a low altitude allows IceBridge researchers to gather detailed data. Credit: NASA / Jim Yungel
There’s a “Chuck Norris fact” that says Chuck once went skydiving but promised never to do it again, saying one Grand Canyon is enough. But Chuck must have taken another jump millions of years ago.
Data gathered by NASA’s Operation IceBridge, an aerial science observation mission, has uncovered a previously unknown massive canyon in Greenland, hidden under a kilometer of ice.
The canyon, found by airborne radar data, has the same characteristics of a winding river channel like the Grand Canyon in Arizona. It is at least 750 kilometers (460 miles) long, making it longer than the Grand Canyon. In some places, it is as deep as 800 meters (2,600 feet), on scale with parts of the Grand Canyon. This immense feature is thought to predate the ice sheet that has covered Greenland for the last few million years.
“One might assume that the landscape of the Earth has been fully explored and mapped,” said Jonathan Bamber, professor of physical geography at the University of Bristol in the United Kingdom, and lead author of the study. “Our research shows there’s still a lot left to discover.”
While additional airborne radar data was used, the majority of the data was collected by IceBridge flights over Greenland during flights from 2009 to 2013. IceBridge’s Multichannel Coherent Radar Depth Sounder can see through vast layers of ice to measure its thickness and the shape of bedrock below.
In their analysis of the radar data, Bamber and his team discovered a continuous bedrock canyon that extends from almost the center of the island and ends beneath the Petermann Glacier fjord in northern Greenland.
At certain frequencies, radio waves can travel through the ice and bounce off the bedrock underneath. The amount of time the radio waves took to bounce back helped researchers determine the depth of the canyon. The longer it took, the deeper the bedrock feature.
The researchers believe the canyon plays an important role in transporting sub-glacial meltwater from the interior of Greenland to the edge of the ice sheet into the ocean. Evidence suggests that before the presence of the ice sheet, as much as 4 million years ago, water flowed in the canyon from the interior to the coast and was a major river system.
“It is quite remarkable that a channel the size of the Grand Canyon is discovered in the 21st century below the Greenland ice sheet,” said Studinger. “It shows how little we still know about the bedrock below large continental ice sheets.”
The IceBridge campaign will return to Greenland in March 2014 to continue collecting data on land and sea ice in the Arctic using a suite of instruments that includes ice-penetrating radar.
Bamber and his team had their findings published in the journal Science.
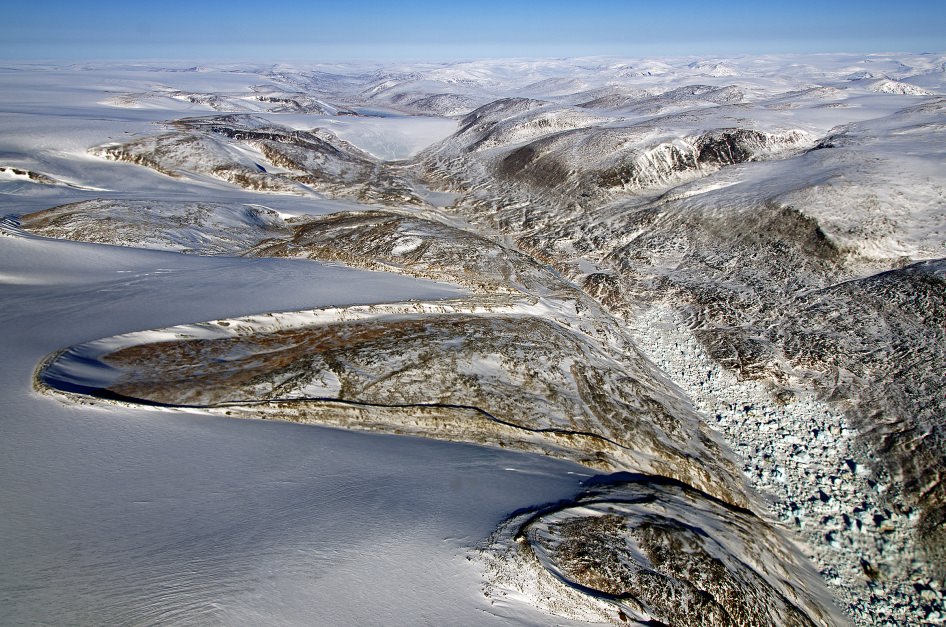
Horseshoe-shaped lateral moraines at the margin of the Penny Ice Cap on Baffin Island, Nunavut, Canada. Lateral moraines are accumulations of debris along the sides of a glacier formed by material falling from the valley wall. Credit: NASA / Michael Studinger
Enjoy this tour of the Arctic and Greenland, courtesy of the pilots of IceBridge, a six-year NASA mission to survey the ice at both of Earth’s poles. These views come from NASA’s P-3B aircraft, and the video is a selection of some of the best footage from the forward and nadir cameras mounted to the aircraft taken during IceBridge’s spring deployment over Greenland and the Arctic Ocean.
This airborne mission is collecting radar, laser altimetry, and other data on the changing ice sheets, glaciers, and sea ice of the Arctic and Antarctic. It is the largest airborne survey of Earth’s polar ice ever flown, and it will provide an unprecedented three-dimensional view of Arctic and Antarctic ice sheets, ice shelves and sea ice. These flights will provide a yearly, multi-instrument look at the behavior of the rapidly changing features of the Greenland and Antarctic ice.
Data collected during IceBridge will help scientists bridge the gap in polar observations between NASA’s Ice, Cloud and Land Elevation Satellite (ICESat) — in orbit since 2003 — and ICESat-2, planned for late 2015. ICESat stopped collecting science data in 2009, making IceBridge critical for ensuring a continuous series of observations.
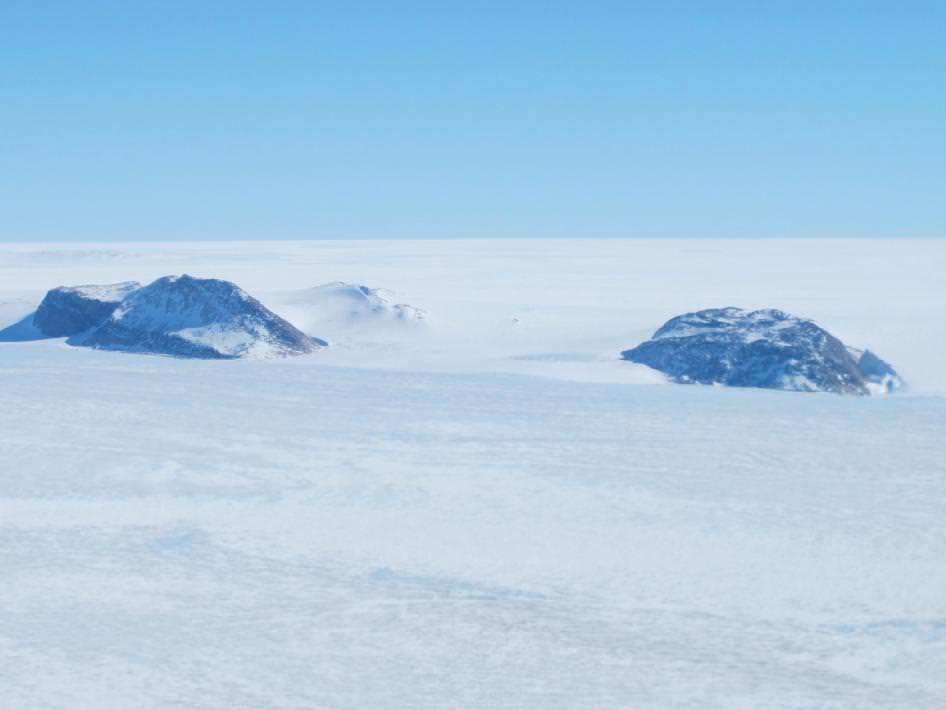
Nunataks in the western portion of the Greenland ice sheet seen from the NASA P-3B during an IceBridge survey of southwestern Greenland on Apr. 8, 2013. Nunataks are areas of exposed rock in an ice sheet such as ridges or mountain peaks. These jagged rock formations are sometimes used as landmarks on an ice sheet. Credit: NASA / Jim Yungel.
Here’s a view you don’t often see: Greenland’s glaciers from 500 meters above the ice. But this new video from NASA’s Operation IceBridge — recorded on April 9, 2013 — shows areas of southeast Greenland using a cockpit camera, revealing what the pilots see as they fly NASA’s P-3B airborne laboratory low over the Arctic. Following a glacier’s sometimes winding flow line gives IceBridge researchers a perspective on the ice not possible from satellites which pass in straight lines overhead. By gathering such data, IceBridge is helping to build a continuous record of change in the polar regions.
The plane allows researchers to images Earth’s polar ice in unprecedented detail to better understand processes that connect the polar regions with the global climate system. IceBridge utilizes a highly specialized fleet of research aircraft and the most sophisticated suite of innovative science instruments ever assembled to characterize annual changes in thickness of sea ice, glaciers, and ice sheets. In addition, IceBridge collects critical data used to predict the response of earth’s polar ice to climate change and resulting sea-level rise. IceBridge also helps bridge the gap in polar observations between NASA’s ICESat satellite missions.
NASA P-3B waits outside the hangar at Thule Air Base with the Greenland Ice sheet in the background. The aircraft is set to begin the 2013 season of NASA’s Operation IceBridge mission to survey Earth's polar ice sheets in unprecedented three-dimensional detail. The plane just arrived from NASA Wallops Flight Facility in Virginia - see my P-3B photos below. Credit: NASA/Goddard/Michael Studinger
NASA’s Operation IceBridge has begun the 2013 research season of Ice Science flights in Greenland and the Arctic to survey the regions ice sheets and land and sea ice using a specially equipped P-3B research aircraft from NASA’s Wallops Flight Facility in Wallops Island, Va.
Operation IceBridge began in 2009 as part of NASA’s six-year long effort to conduct the largest airborne survey of Earth’s polar ice ever flown.
The goal is to obtain an unprecedented three-dimensional, multi-instrument view of the behavior of Greenland, Arctic and Antarctic ice sheets, ice shelves and sea ice which have been undergoing rapid and dramatic changes and reductions.
“We’re starting to see how the whole ice sheet is changing,” said Michael Studinger, IceBridge project scientist at NASA’s Goddard Space Flight Center in Greenbelt, Md. “Thinning at the margins is now propagating to the interior.”
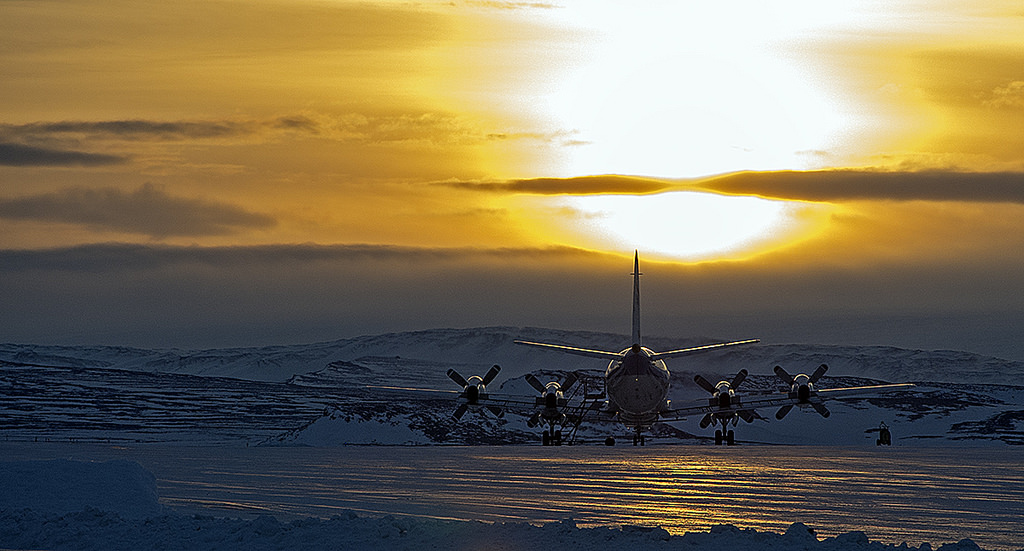
The P-3 exiting the hanger pre-flight in Thule. Credit: NASA
The airborne campaign was started in order to maintain a continuous record of measurements in changes in polar ice after NASA’s Earth orbiting ICESat (Ice, Cloud and Land Elevation Satellite) probe stopped collecting data in 2009.
ICESat-2 won’t be launched until 2016, so NASA’s IceBridge project and yearly P-3 airborne campaigns will fill in the science data gap in the interval.
The P-3B Orion just arrived from NASA’s Wallops Flight Facility in Virginia where I visited it before departure – see my P-3B photos herein.
NASA IceBridge P-3B research aircraft prepares for departure from runway at NASA Wallops Flight Facility in Virginia to Thule Air Base in Greenland. Credit: Ken Kremer (kenkremer.com)
IceBridge is operating out of airfields in Thule and Kangerlussuaq, Greenland, and Fairbanks, Alaska.
The P-3B survey flights over Greenland and the Arctic will continue until May. They are conducted over Antarctica during October and November.
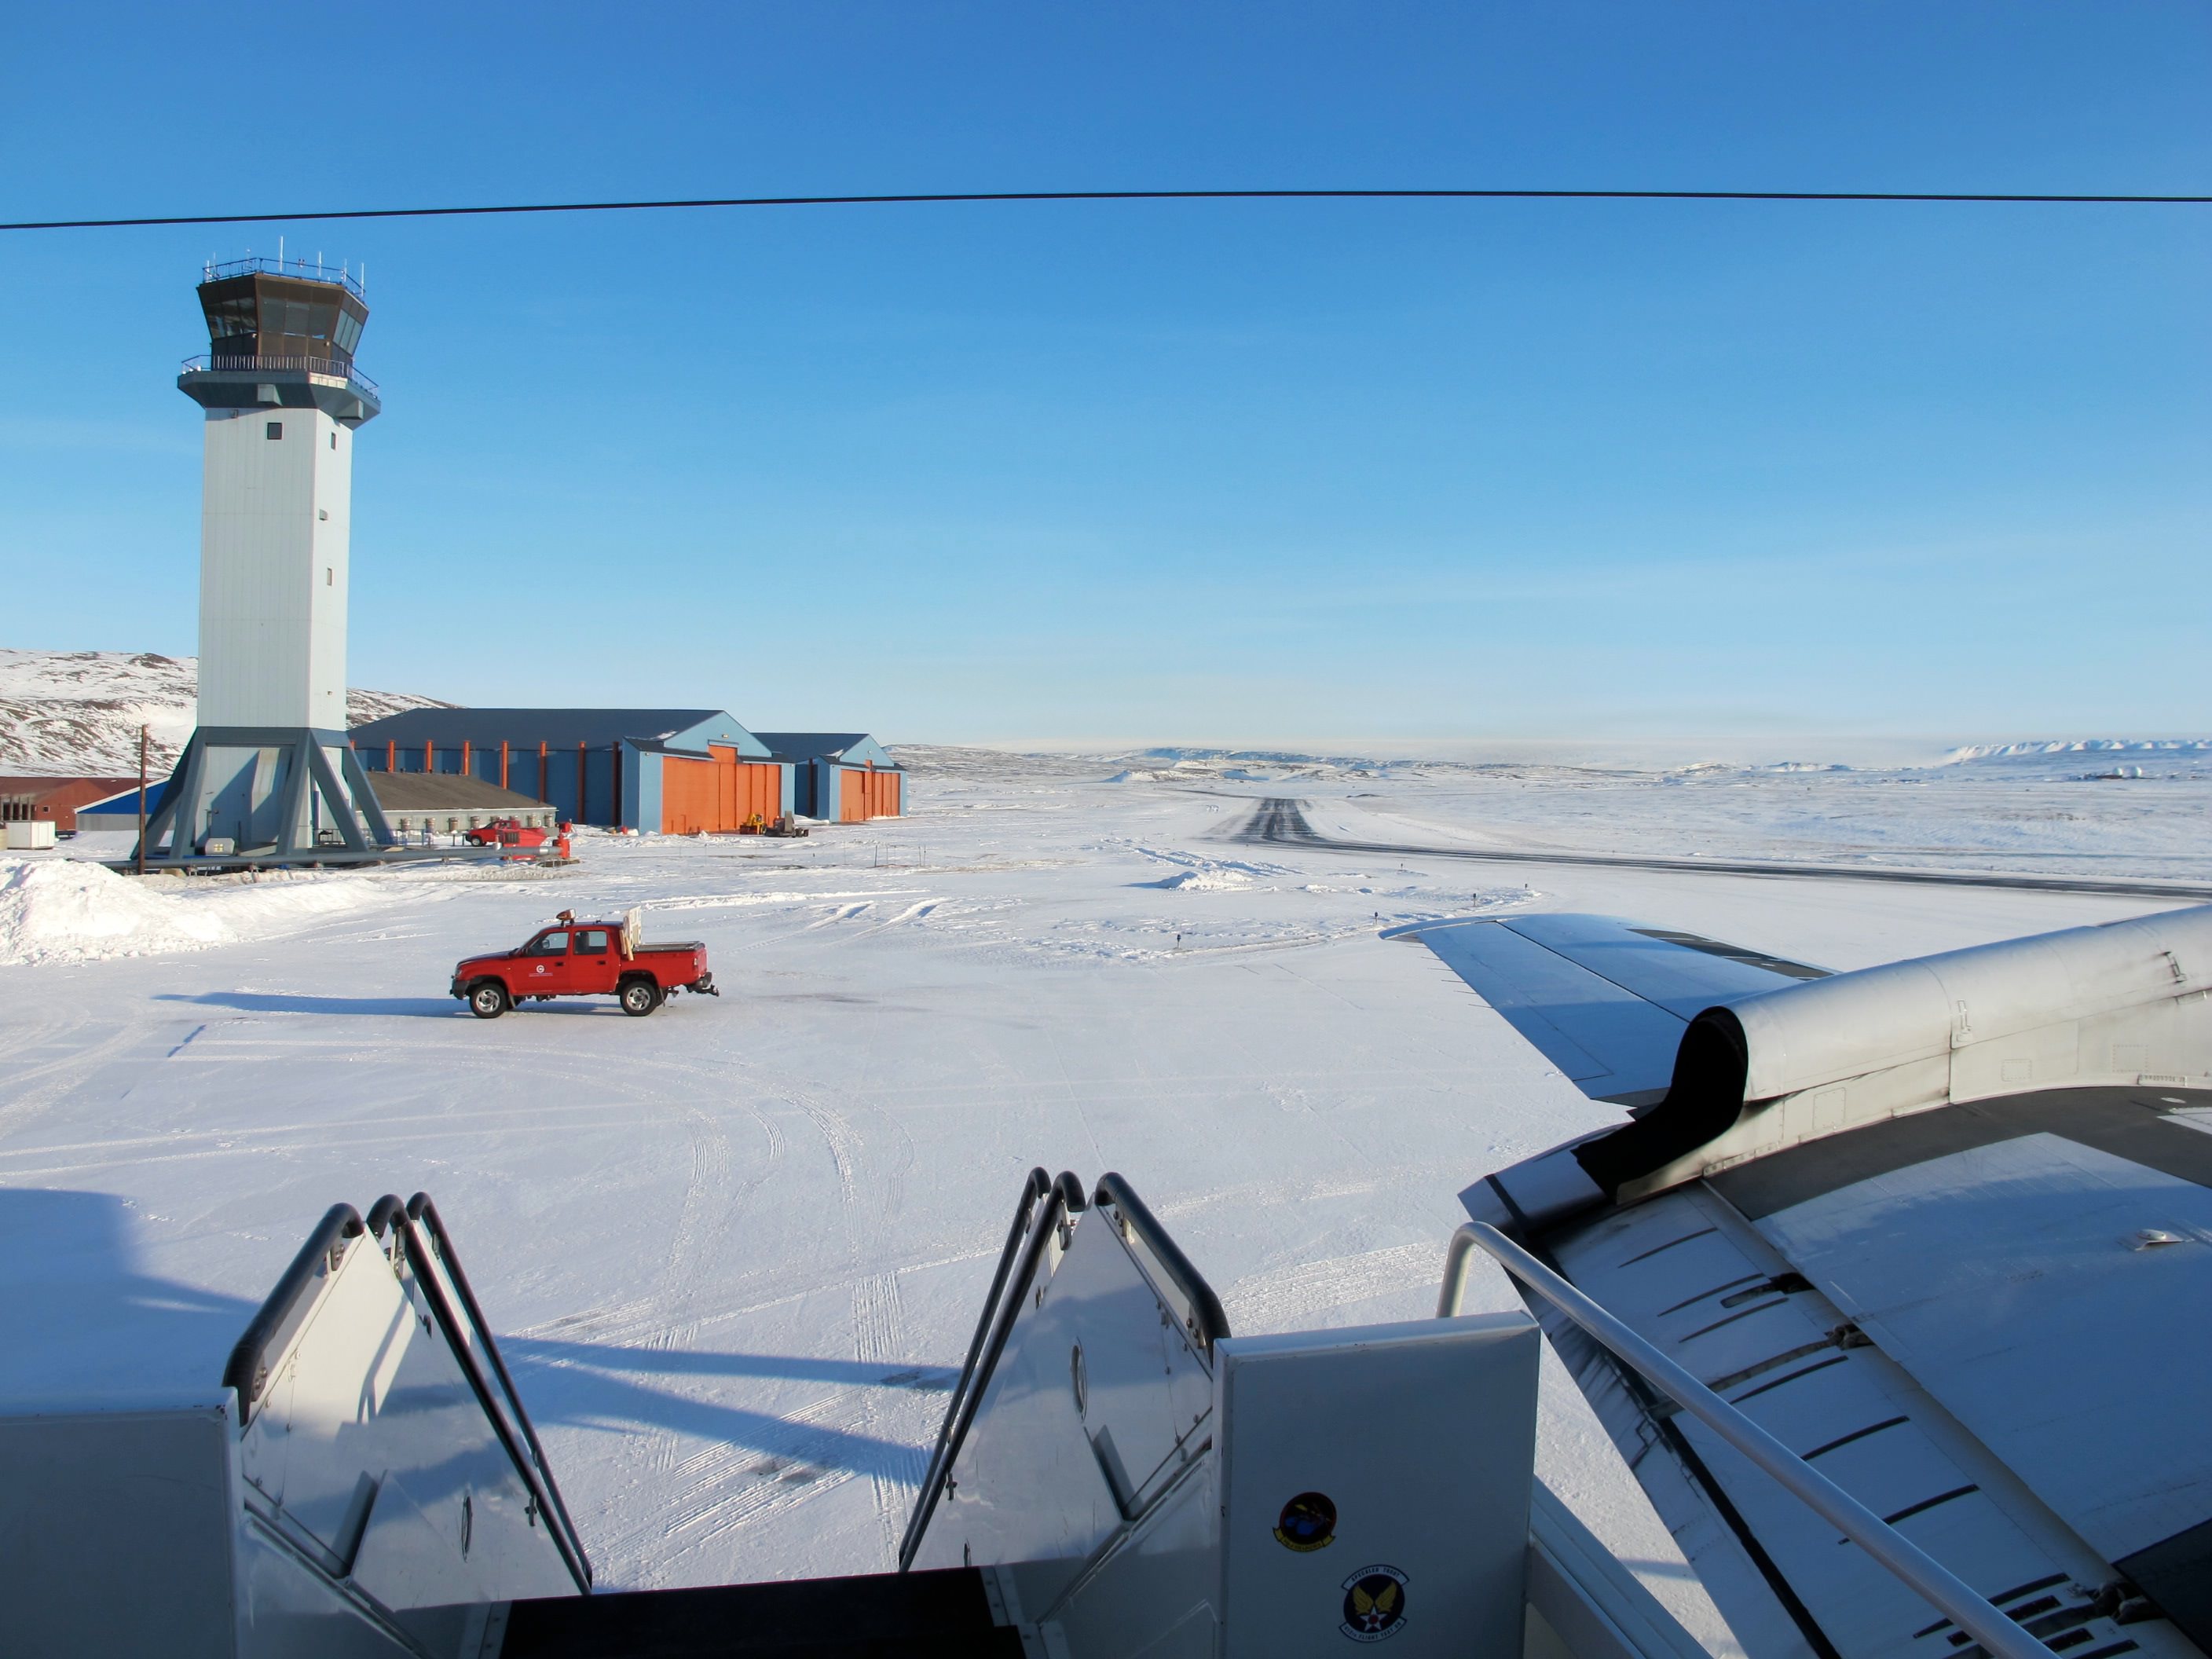
A sunny view of the ramp at Thule Air Base, Greenland, shortly after the NASA P-3B research aircraft arrived on Mar. 18, 2013. Credit: NASA / Jim Yungel
The measurements collected by IceBridge instruments will characterize the annual changes in thickness of sea ice, glaciers, and ice sheets. The data are used to help predict how climate change affects Earth’s polar ice and the resulting rise in sea-levels.
Researchers with the U.S. Army Corps of Engineers are collaborating with the IceBridge project to collect snow depth measurements near Barrow , Alaska. High school science teachers from the US, Denmark and Greenland will fly along on the P-3B survey flights to learn about polar science.
NASA Wallops has a wide ranging research and development mission and is home to the Virginia launch pad for the new Antares/Cygnus commercial ISS resupply rocket set for its maiden launch in mid April 2013; detailed in see my new story – here.
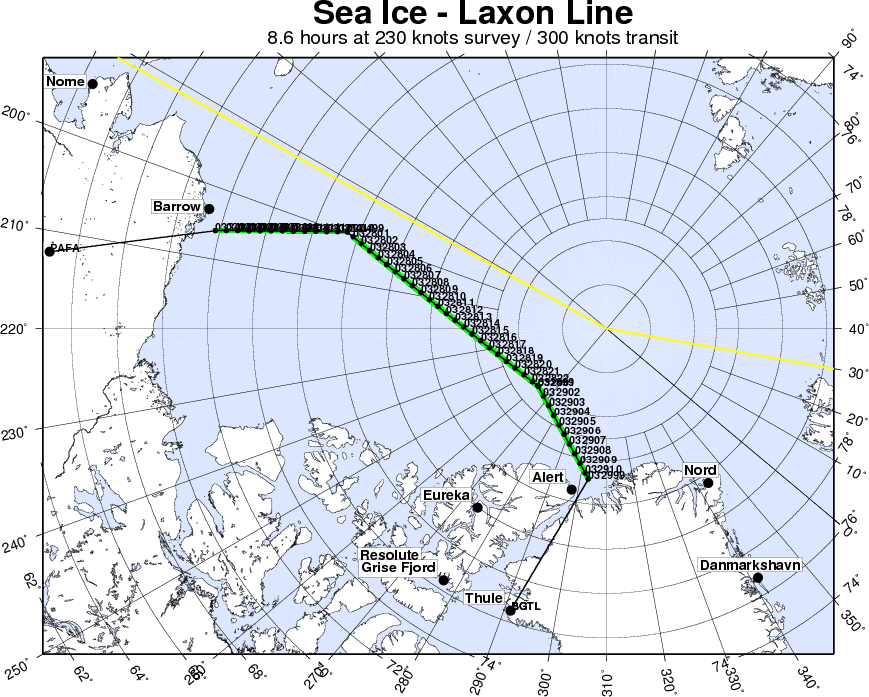
Sea ice in the southern Beaufort Sea. Credit: NASA
IceBridge departing to Fairbanks to start their sea ice flights that will cover the Beauford and Chukchi seas – via the Laxon sea ice route for the transit. Credit: NASA