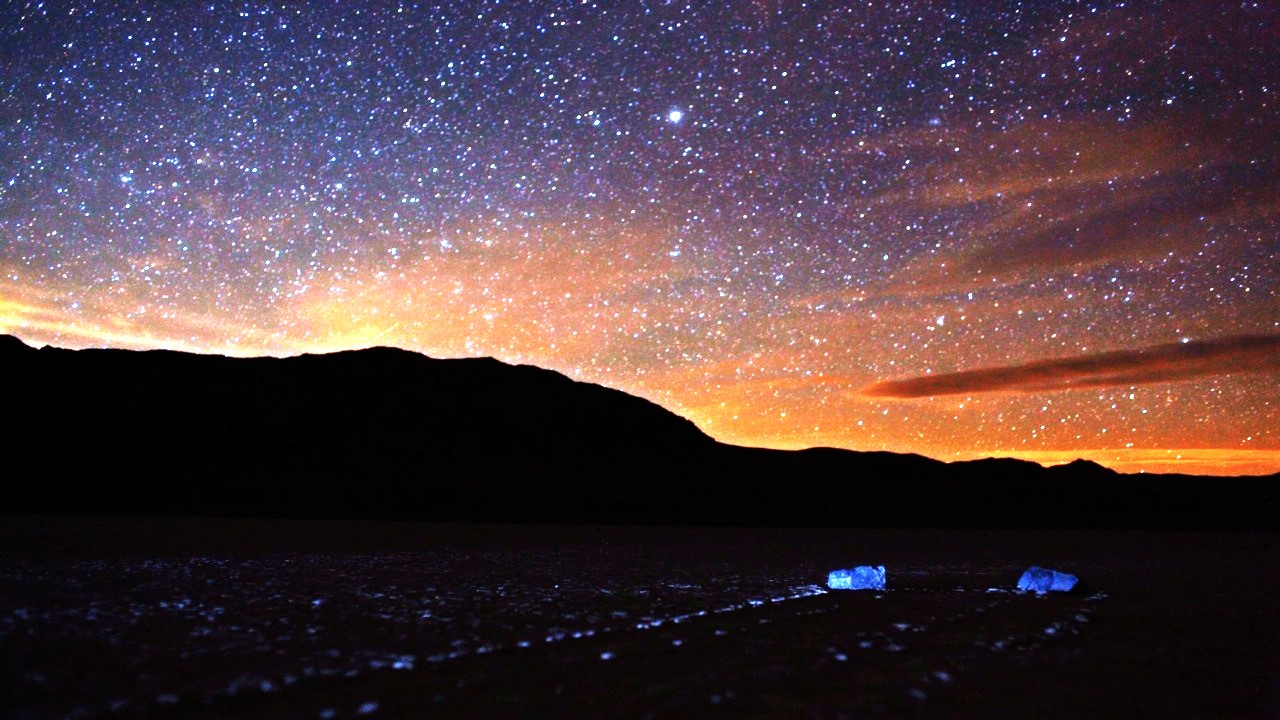
The night sky and the infamous sliding stones of Racetrack Playa Lakebed in Death Valley. Credit and copyright: Gavin Heffernan/Sunchaser Pictures.
Have you ever dreamed of camping out under the dark skies of Death Valley? Dream no more: you can enjoy this virtual experience thanks to Gavin Heffernan and his Sunchaser Pictures crew. This magnificent new timelapse video includes some insane star trails, the beautiful Milky Way, and an incredible pink desert aurora!
“As you can see, Death Valley is a crazy place to shoot at,” Gavin said via email to Universe Today, “as the horizon is so strangely uneven/malleable. I don’t know if the valley was cut by water or underground magma, but it’s almost impossible to find a straight horizon.” See some great images from their video, below:
Gavin said he and his team tried out some new timelapse techniques, like moonpainting the foreground landscapes (0:53 — 1:20), and also some experiments merging regular timelapse footage with star trails — “a technique we’ve been calling Starscaping (1:07:1:33)” he said. “If it has an actual name, let us know! 🙂 Star Trails shot at 25 sec exposures. No special effects used, just the natural rotation of the earth’s axis. Photography Merging: STARSTAX. Used two Canon EOS 5Dmkii, with a 24mm/1.4 lens & 28mm/1.8.”
A pink aurora seen in Death Valley. Credit and copyright: Gavin Heffernan/Sunchaser Pictures.
The plane of our Milky Way galaxy (image credit: R. Bertero/deviantart, cropped by DM). Understanding the nature of the obscuring dust, indicated partly by the dark regions bisecting the plane, is key to establishing a precise distance to the Galactic center.
Obtaining an accurate distance between the Sun and the center of our Galaxy remains one of the principal challenges facing astronomers. The ongoing lively debate concerning this distance hinges partly on the nature of dust found along that sight-line. Specifically, are dust particles lying toward the Galactic center different from their counterparts near the Sun? A new study led by David Nataf asserts that, yes, dust located towards the Galactic center is anomalous. They also look at accurately defining both the distance to the Galactic center and the reputed bar structure that encompasses it.
The team argues that characterizing the nature of small dust particles is key to establishing the correct distance to the Galactic center, and such an analysis may mitigate the scatter among published estimates for that distance (shown in the figure below). Nataf et al. 2013 conclude that dust along the sight-line to the Galactic center is anomalous, thus causing a non-standard ‘extinction law‘.
The extinction law describes how dust causes objects to appear fainter as a function of the emitted wavelength of light, and hence relays important information pertaining to the dust properties.
The team notes that, “We estimate a distance to the Galactic center of [26745 light-years] … [adopting a] non-standard [extinction law] thus relieves a major bottleneck in Galactic bulge studies.”
Various estimates for the distance to the Galactic center tabulated by Malkin 2013. The x-axis describes the year, while the y-axis features the distance to the Galactic center in kiloparsecs (image credit: Fig 1 from Malkin 2013/arXiv/ARep).
Nataf et al. 2013 likewise notes that, “The variations in both the extinction and the extinction law made it difficult to reliably trace the spatial structure of the [Galactic] bulge.” Thus variations in the extinction law (tied directly to the dust properties) also affect efforts to delineate the Galactic bar, in addition to certain determinations of the distance to the Galactic center. Variations in the extinction law imply inhomogeneities among the dust particles.
“The viewing angle between the bulge’s major axis and the Sun-Galactic centerline of sight remains undetermined, with best values ranging from from 13 to … 44 [degrees],” said Nataf et al. 2013 (see also Table 1 in Vanhollebekke et al. 2009). The team added that, “We measure an upper bound on the tilt of 40 [degrees] between the bulge’s major axis and the Sun-Galactic center line of sight.”
However, the properties of dust found towards the Galactic center are debated, and a spectrum of opinions exist. While Nataf et al. 2013 find that the extinction law is anomalously low, there are studies arguing for a standard extinction law. Incidentally, Nataf et al. 2013 highlight that the extinction law characterizing dust near the Galactic center is similar to that tied to extragalactic supernovae (SNe), “The … [extinction] law toward the inner Galaxy [is] approximately consistent with extra-galactic investigations of the hosts of type Ia SNe.”
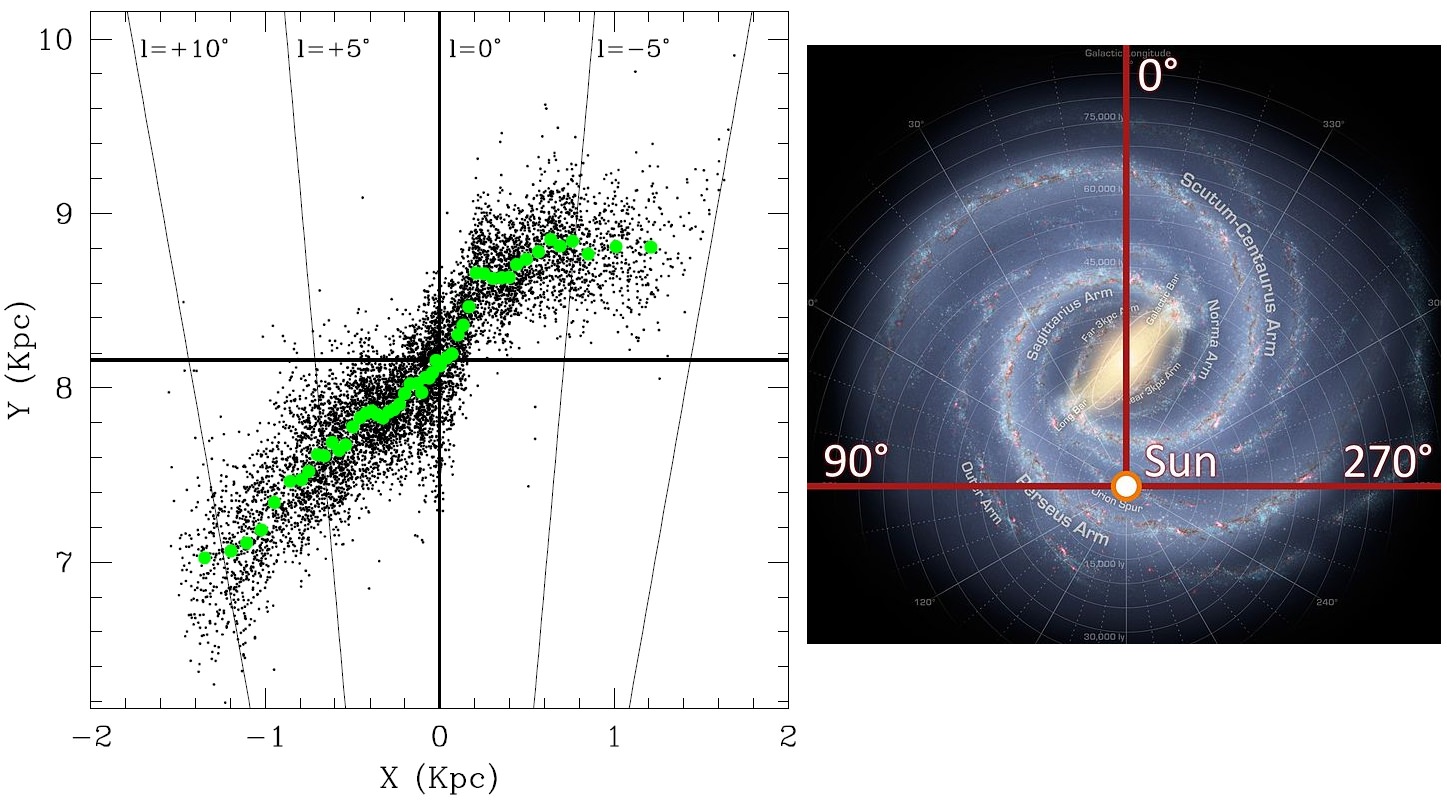
Left, the delineation of the bar at the center of the Milky Way by Nataf et al. 2013. The centerline represents the direction towards Sagittarius (image credit: Fig 17 from Nataf et al. 2013/arXiv/ApJ). Right, a macro view of the Galaxy highlighting the general orientation and location of the Galactic bar (image credit: NASA/Wikipedia). The Galactic bar is not readily discernible in the distribution of RR Lyrae variables.
Deviations from the standard extinction law, and the importance of characterizing that offset, is also exemplified by studies of the Carina spiral arm. Optical surveys reveal that a prominent spiral arm runs through Carina (although that topic is likewise debated), and recent studies argue that the extinction law for Carina is higher than the standard value (Carraro et al. 2013, Vargas Alvarez et al. 2013). Conversely, Nataf et al. 2013 advocate that dust towards the Galactic center is lower by comparison to the standard (average) extinction law value.
The impact of adopting an anomalously high extinction law for objects located in Carina is conveyed by the case of the famed star cluster Westerlund 2, which is reputed to host some of the Galaxy’s most massive stars. Adopting an anomalous extinction law for Westerlund 2 (Carraro et al. 2013, Vargas Alvarez et al. 2013) forces certain prior distance estimates to decrease by some 50% (however see Dame 2007). That merely emphasizes the sheer importance of characterizing local dust properties when establishing the cosmic distance scale.
In sum, characterizing the properties of small dust particles is important when ascertaining such fundamental quantities like the distance to the Galactic center, delineating the Galactic bar, and employing distance indicators like Type Ia SNe.
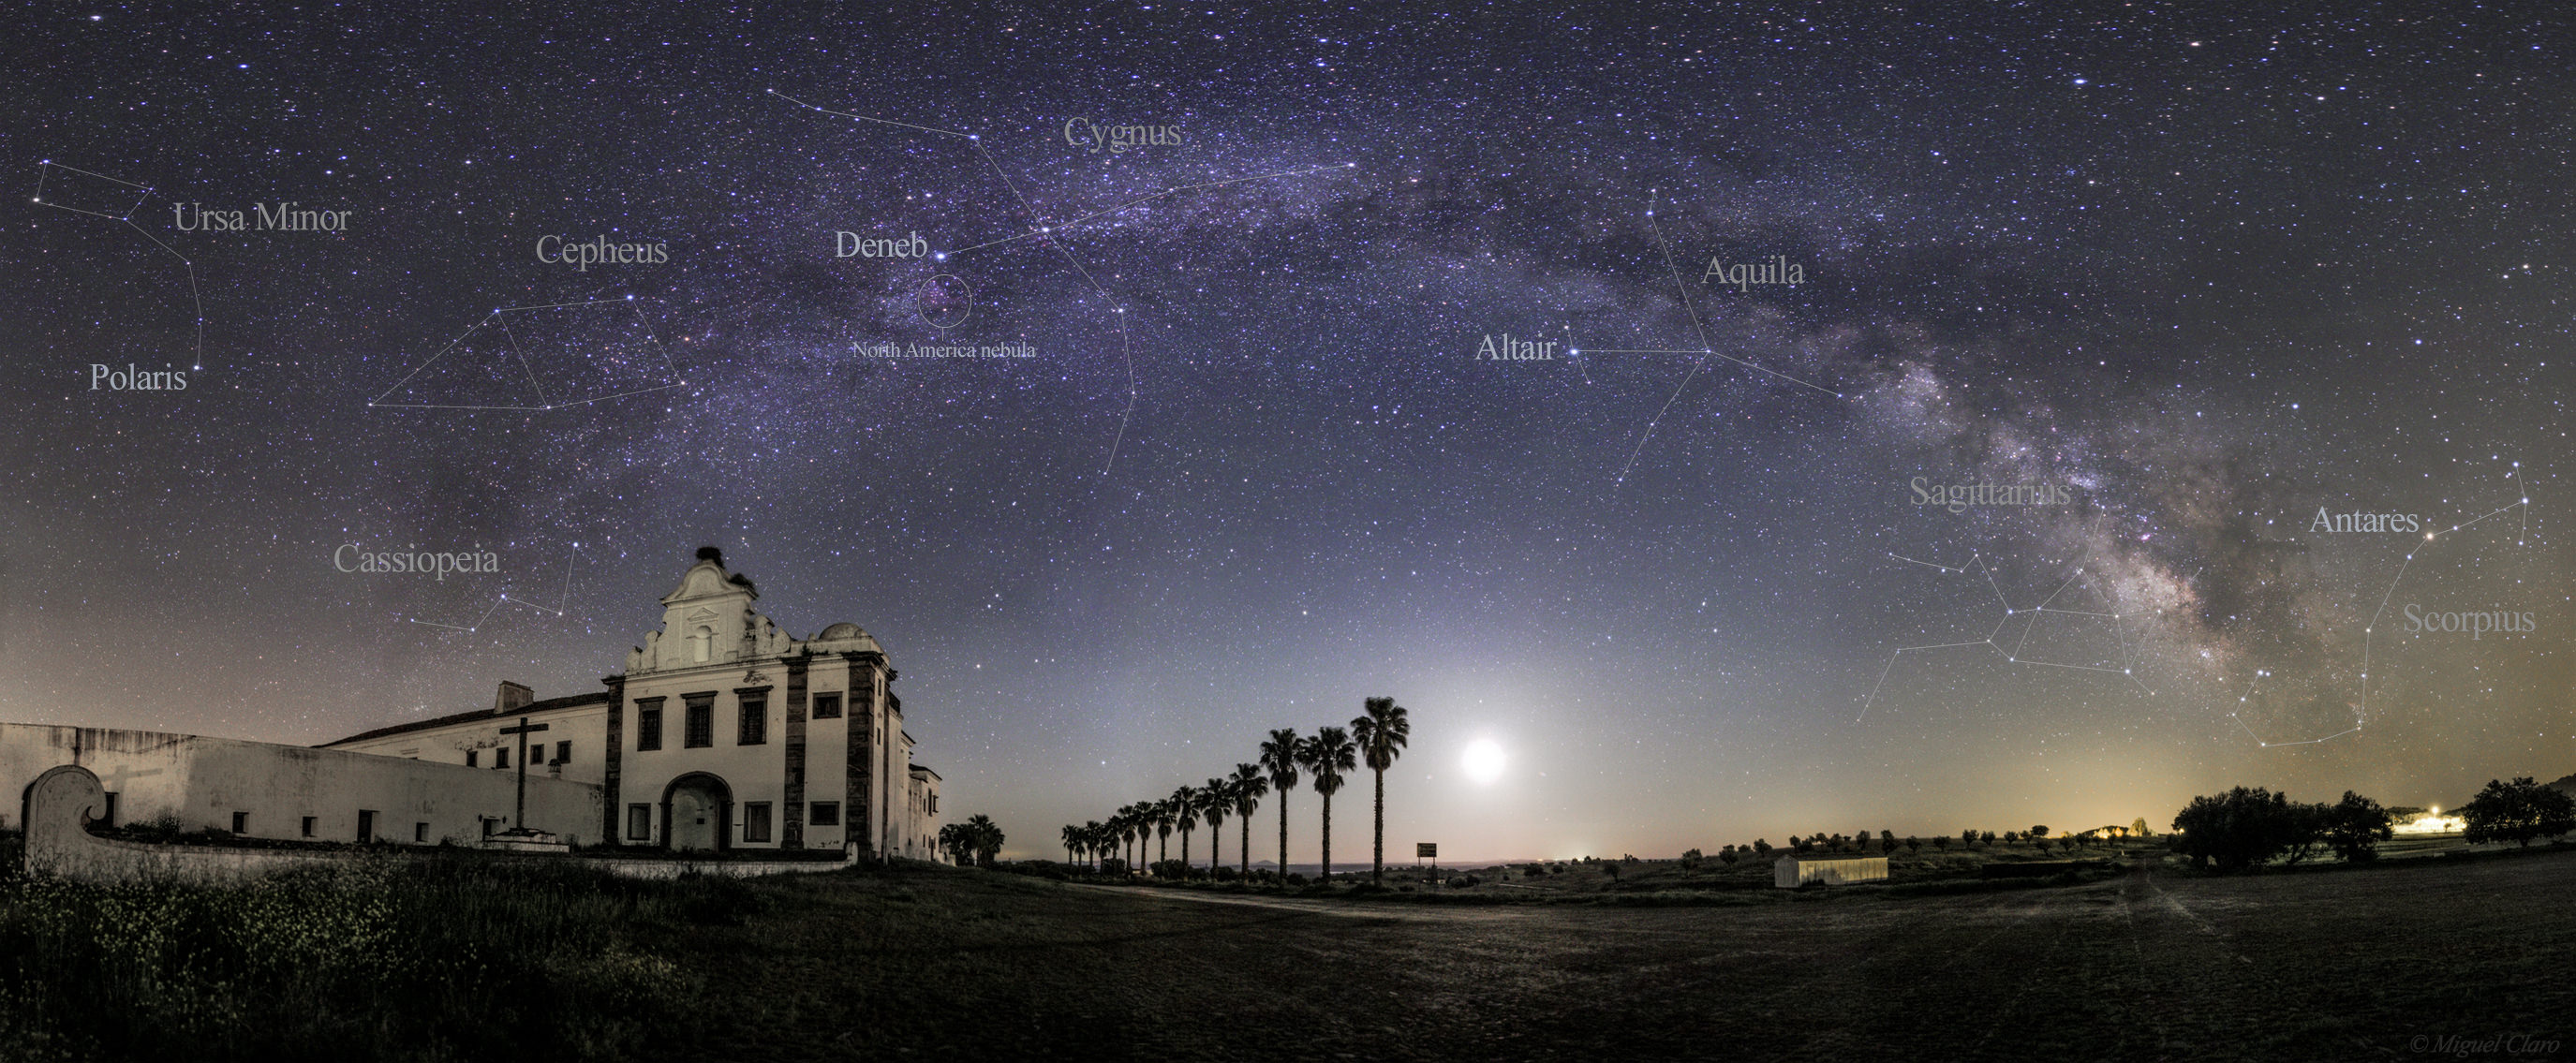
A 21-image mosaic showing the Milky Way and the setting Moon at dawn, at the Convent of Orada in Monsaraz, Portugal, in the Alqueva´s Dark Sky Reserve. Credit and copyright: Miguel Claro.
With the arrival of spring, the Milky Way begins its rise in the sky in the northern hemisphere. Now visible at dawn in the skies over Portugal at dawn, astrophotographer Miguel Claro captured this stunning 21-image mosaic showing the arch of the Milky Way framing the setting Moon from Monsaraz, Portugal in the Alqueva Dark Sky Reserve. In the foreground is the Convent of Orada (dated 1670).
“Near the center at the right of palm trees, the moon shines brightly, although not interfering with the giant arc of the Milky Way where it is possible to distinguish a lot of constellations like Ursa Minor, with the Polaris star to the left of the image,” Claro said via email, “until the swan (Cygnus), with its North America nebula (NGC7000) clearly visible, down to the right, we still find the constellation of Sagittarius and Scorpio, with the brilliant super giant star, Antares.”
Click the images to see larger versions (yes, you really want to ’embiggen!’)
See an annotated version below. Claro used a Canon 60Da – ISO1600 Lens 24mm f/2; Exp. 15 seconds, taken on 06/04/2013 at 5:32 AM local time.
An annotated version of a 21-image mosaic showing the Milky Way and the setting Moon at dawn, at the Convent of Orada in Monsaraz, Portugal, in the Alqueva´s Dark Sky Reserve. Credit and copyright: Miguel Claro.
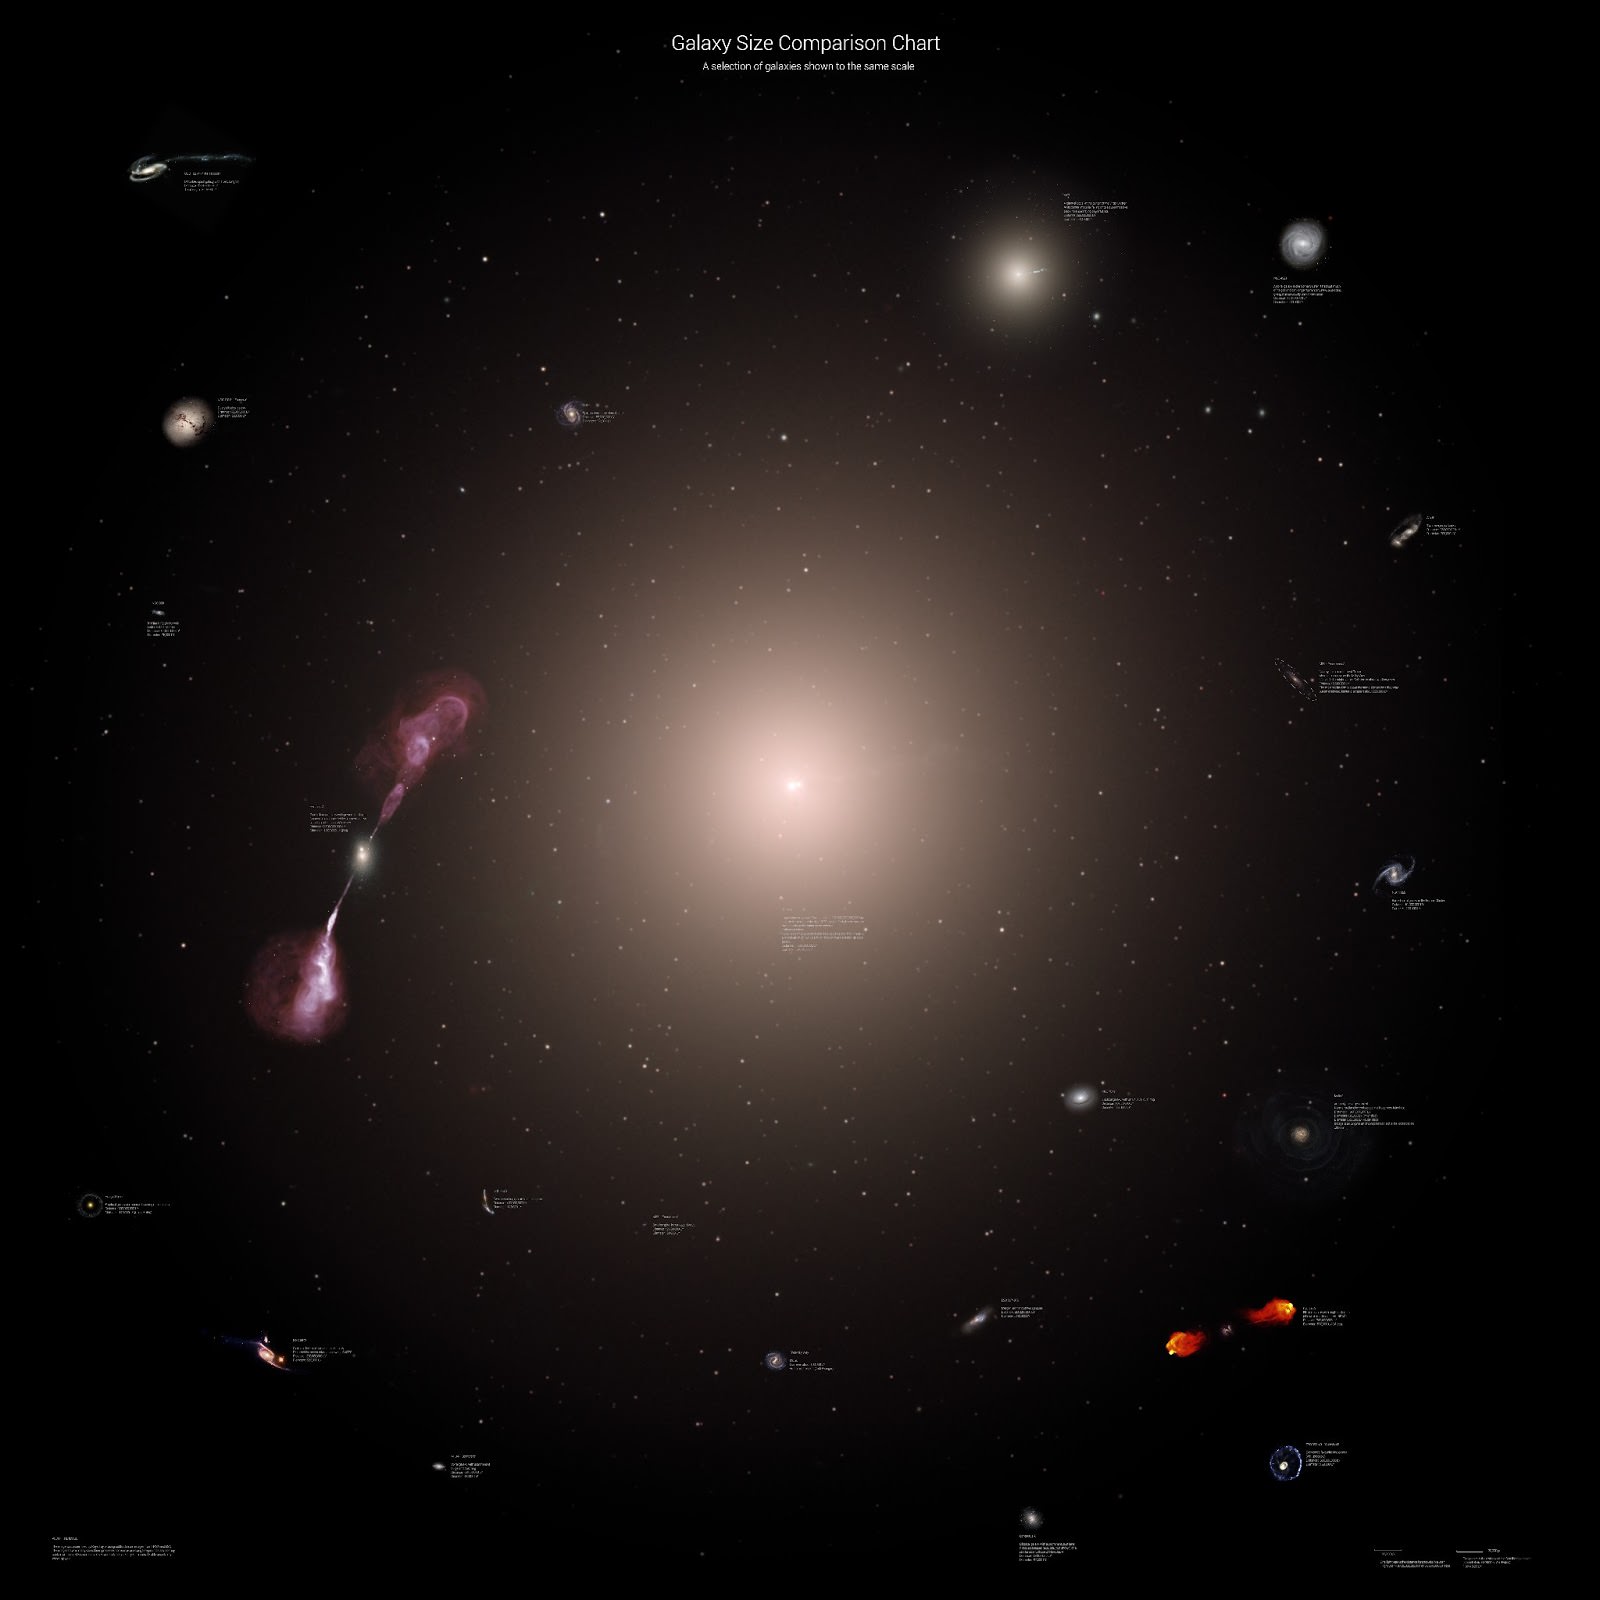
Galaxy size comparison chart by astrophysicist Rhys Taylor
I’m going to refrain from the initial response that comes to mind… actually, no I won’t — they’re really, really, really big!!!!
</Kermit arms>
Ok, now that that’s out of the way check out this graphic by Arecibo astrophysicist Rhys Taylor, which neatly illustrates the relative sizes of 25 selected galaxies using images made from NASA and ESA observation missions… including a rendering of our own surprisingly mundane Milky Way at the center for comparison. (Warning: this chart may adversely affect any feelings of bigness you may have once held dear.) According to Taylor on his personal blog, Physicists of the Caribbean (because he works had worked at the Arecibo Observatory in Puerto Rico) “Type in ‘asteroid sizes’ into Google and you’ll quickly find a bunch of images comparing various asteroids, putting them all next to each at the same scale. The same goes for planets and stars. Yet the results for galaxies are useless. Not only do you not get any size comparisons, but scroll down even just a page and you get images of smartphones, for crying out loud.” So to remedy that marked dearth of galactic comparisons, Taylor made his own. Which, if you share my personal aesthetics, you’ll agree is quite nicely done.
“I tried to get a nice selection of well-known, interesting objects,” Taylor explains. “I was also a little limited in that I needed high-resolution images which completely mapped the full extent of each object… still, I think the final selection has a decent mix, and I reckon it was a productive use of a Saturday.” And even with the dramatic comparisons above, Taylor wasn’t able to accurately portray to scale one of the biggest — if not the biggest — galaxies in the observable universe: IC 1101.
For an idea of how we measure up to that behemoth, he made this graphic:
Galaxy sizes including IC 1101, the largest-known galaxy. Click for a zoomable version. (Credit: Rhys Taylor)
That big bright blur in the center? That’s IC 1101, the largest known galaxy — in this instance created by scaling up an image of M87, another supersized elliptical galaxy that just happens to be considerably closer to our own (and thus has had clearer images taken of it.) But the size is right — IC 1101 is gargantuan.
At an estimated 5.5 million light-years wide, over 50 Milky Ways could fit across it! And considering it takes our Solar System about 225 million years to complete a single revolution around the Milky Way… well… yeah. Galaxies are big. Really, really, really, really big!
</Kermit arms>
Now if you’ll pardon me, I need to go stop my head from spinning… Read this and more on Rhys Taylor’s blog here, and add Rhys to your awesome astronomy Google+ circles here. And you can find out more about IC 1101 in the video below from Tony Darnell, aka DeepAstronomy:
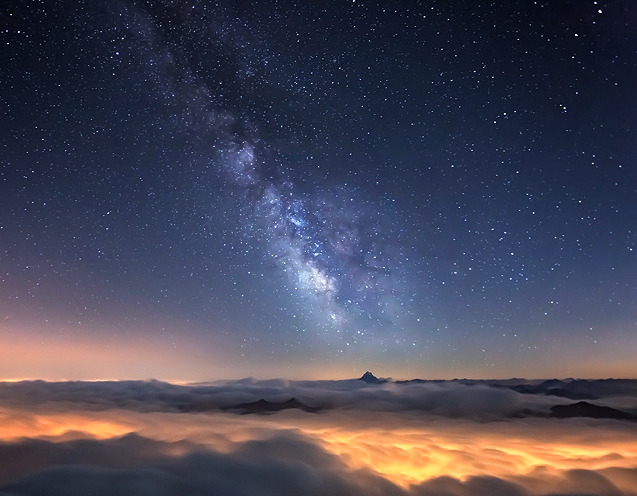
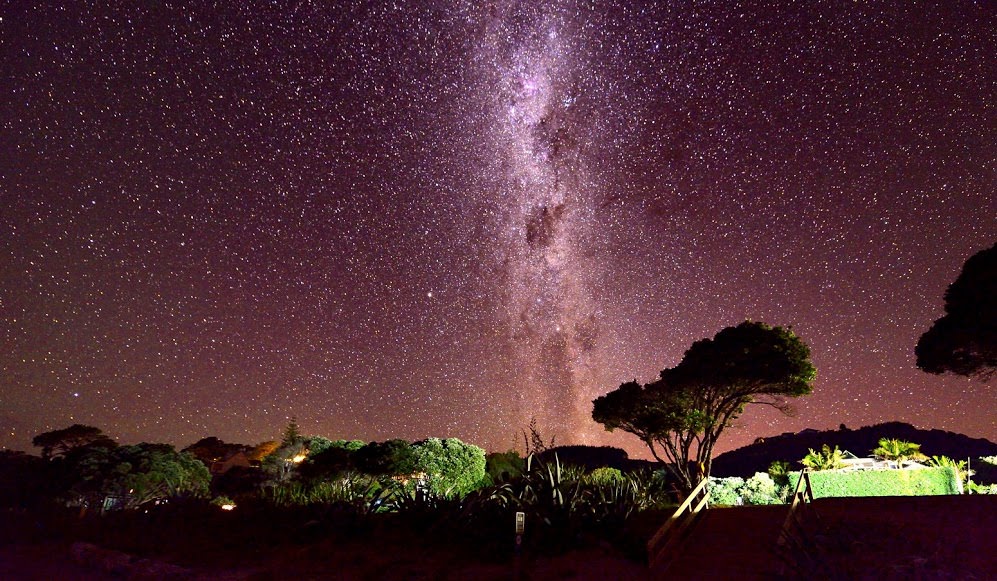
The Milky Way over New Zealand. Credit: Zhang Hong.
There are some moments in an astrophotographer’s life that you just have to step back and say thanks for the view. “Thanks clear sky,” said Zhang Hong when he posted this image on Google+.
This almost looks like a shower of stars raining down. Just gorgeous.
Here are the specs on his equipment: Nikon D800, Aperture: f/2.8, Focal length: 14.mm, exposure time:25.9 seconds, ISO-4000, -0.7 exposure compensation, spot metering, no flash, equatorial mount.
Want to get your astrophoto featured on Universe Today? Join our Flickr group or send us your images by email (this means you’re giving us permission to post them). Please explain what’s in the picture, when you took it, the equipment you used, etc.
Back by popular demand… the Weekly Space Hangout has returned. This is a weekly broadcast on Google+, where I’m joined by a wide and varied team of space and astronomy journalists to discuss the big breaking stories this week.
We record the Weekly Space Hangout every Friday on Google+ at 12:00 pm PST / 3:00 pm EST / 2000 GMT. You’ll want to circle Cosmoquest on Google+ to find out when we’re recording next. The audio for the Weekly Space Hangout is also released to the Astronomy Castpodcast feed.
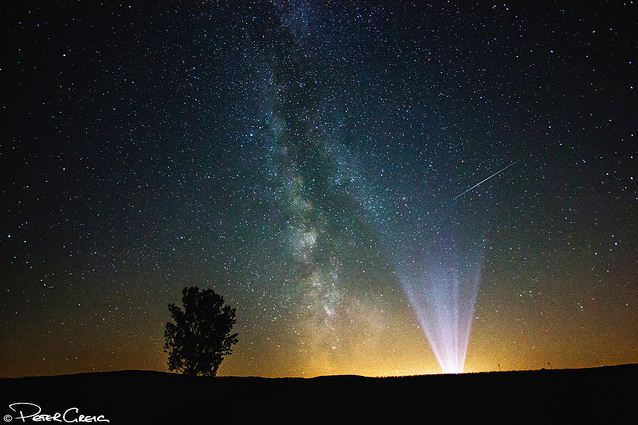
This great shot of the Milky Way includes some mysterious beams of light. But astrophotographer Peter Greig supplies the festive explanation: “This is a shot I took in Soisdorf, Germany earlier this year,” he writes. “The beams of light on the right are coming from a carnival in a nearby village!”
This photo was taken on September 7, 2012 using a Canon EOS 550D.
Want to get your astrophoto featured on Universe Today? Join our Flickr group or send us your images by email (this means you’re giving us permission to post them). Please explain what’s in the picture, when you took it, the equipment you used, etc.
Here’s another gorgeous timelapse by Gavin Heffernan, who returned to Joshua Tree National Park in California for his third look at the incredible night sky. “It was an epic night,” Gavin told UT, “with storms at first, then some of the clearest skies I’ve ever seen.”
The sky is ablaze with activity; the rolling storm, the Milky Way in all its glory, plus meteors, satellites and aircraft passing overhead. Gavin and his Sunchaser Pictures team shot the footage with a Canon 7D and Canon 5D, with a 24mm/1.4 lens and a 28mm/1.8. Most intervals are 25 seconds, except the 1st, which is 30 second, Gavin said.
If you like this one, take a look at Gavin’s first and second visits to Joshua Tree, too.
Want to explore the Milky Way? A new visualization tool from Google called 100,000 Stars lets you take a tour of our cosmic neighborhood, and with a few clicks of your mouse you can zoom in, out and around and do a little learning along the way. Zoom in to learn the names of some of the closest stars; click on the names to find out more information about them.
Playing with it is great fun, and I’ve been experimenting with it for a while. The most important caveat about 100,000 Stars is that you need to run it in Chrome. It’s from the Chrome Experiment team, and it uses imagery and data from NASA and ESA, but the majority of what you are seeing are artist’s renditions.
The best way to get started is to click on the Take the Tour in the upper left hand corner.
But if you just want to zoom in, you can see the closest stars to us. The Sun is in the middle, and if you zoom in even further, you’ll see the Oort Cloud. Keep zooming in to find the planetary orbits (I was struck by how much zooming had to be done to get to the planets, giving a sense of scale).
It includes some nifty spacey-like music (provided by Sam Hulick, who video game fans may recognize as a composer for the popular space adventure series, Mass Effect) but if you’d rather explore in silence, hit your mute button.
What I enjoyed the most is moving my mouse up and down to see the 3-D effect of how everything fits together, providing a sense of the cosmic web that holds our universe together.
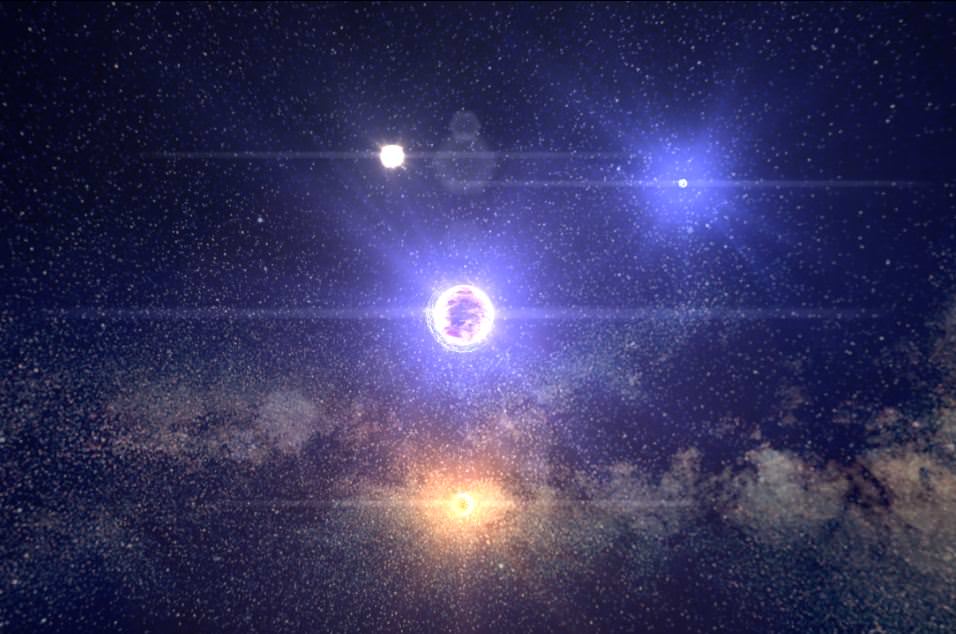
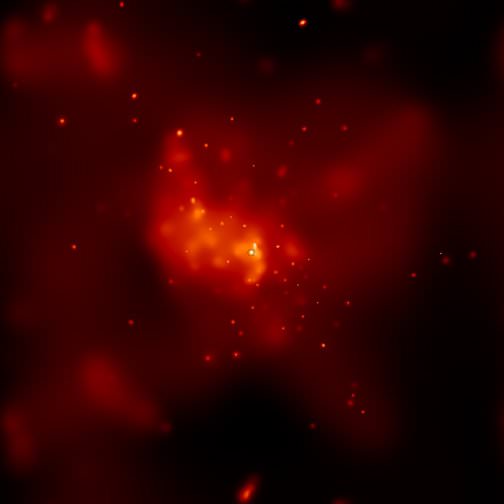
This false-color image shows the central region of our Milky Way Galaxy as seen by Chandra. The bright, point-like source at the center of the image was produced by a huge X-ray flare that occurred in the vicinity of the supermassive black hole at the center of our galaxy.
Image: NASA/MIT/F. Baganoff et al.
For some unknown reason, the black hole at the center of the Milky Way galaxy shoots out an X-ray flare about once a day. These flares last a few hours with the brightness ranging from a few times to nearly one hundred times that of the black hole’s regular output. But back in February 2012, astronomers using the Chandra X-Ray Observatory detected the brightest flare ever observed from the central black hole, also known as Sagittarius A*. The flare, recorded 26,000 light years away, was 150 times brighter than the black hole’s normal luminosity.
What causes these outbursts? Scientists aren’t sure. But Sagittarius A* doesn’t seem to be slowing down, even though as black holes age they should show a decrease in activity.
Mysterious X-ray flares caught by Chandra may be asteroids falling into the Milky Way's giant black hole. Credit: X-ray: NASA/CXC/MIT/F. Baganoff et al.; Illustrations: NASA/CXC/M.Weiss
Earlier this year, a group of researchers said that the outbursts may come from asteroids or even wandering planets that come too close to the black hole and they get consumed. Basically, the black hole is eating asteroids and then belching out X-ray gas.
Astronomers involved in this new observation seem to concur with that line of thinking.
“Suddenly, for whatever reason, Sagittarius A* is eating a lot more,” said Michael Nowak, a research scientist at MIT Kavli and co-author of a new paper in the Astrophysical Journal. “One theory is that every so often, an asteroid gets close to the black hole, the black hole stretches and rips it to pieces, and eats the material and turns it into radiation, so you see these big flares.”
Astronomers detect black holes by the light energy given off as they swallow nearby matter. The centers of newborn galaxies and quasars can appear extremely bright, giving off massive amounts of energy as they devour their surroundings. As black holes age, they tend to slow down, consuming less and appearing fainter in the sky.
“Everyone has this picture of black holes as vacuum sweepers, that they suck up absolutely everything,” says Frederick K. Baganoff, another co-author from MIT. “But in this really low-accretion-rate state, they’re really finicky eaters, and for some reason they actually blow away most of the energy.”
While such events like this big blast appear to be relatively rare, Nowak suspects that flare-ups may occur more frequently than scientists expect. The team has reserved more than a month of time on the Chandra Observatory to study Sagittarius A* in hopes of identifying more flares, and possibly what’s causing them.
“These bright flares give information on the flaring process that isn’t available with the weaker ones, such as how they fluctuate in time during the flare, how the spectrum changes, and how fast they rise and fall,” said Mark Morris from UCLA. “The greatest importance of this bright flare may be that it builds up the statistics on the characteristics of strong flares that can eventually be used to [identify] the cause of such flares.”
Even more intriguing to Baganoff is why the black hole emits so little energy. In 2003, he ran the very first observations with the then-new Chandra Observatory, and calculated that, given the amount of gas in its surroundings, Sagittarius A* should be about a million times brighter than it is — a finding that suggested the black hole throws away most of the matter it would otherwise consume.
The physics underlying such a phenomenon remain a puzzle that Baganoff and others hope to tease out with future observations.
“We’re really studying the great escape, because most of the gas escapes, and that’s not what we expect,” Baganoff says. “So we’re piecing out the history of the activity of the center of our galaxy.”
Paper: Chandra/HETGS Observations of the Brightest Flare seen from Sgr A*