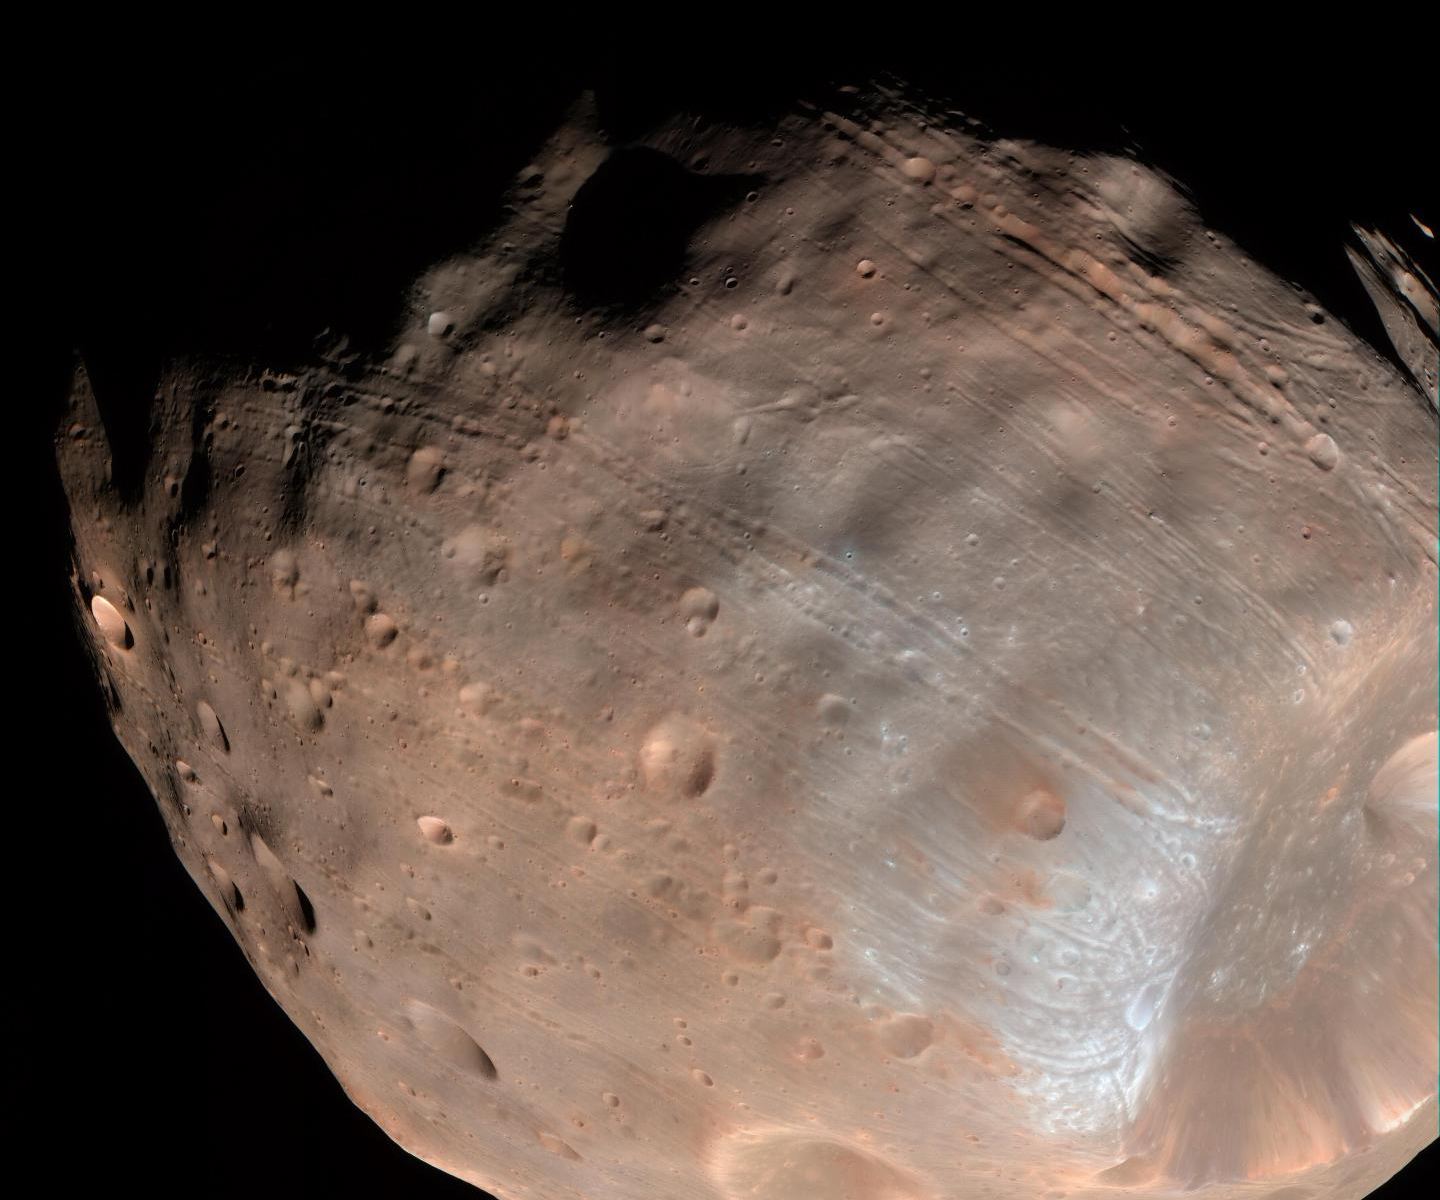
Japan is sending a spacecraft to Phobos to study it and collect samples for return to Earth. A German rover will be part of the fun.
Image Credit: NASA/JPL-Caltech/University of Arizona
The ESA’s Mars Express Orbiter is no stranger to the Martian moon Phobos. The spacecraft was launched in June 2003 and has been in orbit around Mars for 16 years. During its long time at Mars, it’s captured detailed images of Phobos, and helped unlocked some of that Moon’s secrets.
In a new sequence of 41 images captured during a recent fly-by, the Mars Express’ High Resolution Stereo Camera imaged Phobos from different angles, capturing images of the moon’s surface features, including the Stickney crater.
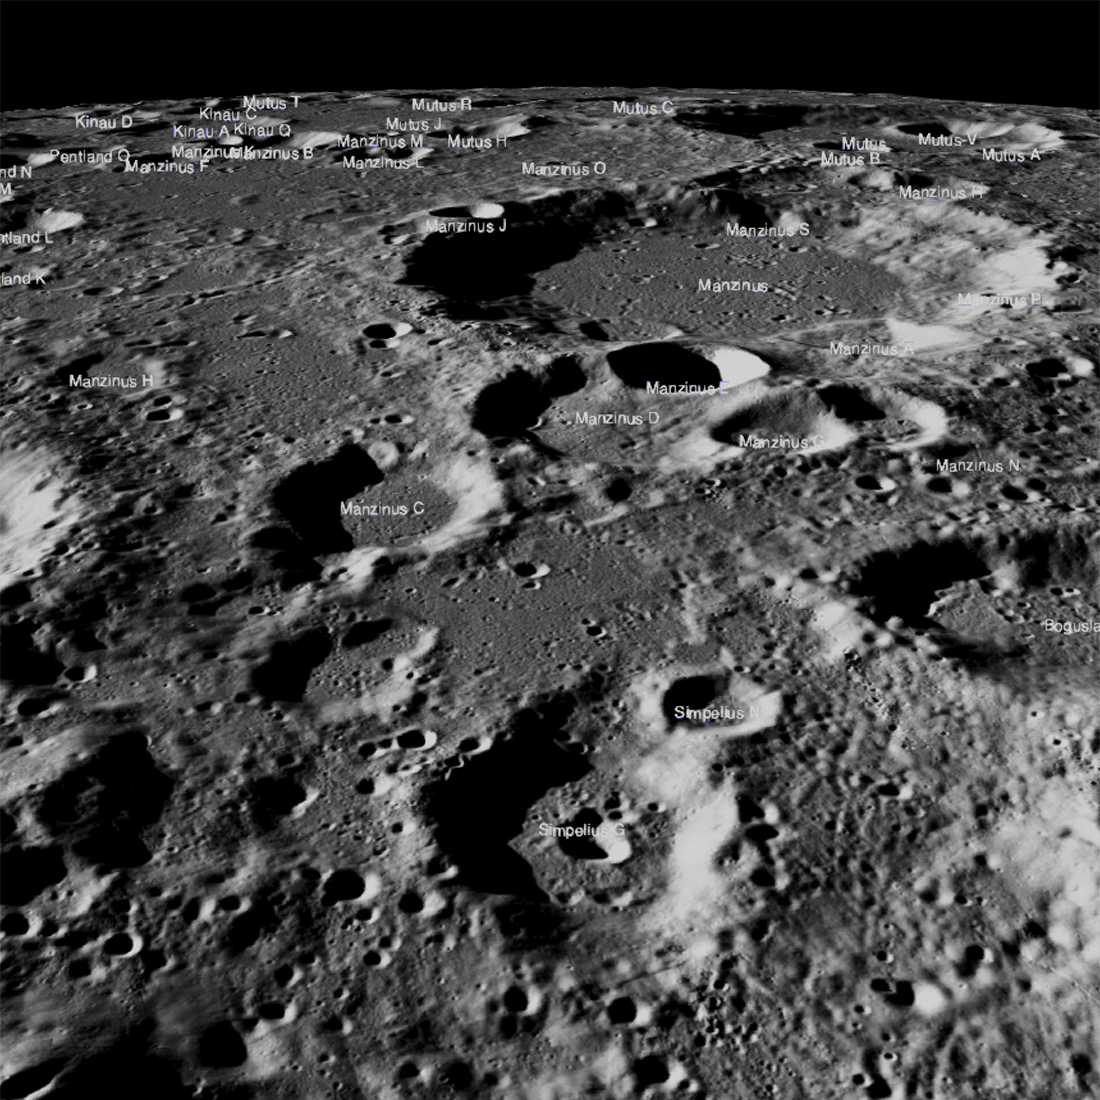
The Chandrayaan-2 lander, Vikram, attempted a landing September 7th (Friday the 6th in the United States), on a small patch of lunar highland smooth plains between Simpelius N and Manzinus C craters. Unfortunately the landing was not successful and location of the spacecraft has not been announced. The scene above was captured from an LROC Quickmap fly-around of the site, image width is about 150 kilometers across the center [NASA/GSFC/Arizona State University].
This image of the lunar highlands is from NASA’s Lunar Reconnaissance Orbiter. You’d need superhuman eyesight to spot it, but India’s crashed Vikram lander is in there somewhere. The lander attempted to land on the Moon on September 6th, but when it was only 2.1 km above the surface, within reach of its objective, ISRO (Indian Space Research Organization) lost contact with the spacecraft.
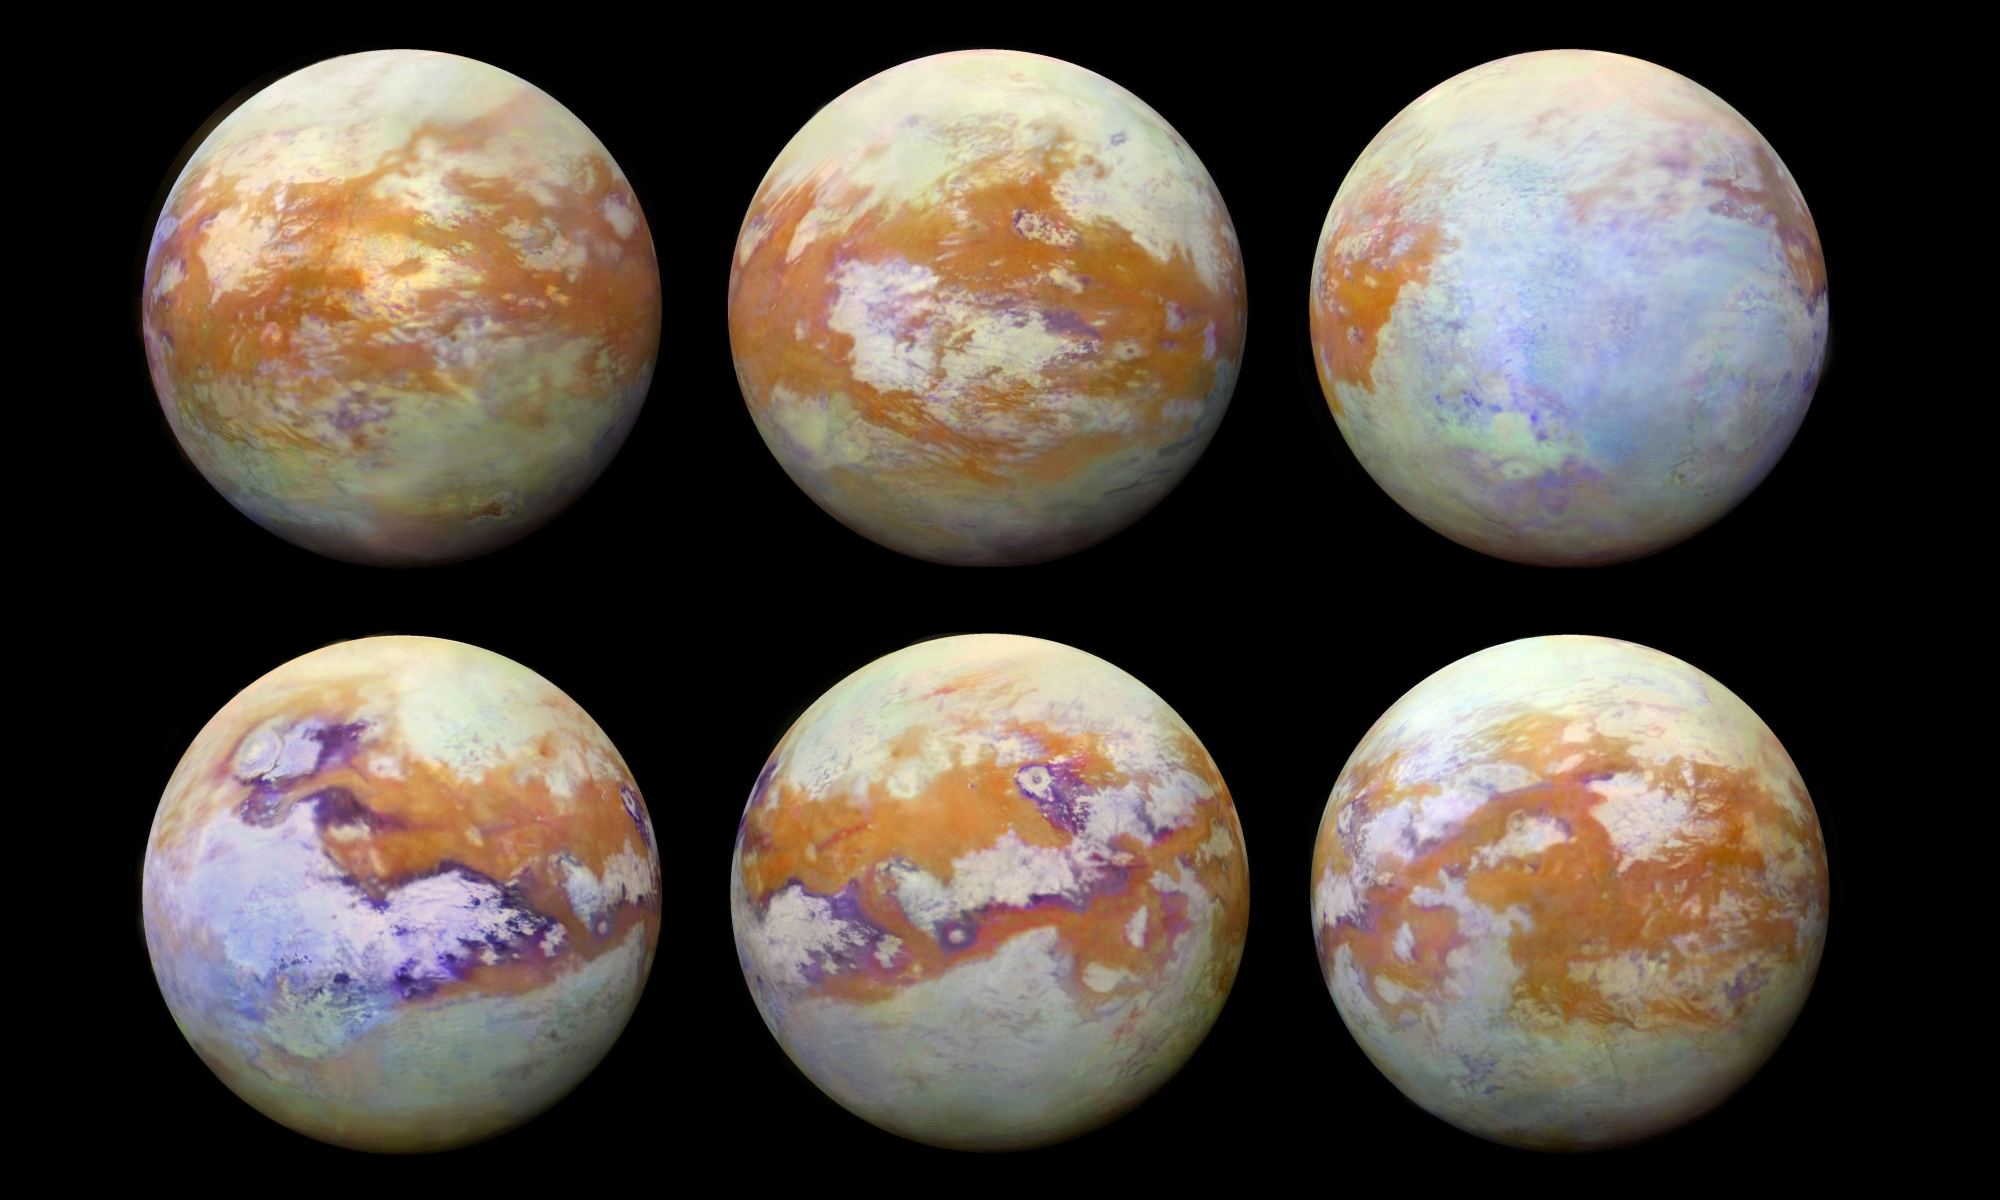
A global mosaic of the surface of Titan, thanks to the infrared eyes of the Cassini spacecraft. Image Credit: NASA/JPL-Caltech/University of Nantes/University of Arizona
Saturn’s moon Titan is a very strange place. It’s surrounded by a dense, opaque atmosphere, the only moon in the solar system with an atmosphere to speak of. It has lakes of liquid methane on its surface, maybe some cryovolcanoes, and some scientists speculate that it could support a form of life. Very weird life.
But we still don’t know a lot about it, because we haven’t really seen much of the surface. Until now.
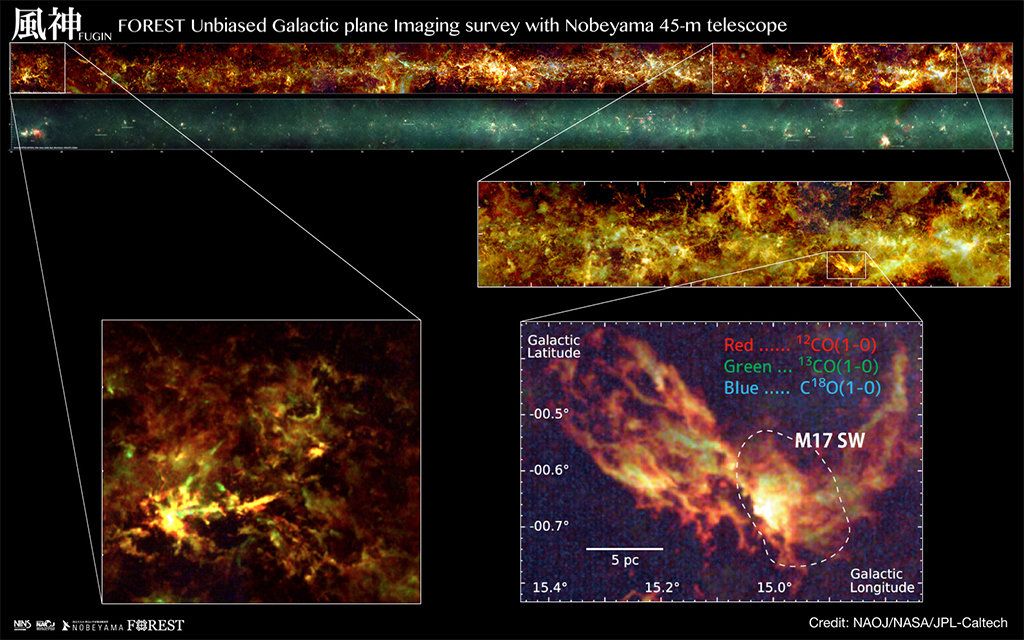
The FUGIN project used the 45 meter Nobeyama radio telescope in Japan to produce the most detailed radio wave map yet of the Milky Way. Top: Three color (false color) radio map of the Milky Way (l=10-50 deg) obtained by the FUGIN Project. Red, green, and blue represent the radio intensities of 12CO, 13CO, and C18O, respectively. Second Line: Infrared image of the same region obtained by the Spitzer Space Telescope. Red, green, and blue represent the intensities of 24?m, 8?m, and 5.8?m radio waves respectively. Top Zoom-In: Three color radio map of the Milky Way (l=12-22 deg) obtained by the FUGIN Project. The colors are the same as the top image. Lower-Left Zoom-In: Enlarged view of the W51 region. The colors are the same as the top image.Lower-Right Zoom-In: Enlarged view of the M17 region. The colors are the same as the top image. Image: NAOJ/NASA/JPL-Caltech
A Japanese telescope has produced our most detailed radio wave image yet of the Milky Way galaxy. Over a 3-year time period, the Nobeyama 45 meter telescope observed the Milky Way for 1100 hours to produce the map. The image is part of a project called FUGIN (FOREST Unbiased Galactic plane Imaging survey with the Nobeyama 45-m telescope.) The multi-institutional research group behind FUGIN explained the project in the Publications of the Astronomical Society of Japan and at arXiv.
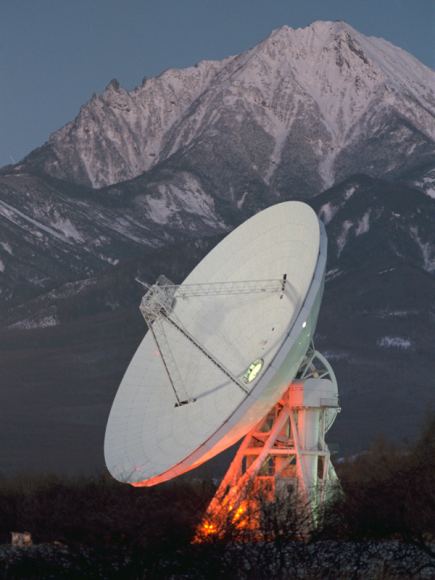
The Nobeyama 45 meter telescope is located at the Nobeyama Radio Observatory, near Minamimaki, Japan. The telescope has been in operation there since 1982, and has made many contributions to millimeter-wave radio astronomy in its life. This map was made using the new FOREST receiver installed on the telescope.
When we look up at the Milky Way, an abundance of stars and gas and dust is visible. But there are also dark spots, which look like voids. But they’re not voids; they’re cold clouds of molecular gas that don’t emit visible light. To see what’s happening in these dark clouds requires radio telescopes like the Nobeyama.
The Nobeyama 45m radio telescope at the Nobeyama Radio Observatory in Japan. Image:NAOJ
The Nobeyama was the largest millimeter-wave radio telescope in the world when it began operation, and it has always had great resolution. But the new FOREST receiver has improved the telescope’s spatial resolution ten-fold. The increased power of the new receiver allowed astronomers to create this new map.
The new map covers an area of the night sky as wide as 520 full Moons. The detail of this new map will allow astronomers to study both large-scale and small-scale structures in new detail. FUGIN will provide new data on large structures like the spiral arms—and even the entire Milky Way itself—down to smaller structures like individual molecular cloud cores.
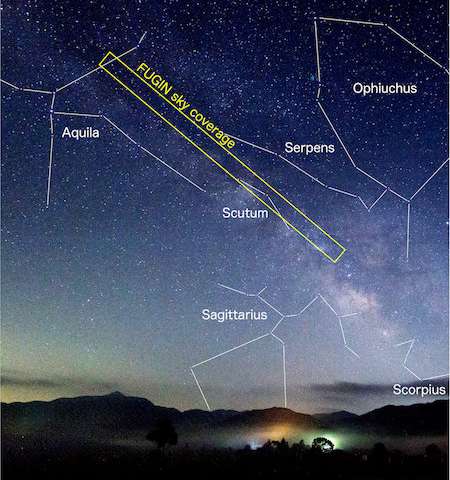
FUGIN is one of the legacy projects for the Nobeyama. These projects are designed to collect fundamental data for next-generation studies. To collect this data, FUGIN observed an area covering 130 square degrees, which is over 80% of the area between galactic latitudes -1 and +1 degrees and galactic longitudes from 10 to 50 degrees and from 198 to 236 degrees. Basically, the map tried to cover the 1st and 3rd quadrants of the galaxy, to capture the spiral arms, bar structure, and the molecular gas ring.
Starscape photograph taken at Nobeyama Radio Observatory by Norikazu Okabe. The FUGIN observation region (l=10-50 deg) is marked. Credit: National Astronomical Observatory of Japan
The aim of FUGIN is to investigate physical properties of diffuse and dense molecular gas in the galaxy. It does this by simultaneously gathering data on three carbon dioxide isotopes: 2CO, 13CO, and 18CO. Researchers were able to study the distribution and the motion of the gas, and also the physical characteristics like temperature and density. And the studying has already paid off.
FUGIN has already revealed things previously hidden. They include entangled filaments that weren’t obvious in previous surveys, as well as both wide-field and detailed structures of molecular clouds. Large scale kinematics of molecular gas such as spiral arms were also observed.
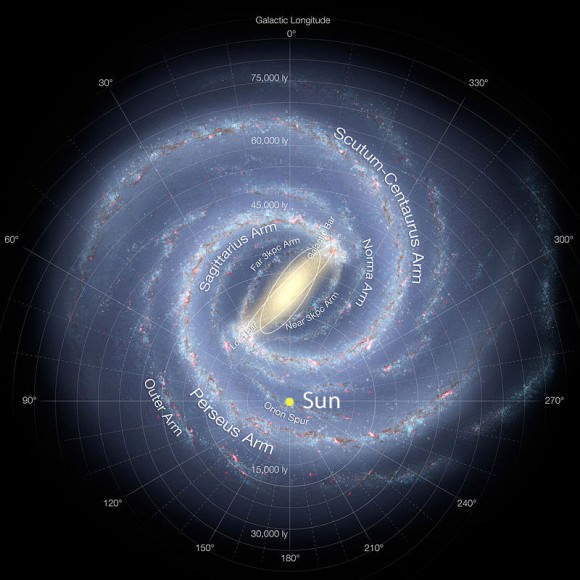
An artist’s image showing the major features of the Milky Way galaxy. Credit: NASA/JPL-Caltech, ESO, J. Hurt
But the main purpose is to provide a rich data-set for future work by other telescopes. These include other radio telescopes like ALMA, but also telescopes operating in the infrared and other wavelengths. This will begin once the FUGIN data is released in June, 2018.
Millimeter wave radio astronomy is powerful because it can “see” things in space that other telescopes can’t. It’s especially useful for studying the large, cold gas clouds where stars form. These clouds are as cold as -262C (-440F.) At temperatures that low, optical scopes can’t see them, unless a bright star is shining behind them.
Even at these extremely low temperatures, there are chemical reactions occurring. This produces molecules like carbon monoxide, which was a focus of the FUGIN project, but also others like formaldehyde, ethyl alcohol, and methyl alcohol. These molecules emit radio waves in the millimeter range, which radio telescopes like the Nobeyama can detect.
The top-level purpose of the FUGIN project, according to the team behind the project, is to “provide crucial information about the transition from atomic gas to molecular gas, formation of molecular clouds and dense gas, interaction between star-forming regions and interstellar gas, and so on. We will also investigate the variation of physical properties and internal structures of molecular clouds in various environments, such as arm/interarm and bar, and evolutionary stage, for example, measured by star-forming activity.”
This new map from the Nobeyama holds a lot of promise. A rich data-set like this will be an important piece of the galactic puzzle for years to come. The details revealed in the map will help astronomers tease out more detail on the structures of gas clouds, how they interact with other structures, and how stars form from these clouds.
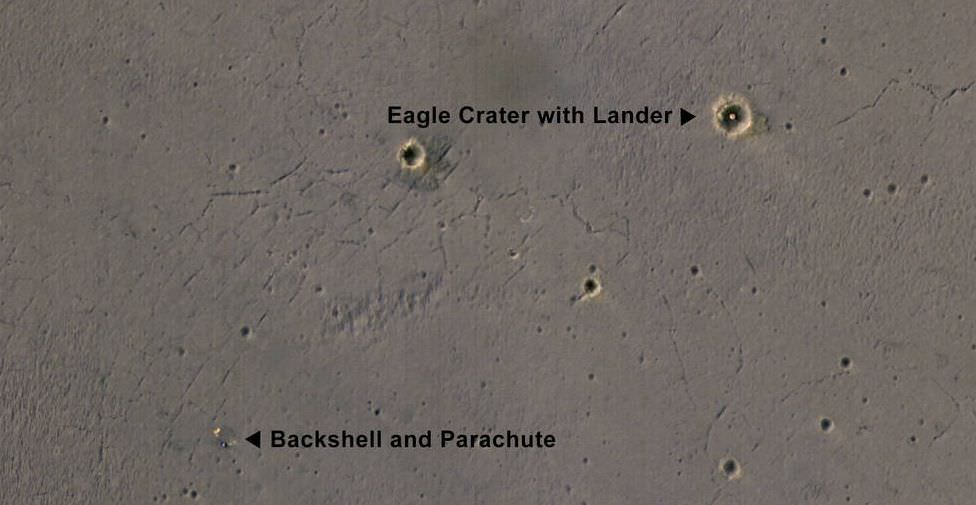
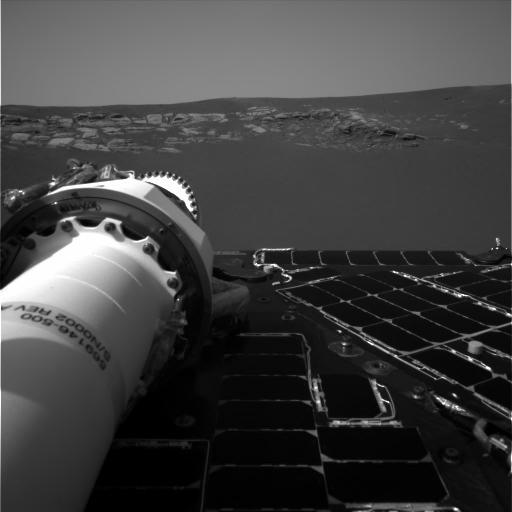
This image taken by the Mars Reconnaissance Orbiter's HiRise camera shows the bright landing platform left behind by NASA's Mars Exploration Rover Opportunity when it landed in 2004. Opportunity landed on the surface of Mars and then bounced and tumbled into the Eagle Crater. The image was taken on April 8, 2017. Image: NASA/JPL-Caltech/Univ. of Arizona
NASA’s eagle-eyed Mars Reconnaissance Orbiter (MRO) has captured orbital images of Opportunity’s Hole-In-One landing site, smack dab in the middle of Eagle Crater on the surface of Mars.
Opportunity arrived at Mars on January 25th, 2005. It’s landing was slowed by parachute, and cushioned by airbags. Once it hit the surface, it bounced its way into “Eagle Crater“, a feature a mere 22 meters across. Not a bad shot!
This is the first color image that the High Resolution Imaging Science Experiment (HiRise) has captured of Opportunity’s landing site. It shows the remarkable landing site inside the crater, where the landing pad was left behind after Opportunity rolled off of it and got going. It also shows the rover’s parachute and backshell.
It’s amazing that, given the relatively smooth surface in Opportunity’s landing area, the rover came to rest inside a small crater. When Opportunity “woke up” at its landing site, its first images were of the inside of Eagle Crater. This was the first look we ever got at the sedimentary rocks on Mars, taken by the rover’s navigation camera.
Opportunity’s navigation camera took this picture, one of the rover’s first, of the inside of Eagle Crater. Exposed Martian rocks are visible. NASA/JPL
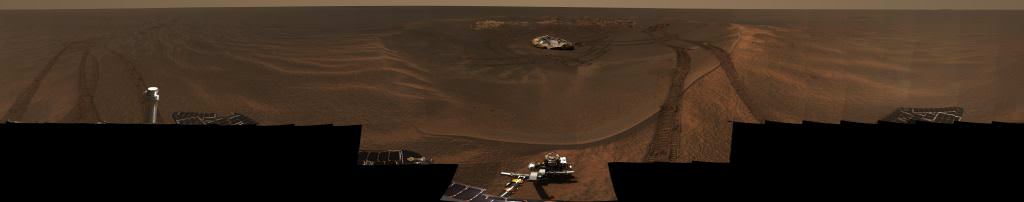
After leaving Eagle Crater, Opportunity took a look back and captured a panoramic image. Plainly visible is the rover’s landing pad, the exposed sedimentary rock, and the rover’s tracks in the Martian soil.
This panorama image, called “Lion King” was assembled from 558 images totalling over 75 megabytes. The rock outcrop, the landing pad, and the rover’s tracks are all clearly visible. Image: NASA/JPL/Cornell
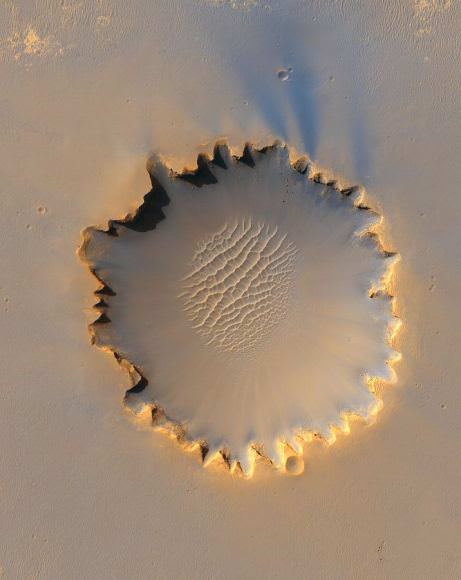
MRO arrived at Mars a couple years later, and by that time Opportunity had already left its landing site and made its way south to the much larger Victoria Crater.
When the Mars Reconnaissance Orbiter arrived at Mars, 2 years after Opportunity touched down there, Opportunity had left Eagle Crater and travelled the 6 km to Victoria Crater. By NASA/JPL/University of Arizona – http://photojournal.jpl.nasa.gov/catalog/PIA08813, Public Domain, https://commons.wikimedia.org/w/index.php?curid=4211043
Opportunity is still chugging along, doing valuable work. And so is the MRO and its HiRise instrument. At this point, Opportunity has to be considered one of the most successful scientific undertakings ever.
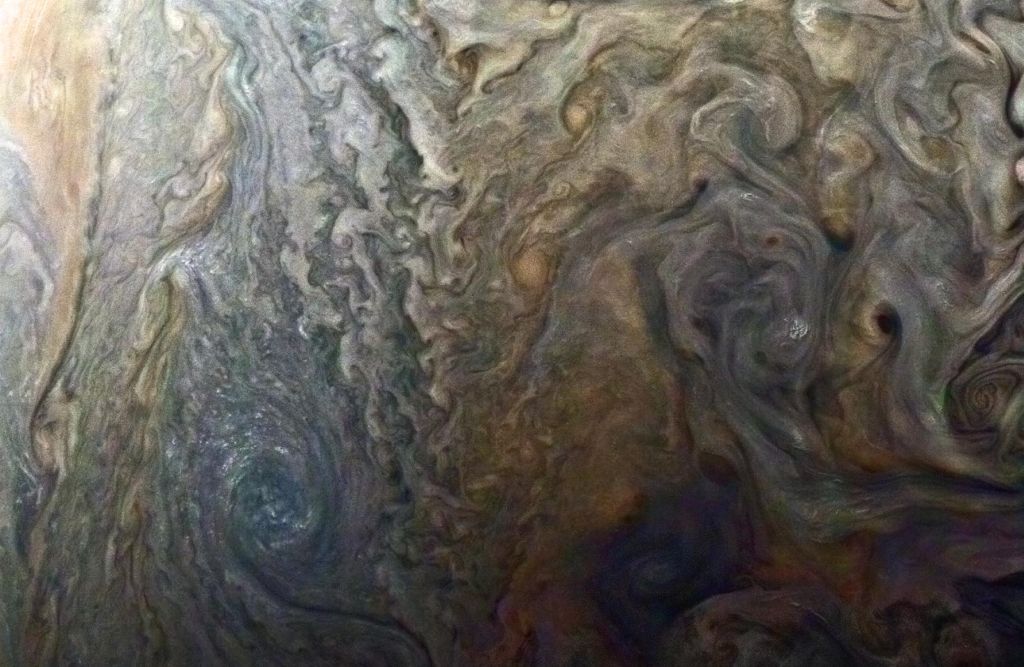
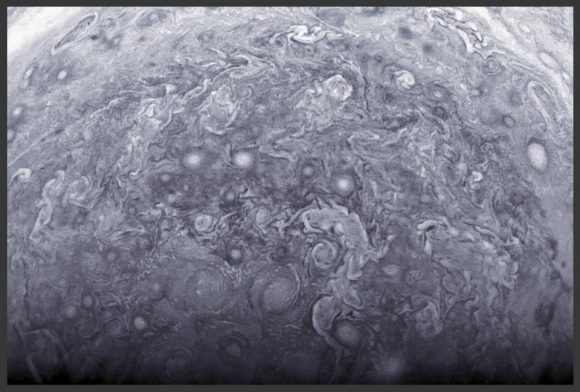
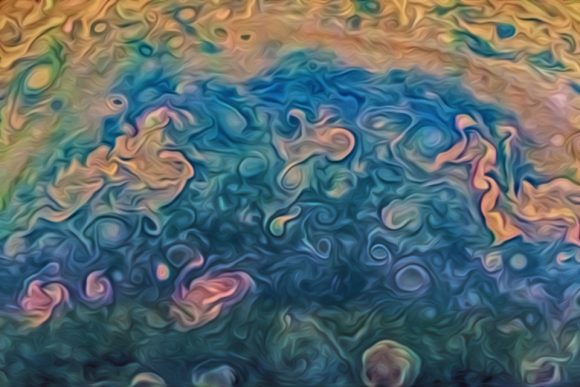
This image of Jupiter from the Juno probe shows an intricate dance of storms and swirls. The enhanced color image was captured on February 2nd, from only 14,500 km above the gas giant's cloud tops. Image: NASA/JPL-Caltech/SwRI/MSSS/Roman Tkachenko
Juno is only part way through its mission to Jupiter, and already we’ve seen some absolutely breathtaking images of the gas giant. On Monday, the Juno spacecraft will flyby Jupiter again. This will be the craft’s 5th flyby of the gas giant, and it’ll provide us with our latest dose of Jupiter science and images. The first 4 flybys have already exceeded our expectations.
Juno will approach to within 4,400 km of Jupiter’s cloud tops, and will travel at a speed of 207,600 km/h. During this time of closest approach, called a perijove, all of Juno’s eight science instruments will be active, along with the JunoCam.
The JunoCam is not exactly part of the science payload. It was included in the missions to help engage the public with the mission, and it appears to be doing that job well. The Junocam’s targets have been partly chosen by the public, and NASA has invited anyone who cares to to download and process raw Junocam images. You can see those results throughout this article.
This is Juno’s 5th flyby, but only its 4th science pass. During Juno’s first encounter with Jupiter, the science instruments weren’t active. Even so, after only 3 science passes, we have learned some things about Jupiter.
“We are excited to see what new discoveries Juno will reveal.” – Scott Bolton, NASA’s Principal Investigator for the Juno Mission
“This will be our fourth science pass — the fifth close flyby of Jupiter of the mission — and we are excited to see what new discoveries Juno will reveal,” said Scott Bolton, principal investigator of Juno from the Southwest Research Institute in San Antonio. “Every time we get near Jupiter’s cloud tops, we learn new insights that help us understand this amazing giant planet.”
We’ve already learned that Jupiter’s intense magnetic fields are much more complicated than we thought. We’ve learned that the belts and zones in Jupiter’s atmosphere, which are responsible for the dazzling patterns on the cloud tops, extend much deeper into the atmosphere than we thought. And we’ve discovered that charged material expelled from Io’s volcanoes helps cause Jupiter’s auroras.
Juno has the unprecedented ability to get extremely close to Jupiter. This next flyby will bring it to within 4,400 km of the cloud tops. But to do so, Juno has to pay a price. Though the sensitive equipment on the spacecraft is protected inside a titanium vault, Jupiter’s powerful radiation belts will still take a toll on the electronics. But that’s the price Juno will pay to perform its mission.
Other missions, like Cassini, have been measured in years, while Juno’s will be measured in orbits. And once it’s completed its final orbit, it will be sent to its destruction in Jupiter’s atmosphere.
But before that happens, there’s a lot of science to be done, and a lot of stunning images to be captured.
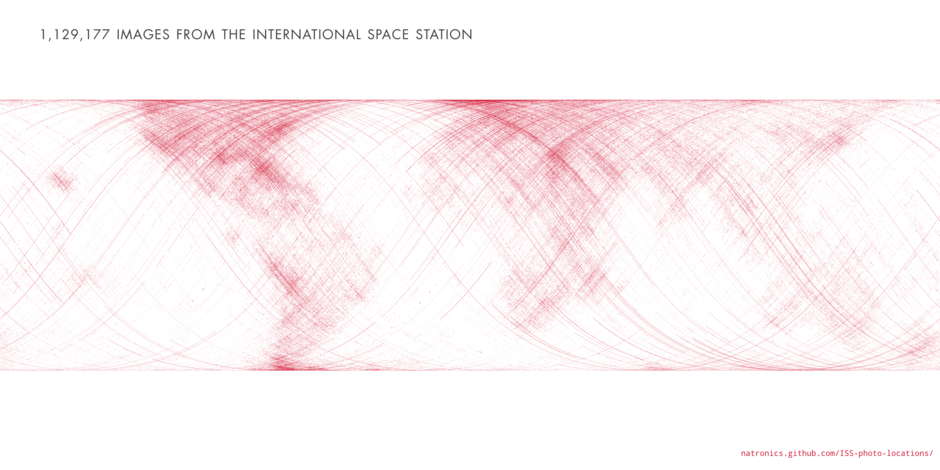
A map of the world made up of the locations of ISS astronaut photos (Nathan Bergey/open.nasa.gov)
If you could spend a few months — or even a few days — living aboard the ISS, what would you take pictures of? Earth, most likely, with your favorite landforms and your family’s and friends’ hometowns ranking high on the list. After a while, I’m sure plenty of other Earthly features would become photo targets — weather, aurorae, world cities at night, etc. — but ultimately, over the course of your stay in orbit, you would be able to see a trend in the pictures you take, and where you took them.
And over the span of 35 missions across more than 12 years, the graph above shows the trend of all the astronauts’ pictures. Look familiar?
Nighttime photo of the Nile delta region taken from the ISS (NASA)
Created by open-source NASA data aficionado Nate Bergey, the image above is a map made up of over a million points (1,129,177, to be exact) each representing the global coordinates of an JSC-archived photograph taken from the ISS.
Clearly the continents are astronauts’ favored photo subjects, with the populous urban areas of North America, Europe, Egypt and the Middle East, as well as the western and southern coasts of South America standing out.
“This makes sense, photos of clouds over an otherwise blank ocean get old after a while,” Nate Bergey wrote on his blog, open.nasa.gov. “I’m sure every astronaut has taken at least one photograph of the town they grew up in.”
Of course, the map doesn’t create an image of the entire globe. This is because the points denote actual over-ground coordinates of the Station (not necessarily what the photos themselves are of) and “the ISS stays between about 50° and -50° latitude as it orbits the Earth,” as noted by Bergey.
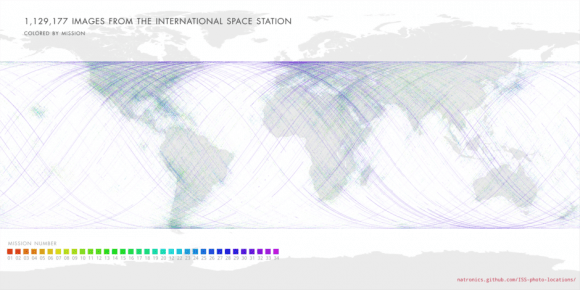
A map of the world with the points overlaid onto it, color-coded by mission, shows the difference:
Bergey also notes the proliferation of purple-colored dots… these indicate the hundreds of images taken by NASA astronaut Don Pettit during Expedition 30/31, when he created incredible time-lapse videos of the Earth from the ISS.
One of many long-exposure images taken by Don Pettit aboard the ISS (NASA/JSC). See more here.
With such a unique and lofty perspective of our world, it’s no wonder that astronauts spend so much time snapping photos — I can’t say I’d be able to tear myself away from the window myself! Read more about Nate Bergey’s project and how he created his map on his open.NASA blog here.
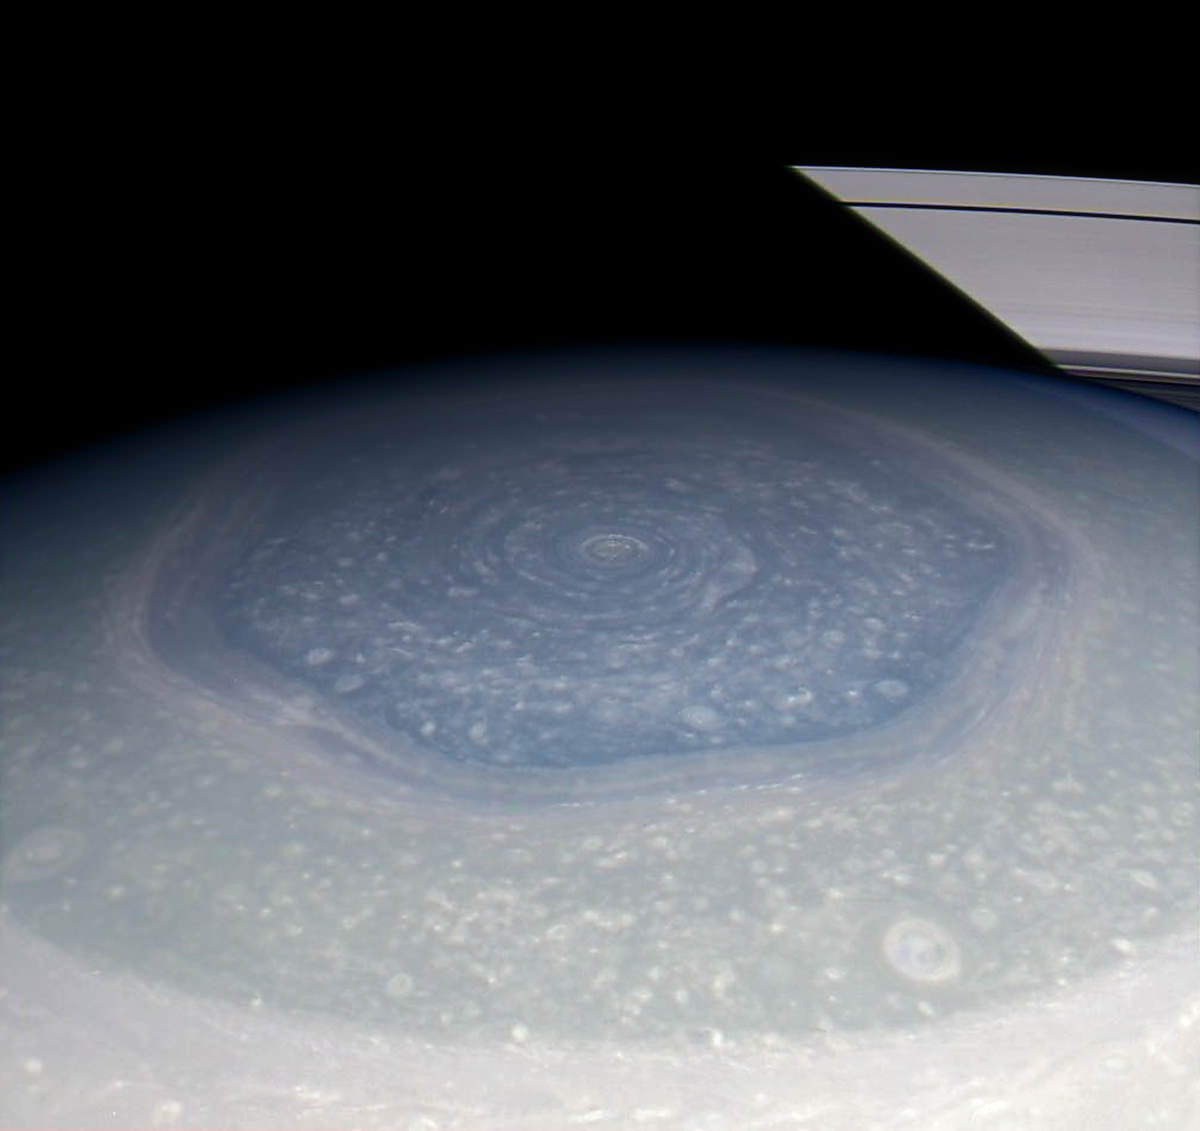
Color-composite Cassini image of Saturn’s northern hexagon (NASA/JPL/SSI/Jason Major)
Cassini sure has been busy these past few days! After returning some mind-blowing images of the swirling 3,000-km-wide cyclone over Saturn’s north pole the spacecraft pulled back to give a wider view of the ringed giant’s upper latitudes, revealing one of its most curious features: the northern hexagon.
The image above is a color-composite made from raw images acquired by Cassini on November 28 from a distance of 379,268 miles (610,373 kilometers) away. Because the color channels were of a much lower resolution than the clear-filter monochrome image, the color is approximate in relation to individual atmospheric details. Still, it gives an idea of the incredible variation in hues around Saturn’s northern hemisphere as well as clearly showing the uncannily geometric structure of the hexagon.
(Can I get another “WOW”?)
Made of a band of upper-atmospheric winds, for some reason at this latitude the stream forms a six-sided hexagonal shape. The entire structure is about 25,000 km across — large enough for four Earths to fit inside! The polar cyclone can be seen at the very center.
First seen by Voyagers 1 and 2 over 30 years ago the hexagon appears to be fixed with Saturn’s rotation rate, which is a remarkably speedy 0.44 Earth-days (about 10.5 hours.)
“This is a very strange feature, lying in a precise geometric fashion with six nearly equally straight sides,” said atmospheric expert and Cassini team member Kevin Baines back in 2007. “We’ve never seen anything like this on any other planet. Indeed, Saturn’s thick atmosphere where circularly-shaped waves and convective cells dominate is perhaps the last place you’d expect to see such a six-sided geometric figure, yet there it is.”
As scientists puzzled over the mechanisms behind the geometric feature, they came to the conclusion that not only is it a very natural occurrence, it’s also something that is not uncommon in fluid dynamics… apparently its sides are bound by the eddying storms. (Read more in this article by Nicole Gugliucci.)
Here are some more raw images from Cassini’s Nov. 28 pass:
Amazing! Here we are well over 8 years after arriving at Saturn and Cassini is still astounding us almost daily with views of the ringed world. (I knew it was my favorite planet for a reason!)
As always, stay tuned to Universe Today for more!
Image credits: NASA/JPL/Space Science Institute. Color-composite by Jason Major.
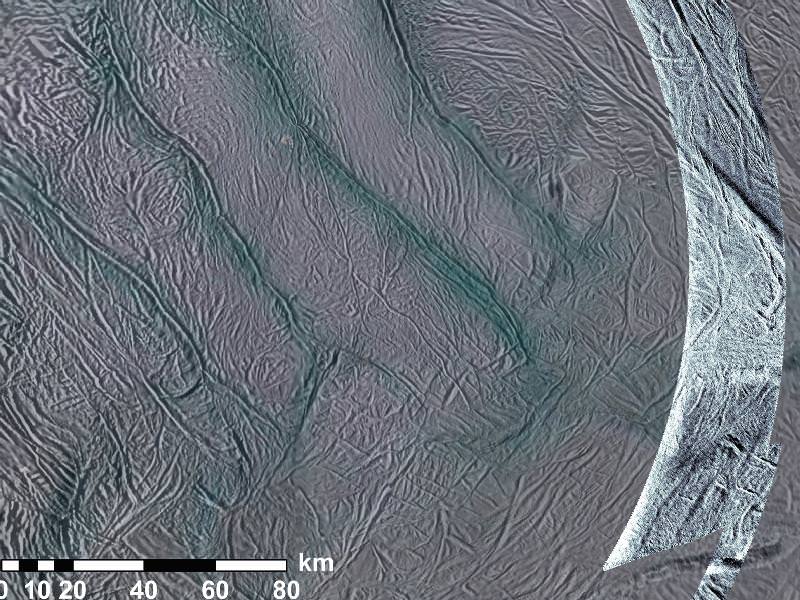
New radar images from Encealdus' south pole show high amounts of surface texturing. NASA/JPL-Caltech/SSI.
[/caption]
Cassini’s done it again! Soaring over Saturn’s moon Enceladus back on November 6, the spacecraft obtained the highest-resolution images yet of the moon’s south polar terrain, revealing surface details with visible, infrared and radar imaging that have never been seen before.
Of particular interest are new image swaths acquired by the spacecraft’s synthetic-aperture radar (SAR) instrument, which has never before been used on Enceladus. The radar, which is highly sensitive to surface textures, reveals some extremely bright regions that have surprised scientists.
Detail of the radar-imaged area (enlarged). NASA/JPL-Caltech/SSI.
“It’s puzzling why this is some of the brightest stuff Cassini has seen,” said Steve Wall, deputy team lead of Cassini’s radar team based at NASA’s Jet Propulsion Laboratory in Pasadena. “One possibility is that the area is studded with rounded ice rocks. But we can’t yet explain how that would happen.”
The SAR images did not focus on the moon’s now-famous “tiger stripe” fractures (called sulci) which are the sources of its icy jets. Instead, Cassini scanned areas a few hundred miles around the stripes. These regions have not been extensively imaged before and this new data shows surface patterns and elevations that had been previously unknown.
Some of the steep grooves in the imaged areas were shown to be as deep as 2,100 feet (650 m), and 1.2 miles (2 km) wide.
Cassini passed by the 318-mile (511-km) -wide moon at 04:49 UTC on November 6, 2011. Cassini’s radar instrument was built by JPL and the Italian Space Agency, working with team members from the U.S. and several European countries. Previously used to image the surface of Titan, which is hidden from view by a thick atmosphere, this is the first time the instrument was used on Enceladus.
If you’re reading this, you’re probably very well aware of the Cassini mission. Launched in 1997, the Cassini spacecraft arrived at Saturn in June of 2004 and has been faithfully returning image after beautiful image of Saturn, its rings and its very extended family of moons ever since – not to mention all the groundbreaking scientific discoveries it’s made about the Saturnian system… and our solar system as a whole. Cassini truly is a rock star in the world of robotic space exploration, and now it has its own Hall of Fame to show off some of its best work!
The Cassini mission site put up by JPL/Caltech regularly features news and images from the mission, even including the latest downlinked raw image data from the spacecraft. In this way anyone can keep up with what Cassini is seeing and when, far before the images are included in NASA’s Planetary Data System. The new Cassini Image Hall of Fame showcases the “best of the best” from the mission, and is a great way to revisit Cassini’s past discoveries. (With so much happening at Saturn, sometimes it’s easy to forget all the amazing things Cassini has brought to our attention!)
Revisit the best of the best images of Saturn
If you’re a fan of Saturn (and really, who isn’t?) be sure to check this out. With the current mission extended into 2017 there’s sure to be lots more additions to the Hall of Fame on the way, too!
The Cassini-Huygens mission is a cooperative project of NASA, the European Space Agency and the Italian Space Agency. The Jet Propulsion Laboratory, a division of the California Institute of Technology in Pasadena, manages the mission for NASA’s Science Mission Directorate, Washington. The Cassini orbiter and its two onboard cameras were designed, developed and assembled at JPL. The imaging operations center is based at the Space Science Institute in Boulder, Colorado.
Also, be sure to visit the hard-working Cassini imaging team’s homepage at http://ciclops.org… they are the ones responsible for all these fantastic images in the first place!