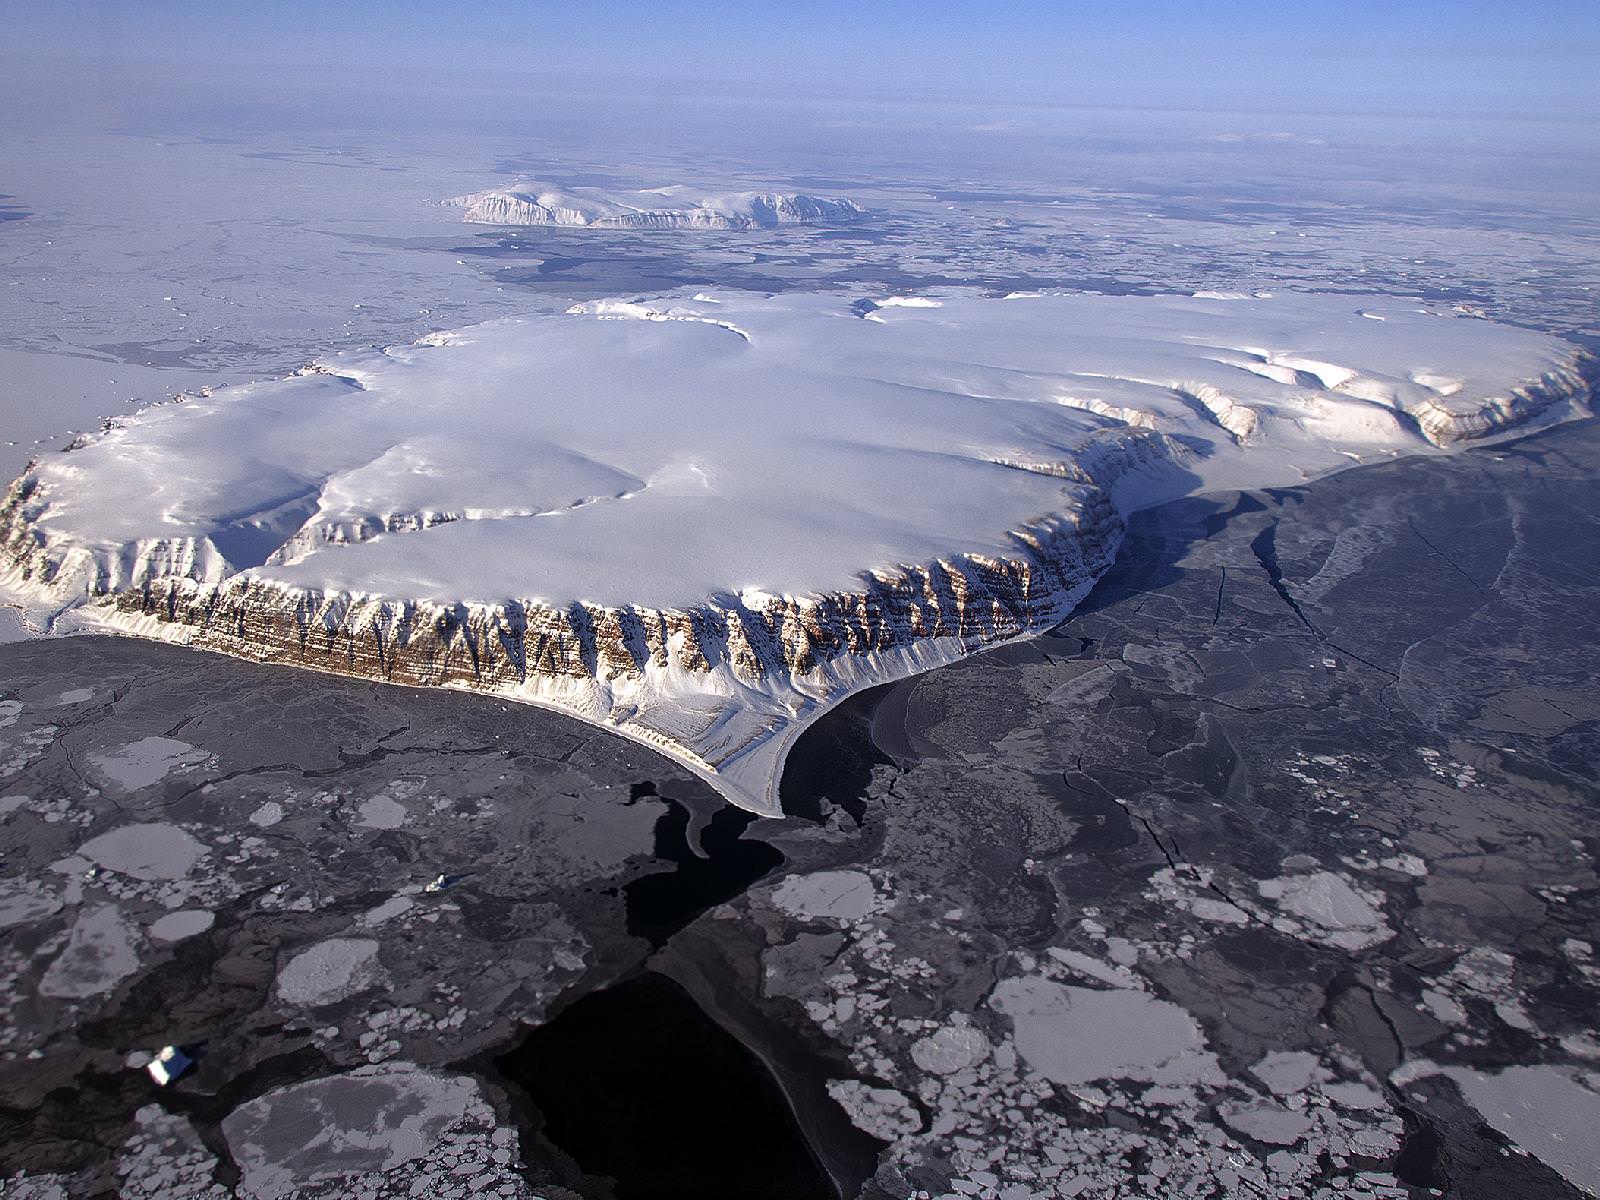
Saunders Island and Wolstenholme Fjord with Kap Atholl in the background photographed during a NASA IceBridge flight. (NASA/Michael Studinger)
It’s quite a long way from Mars, but I can’t help but be reminded of the Red Planet’s ice-covered north pole when looking at this photo taken by Michael Studinger earlier this month, during a recent IceBridge survey flight over Greenland.
Called Saunders Island (also Appat Island) the 82-square-mile frozen slab of rock rises from the sea off the coast of northwestern Greenland, one of many islands within the Wolstenholme (Uummannaq) Fjord on the shore of Baffin Bay. Operation IceBridge, a six-year aerial survey of the changing ice coverage at our planet’s poles, is run by NASA to provide valuable ground-level information to supplement satellite data.
To me, the shape of the island’s steep rock faces and rugged inlets slice into its interior bear a striking resemblance to Mars’ ice cap.
Mars’ north polar ice cap
While Mars’ ice cap is shaped by very different processes — and obviously much bigger — you might see the connection too!
But rather than dark Martian dunes, sea ice can be seen surrounding the islands in varying thicknesses in the IceBridge photo above. Sea ice coverage in the fjord ranges from thicker, white ice in the background to thinner “grease” ice and leads with dark, open ocean water in the foreground.
The IceBridge P-3B airborne laboratory in a hangar at Wallops Flight Facility (NASA/George Hale)
As the amount of darker, ice-free water surfaces increase over the course of the year due to rising global temperatures, the more heat from solar radiation is collected in the ocean — thus speeding up the process of seasonal sea ice loss and overall Arctic warming.
Read more about the IceBridge mission here, and see a collection of more photos from this season’s flights here.
NASA’s Operation IceBridge images Earth’s polar ice in unprecedented detail to better understand processes that connect the polar regions with the global climate system. IceBridge utilizes a highly specialized fleet of research aircraft and the most sophisticated suite of innovative science instruments ever assembled to characterize annual changes in thickness of sea ice, glaciers, and ice sheets. In addition, IceBridge collects critical data used to predict the response of earth’s polar ice to climate change and resulting sea-level rise.
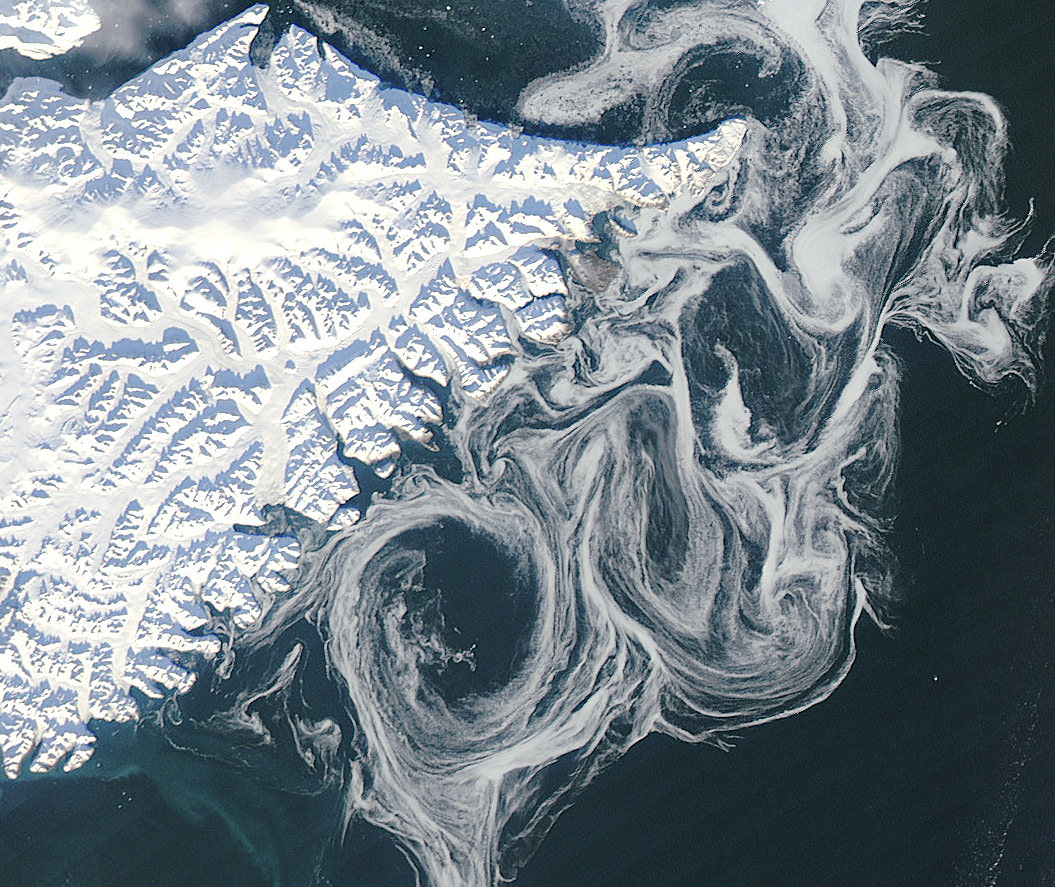
Sea ice swirls in ocean currents off the coast of Greenland (NASA/GSFC)
Spooky spectral swirls of last season’s sea ice drift in currents off the coast of eastern Greenland in this image from NASA’s Aqua satellite, acquired on October 17. Although sea ice in the Arctic will start forming again after September’s record low measurements, these ghostly wisps are likely made up of already-existing ice that has migrated south.
As global temperatures rise — both over land and in the ocean — thinner sea ice builds up during the Arctic winter and thus more of it melts during the summer, a pattern that will eventually lead to an ice-free Arctic if trends continue. The past several years saw sea ice in the Arctic below the 1979-2000 average, with this past September displaying the lowest volumes yet recorded.
The graph below, made from data modeled by the Polar Science Center at the University of Washington, show the chilling — or, perhaps, not-so-chilling — results of this century’s recent observations.
Along Greenland’s east coast, the Fram Strait serves as an expressway for sea ice moving out of the Arctic Ocean. The movement of ice through the strait used to be offset by the growth of ice in the Beaufort Gyre.
Until the late 1990s, ice would persist in the gyre for years, growing thicker and more resistant to melt. Since the start of the twenty-first century, however, ice has been less likely to survive its trip through the southern part of the Beaufort Gyre. As a result, less Arctic sea ice has been able to pile up and form multi-year ice.
Thin, free-drifting ice — as seen above — moves very easily with winds and currents.
Aqua is a NASA Earth Science satellite mission named for the large amount of information that the mission is collecting about the Earth’s water cycle, including evaporation from the oceans, water vapor in the atmosphere, clouds, precipitation, soil moisture, sea ice, land ice, and snow cover on the land and ice. Aqua was launched on May 4, 2002, and carries six Earth-observing instruments in a near-polar low-Earth orbit. MODIS, which acquired the image above, is a 36-band spectroradiometer that measures physical properties of the atmosphere, oceans and land.
NASA image courtesy Jeff Schmaltz, LANCE MODIS Rapid Response Team at NASA GSFC. Graph by Jesse Allen based on modeled ice volume data from the Polar Science Center, University of Washington. Caption portions by Michon Scott with information from Ted Scambos, National Snow and Ice Data Center.
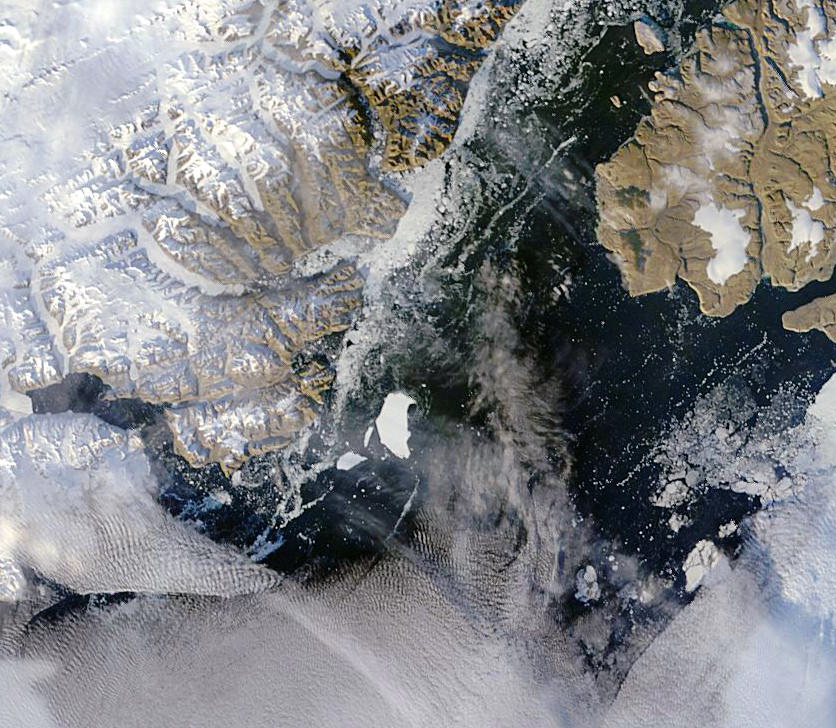
An “ice island” that calved from the Petermann Glacier in July is seen by NASA satellite (MODIS/Terra)
Remember that enormous slab of ice that broke off Greenland’s Petermann Glacier back in July? It’s now on its way out to sea, a little bit smaller than it was a couple of months ago — but not much. At around 10 miles long and 4.6 miles across (16.25 x 7.5 km) this ice island is actually a bit shorter than Manhattan, but is fully twice as wide.
The image above was acquired on September 14 by the Moderate Resolution Imaging Spectroradiometer (MODIS) aboard NASA’s Terra satellite.
Although the calving of this particular ice island isn’t thought to be a direct result of increasing global temperatures, climate change is thought to be a major factor in this year’s drop in Arctic sea ice extent, which is now below 4.00 million square kilometers (1.54 million square miles). Compared to September conditions in the 1980s and 1990s, this represents a 45% reduction in the area of the Arctic covered by sea ice.
Arctic sea ice extent data for June-July 2012 (NSIDC)
This year sea ice in the Arctic Ocean dropped below the previous all-time record, set in 2007. 2012 also marks the first time that there has been less than 4 million square kilometers (1.54 million square miles) of sea ice since satellite observations began in 1979.
The animation below, released today by the NOAA, shows the 2012 time-series of ice extent using data from the DMSP SSMI/S satellite sensor:
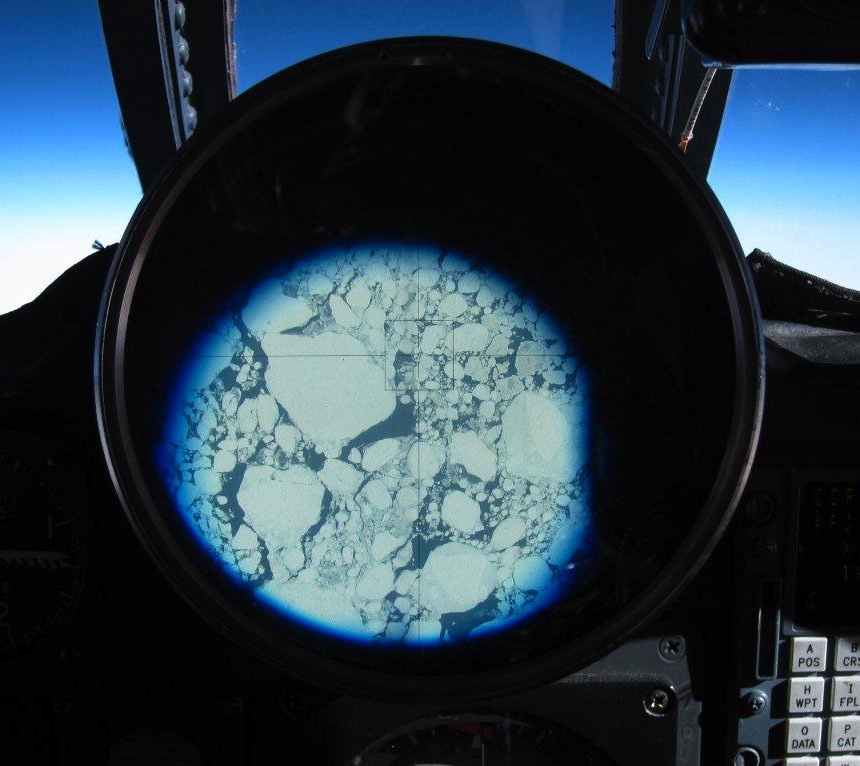
Greenland ice breakup seen from NASA ER-2 cockpit during a MABEL flight (NASA)
[/caption]
NASA researchers have just completed science mission flights over Greenland and the surrounding seas, gathering data on ice distribution and thickness with the MABEL (Multiple Altimeter Beam Experimental Lidar) laser altimeter instrument mounted in the nose of an ER-2 aircraft. WIth MABEL’s unprecedented ability to detect individual photons, researchers will be able to even more accurately determine how Arctic ice sheets are behaving in today’s changing climate.
At the same time, news has come in from researchers with the University of Washington, who have completed a NASA- and NSF-funded study of the enormous island’s glaciers spanning a ten-year period. What they have found is that the glaciers have been increasing in speed about 30% over the past ten years — which is actually less than earlier studies had anticipated.
“In some sense, this raises as many questions as it answers. It shows there’s a lot of variability,” said Ian Joughin, a glaciologist in the UW’s Applied Physics Laboratory and coauthor of the paper, published May 4 in Science.
Previous research had suggested that Greenland’s melting glaciers could contribute up to 19 inches to global sea level rise by 2100. But the behavior of Greenland’s vast ice fields and ocean-draining glaciers was not yet thoroughly researched. Based on this new study, the outlet glaciers have not sped up as much as expected.
Still, ocean-draining (a.k.a. marine-terminating) glaciers move much faster than their land-based counterparts, and the UW researchers have found that their speeds are increasing on average — up to 32% in some areas.
The team realizes that the study may just not have observed a long enough period of time. (These are glaciers, after all!)
Icebergs calve from the edge of Greenland's Gyldenlove glacier in April 2011. (NASA/GSFC/Michael Studinger)
“There’s the caveat that this 10-year time series is too short to really understand long-term behavior, so there still may be future events – tipping points – that could cause large increases in glacier speed to continue,” said Ian Howat, an assistant professor of earth sciences at Ohio State University and a co-author of the paper. “Or perhaps some of the big glaciers in the north of Greenland that haven’t yet exhibited any changes may begin to speed up, which would greatly increase the rate of sea level rise.”
What the researchers didn’t find was any evidence that the rate of flow is slowing down. Though the true extent of the effect of Greenland’s ice on future sea level rise may not be unerringly predictable down to the inch or centimeter, even at the currently observed rate a contribution of 4 or more inches by the end of the century is still very much a possibility.
Meanwhile, the data gathered from the MABEL science flights over the past four weeks will be used to calibrate NASA’s next-generation ice-observing satellite, IceSat-2, planned for launch in 2016. Once in orbit, IceSat-2 will provide even more detailed insight to the complex behavior of our planet’s ice sheets.
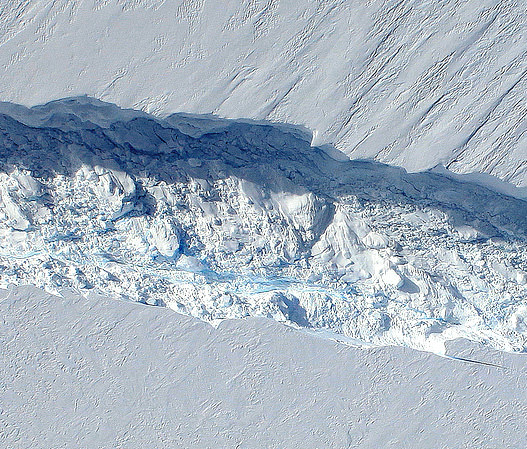
The 820-foot-wide crack in Antarctica's Pine Island Glacier, seen from DC-8 during Operation IceBridge (Credit: NASA/DMS)
Data collected from a NASA ice-watching satellite reveal that the vast ice shelves extending from the shores of western Antarctica are being eaten away from underneath by ocean currents, which have been growing warmer even faster than the air above.
The animation above shows the circulation of ocean currents around the western Antarctic ice shelves. The shelf thickness is indicated by the color; red is thicker (greater than 550 meters), while blue is thinner (less than 200 meters).
Launched in January 2003, NASA’s ICESat (Ice, Cloud and land Elevation Satellite) studied the changing mass and thickness of Antarctica’s ice from its location in polar orbit. An international research team used over 4.5 million surface height measurements collected by ICESat’s GLAS (Geoscience Laser Altimeter System) instrument from Oct. 2005 to 2008. They concluded that 20 of the 54 shelves studied — nearly half — were losing thickness from underneath.
[/caption]
Most of the melting ice shelves are located in west Antarctica, where the flow of inland glaciers to the sea has also been accelerating — an effect that can be compounded by thinning ice shelves which, when grounded to the offshore seabed, serve as dams to hold glaciers back.
Melting of ice by ocean currents can occur even when air temperature remains cold, maintaining a steady process of ice loss — and eventually increased sea level rise.
“We can lose an awful lot of ice to the sea without ever having summers warm enough to make the snow on top of the glaciers melt,” said Hamish Pritchard of the British Antarctic Survey in Cambridge and the study’s lead author . “The oceans can do all the work from below.”
The study also found that Antarctica’s winds are shifting in response to climate change.
“This has affected the strength and direction of ocean currents,” Pritchard said. “As a result warm water is funnelled beneath the floating ice. These studies and our new results suggest Antarctica’s glaciers are responding rapidly to a changing climate.”
ICESat completed operations in 2010 and was decommissioned in August of that year. Its successor ICESat-2 is anticipated to launch in 2016.
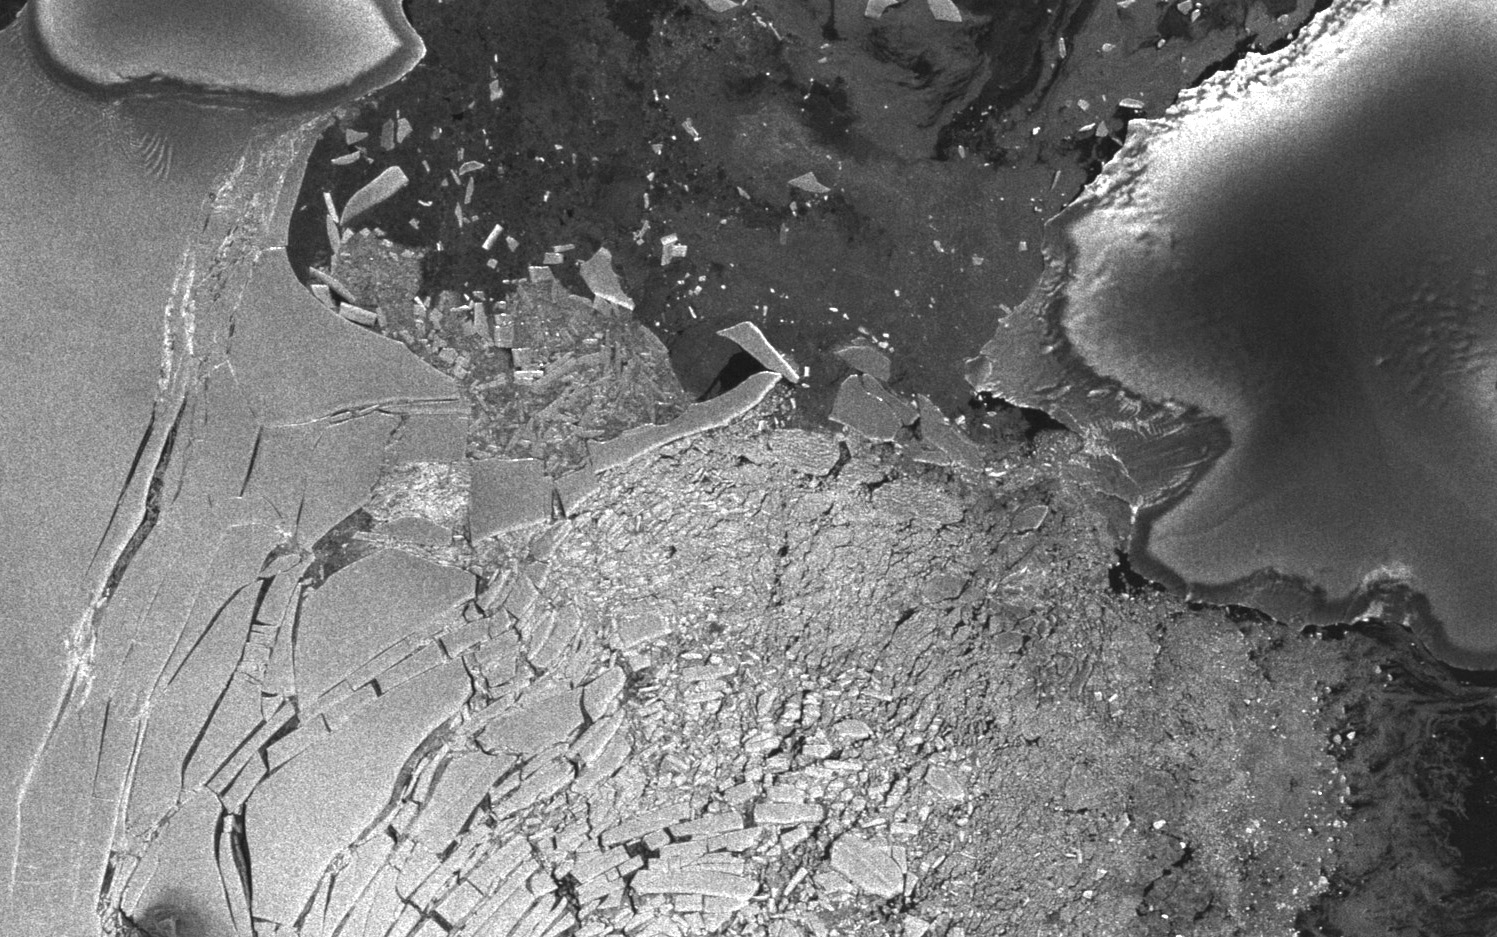
The disintegrated Wilkins Ice Shelf in April 2009. (Chelys/EOSnap)
[/caption]
A paper published in the journal Science in August 1981 made several projections regarding future climate change and anthropogenic global warming based on manmade CO2 emissions. As it turns out, the authors’ projections have proven to be rather accurate — and their future is now our present.
The paper, written by a team of atmospheric physicists led by the now-controversial James Hansen at NASA’s Institute for Space Studies at Goddard Space Flight Center, was recently rediscovered by researchers Geert Jan van Oldenborgh and Rein Haarsma from the Royal Netherlands Meteorological Institute (KNMI). Taking a break from research due to illness, the scientists got a chance to look back through some older, overlooked publications.
“It turns out to be a very interesting read,” they noted in their blog on RealClimate.org.
Even though the paper was given 10 pages in Science, it covers a lot of advanced topics related to climate — indicating the level of knowledge known about climate science even at that time.
“The concepts and conclusions have not changed all that much,” van Oldenborgh and Haarsma note. “Hansen et al clearly indicate what was well known (all of which still stands today) and what was uncertain.”
Within the paper, several graphs note the growth of atmospheric carbon dioxide, both naturally occurring and manmade, and projected a future rise based on the continued use of fossil fuels by humans. Van Oldenborgh and Haarsma overlaid data gathered by NASA and KNMI in recent years and found that the projections made by Hansen et al. were pretty much spot-on.
If anything, the 1981 projections were “optimistic”.
Data from the GISS Land-Ocean Temperature Index fit rather closely with the 1981 projection (van Oldenborgh and Haarsma)
Hansen wrote in the original paper:
“The global temperature rose by 0.2ºC between the middle 1960’s and 1980, yielding a warming of 0.4ºC in the past century. This temperature increase is consistent with the calculated greenhouse effect due to measured increases of atmospheric carbon dioxide. Variations of volcanic aerosols and possibly solar luminosity appear to be primary causes of observed fluctuations about the mean rend of increasing temperature. It is shown that the anthropogenic carbon dioxide warming should emerge from the noise level of natural climate variability by the end of the century, and there is a high probability of warming in the 1980’s. Potential effects on climate in the 21st century include the creation of drought-prone regions in North America and central Asia as part of a shifting of climate zones, erosion of the West Antarctic ice sheet with a consequent worldwide rise in sea level, and opening of the fabled Northwest Passage.”
Now here we are in 2012, looking down the barrel of the global warming gun Hansen and team had reported was there 31 years earlier. In fact, we’ve already seen most of the predicted effects take place.
The retreat of Pedersen Glacier in Alaska. Left: summer 1917. Right: summer 2005. Source: The Glacier Photograph Collection, National Snow and Ice Data Center/World Data Center for Glaciology.
And that’s not the only prediction that seems to have uncannily come true.
“In light of historical evidence that it takes several decades to complete a major change in fuel use, this makes large climate change almost inevitable,” Hansen et al wrote in anticipation of the difficulties of a global shift away from dependence on carbon dioxide-emitting fossil fuels.
“CO2 effects on climate may make full exploitation of coal resources undesirable,” the paper concludes. “An appropriate strategy may be to encourage energy conservation and develop alternative energy sources, while using fossil fuels as necessary during the next few decades.”
As the “next few decades” are now, for us, coming to a close, where do we stand on the encouragement of energy conservation and development on alternative energy sources? Sadly the outlook is not as promising as it should be, not given our level of abilities to monitor the intricate complexities of our planet’s climate and to develop new technologies. True advancement will rely on our acceptance that a change is in fact necessary… a hurdle that is proving to be the most difficult one to clear.
Read van Oldenborgh and Haarsma’s blog post here, and see the full 1981 paper “Climate Impact of Increasing Carbon Dioxide” here. And for more news on our changing climate, visit NASA’s Global Climate Change site.
Tip of the anthropogenically-warmer hat to The Register.
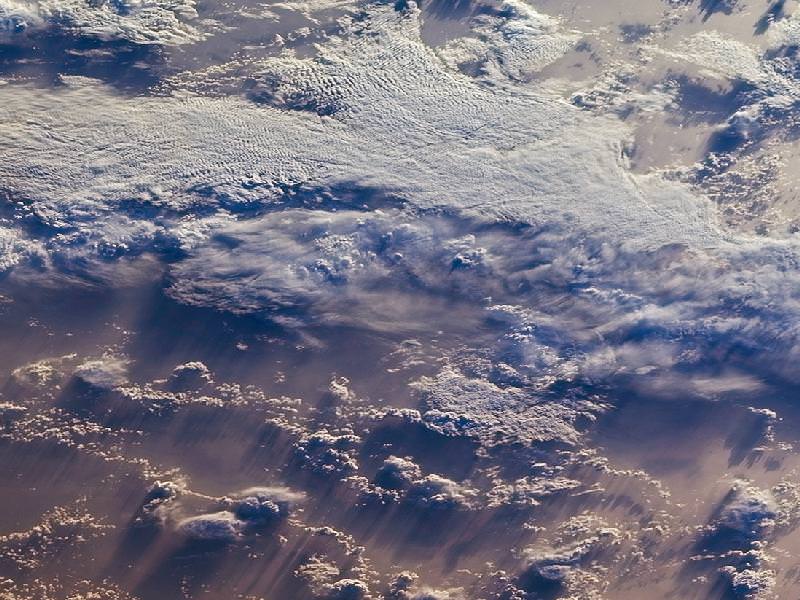
Clouds over the southern Indian Ocean, July 23, 2007. (NASA/JPL-Caltech)
[/caption]
Ok, maybe not the sky itself… but the clouds. According to recent research by climate scientists in New Zealand, global cloud heights have dropped.
Researchers at The University of Auckland have reported a decreasing trend in average global cloud heights from 2000 to 2010, based on data gathered by the Multi-angle Imaging SpectroRadiometer (MISR) on NASA’s Terra satellite. The change over the ten-year span was 30 to 40 meters (about 100 to 130 feet), and was mostly due to fewer clouds at higher altitudes.
It’s suspected that this may be indicative of some sort of atmospheric cooling mechanism in play that could help counteract global warming.
“This is the first time we have been able to accurately measure changes in global cloud height and, while the record is too short to be definitive, it provides just a hint that something quite important might be going on,” said lead researcher Professor Roger Davies.
A steady reduction in cloud heights could help the planet radiate heat into space, thus serving as a negative feedback in the global warming process. The exact cause of the drop in cloud altitude is not yet known, but it could reasonably be resulting from a change in circulation patterns that otherwise form high-altitude clouds.
Rendering of the Terra spacecraft. (NASA)
Cloud heights are just one of the many factors that affect climate, and until now have not been able to be measured globally over a long span of time.
“Clouds are one of the biggest uncertainties in our ability to predict future climate,” said Davies. “Cloud height is extremely difficult to model and therefore hasn’t been considered in models of future climate. For the first time we have been able to accurately measure the height of clouds on a global basis, and the challenge now will be to incorporate that information into climate models. It will provide a check on how well the models are doing, and may ultimately lead to better ones.”
While Terra data showed yearly variations in global cloud heights, the most extreme caused by El Niño and La Niña events in the Pacific, the overall trend for the years measured was a decrease.
Continuing research will be needed to determine future trends and how they may impact warming.
“If cloud heights come back up in the next ten years we would conclude that they are not slowing climate change,” Davies said. “But if they keep coming down it will be very significant.”
The team’s study was recently published in the journal Geophysical Research Letters.
Terra is a multi-national, multi-disciplinary mission involving partnerships with the aerospace agencies of Canada and Japan. An important part of NASA’s Science Mission, Terra is helping scientists around the world better understand and protect our home planet.
Titan and Dione seen on December 10, 2011 by the Cassini spacecraft. (NASA/JPL/SSI/J. Major)
[/caption]
It’s been said many times that the most Earthlike world in our solar system is not a planet at all, but rather Saturn’s moon Titan. At first it may not seem obvious why; being only a bit larger than the planet Mercury and coated in a thick opaque atmosphere containing methane and hydrocarbons, Titan sure doesn’t look like our home planet. But once it’s realized that this is the only moon known to even have a substantial atmosphere, and that atmosphere creates a hydrologic cycle on its surface that mimics Earth’s – complete with weather, rain, and gully-carving streams that feed liquid methane into enormous lakes – the similarities become more evident. Which, of course, is precisely why Titan continues to hold such fascination for scientists.
Now, researchers have identified yet another similarity between Saturn’s hazy moon and our own planet: Titan’s energy budget is in equilibrium, making it much more like Earth than the gas giant it orbits.
A team of researchers led by Liming Li of the Department of Earth and Atmospheric Sciences at the University of Houston in Texas has completed the first-ever investigation of the energy balance of Titan, using data acquired by telescopes and the Cassini spacecraft from 2004 to 2010.
Energy balance (or “budget”) refers to the radiation a planet or moon receives from the Sun versus what it puts out. Saturn, Jupiter and Neptune emit more energy than they receive, which indicates an internal energy source. Earth radiates about the same amount as it receives, so it is said to be in equilibrium… similar to what is now shown to be the case for Titan.
Blue hazes hover high above thicker orange clouds over Titan's south pole (NASA/JPL/SSI)
The energy absorption and reflection rates of a planet’s – or moon’s! – atmosphere are important clues to the state of its climate and weather. Different balances of energy or changes in those balances can indicate climate change – global cooling or global warming, for instance.
Of course, this doesn’t mean Titan is a balmy world. At nearly 300 degrees below zero (F) it has an environment that even the most extreme Earth-based life would find inhospitable. Although Titan’s atmosphere is ten times thicker than Earth’s its composition is very different, permitting easy passage of infrared radiation (a.k.a. “heat”) and thus exhibits an “anti-greenhouse” effect, unlike Earth or, on the opposite end of the scale, Venus.
Still, some stable process is in place on Saturn’s moon that allows for distribution of solar energy across its surface, within its atmosphere and back out into space. With results due in from Cassini from a flyby on Jan. 2, perhaps there will soon be even more clues as to what that may be.
The team’s report was published in the AGU’s Geophysical Research Letters on December 15, 2011. Li, L., et al. (2011), The global energy balance of Titan, Geophys. Res. Lett., 38, L23201, doi:10.1029/2011GL050053.
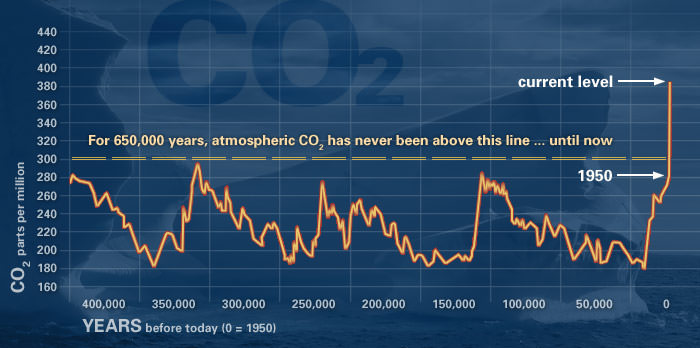
This graph, based on the comparison of atmospheric samples contained in ice cores and more recent direct measurements, provides evidence that atmospheric CO2 has increased since the Industrial Revolution. (Source: NOAA)
[/caption]
The body of evidence for climate change is strong and convincing, and multiple lines of evidence show the changes are caused largely by human activities. The consensus among scientists about the reality of the phenomenon is also convincing.
But from the nature of public discussions on the subject today – at least in the US – that consensus might not be apparent. And somehow the discussion has become a “debate,” which is often divided down political party lines.
“We have to make it clear that the ice sheets are not Republicans or Democrats – they don’t have a political agenda as they disappear,” said Michael Mann, a physicist at Pennsylvania State University, who has been at the recent forefront of climate research. “Certain facts cannot be denied. We have to find a way to steer the conversation to a good faith debate about what we can do about the problem, not this bad faith debate about the reality of it.”
Why has the public discourse become so polarizing and why is there a fair amount of legislators and the public who now think that climate change is an elaborate hoax?
Michael Mann, Professor Director, Earth System Science Center, Pennsylvania State University. Credit: PSU
Mann referred specifically to an infamous memo sent out by GOP political consultant Frank Luntz in 2002 to President George Bush, “which basically said that if the public comes to understand the reality of this problem they will demand policy action to deal with it,” Mann said, “and so you need to manufacture doubt and controversy and uncertainty and cultivate a set of scientists who can act for advocates essentially for fossil fuel industry. And that is what is happened.”
And the science became politicized. “If you can politicize something in today’s political environment,” Mann continued, “you can immediately get half the population on your side. Unfortunately the forces of anti-science — those who deny the science — have been very effective in politicizing the framing.”
Line plot of global mean land-ocean temperature index, 1880 to present, with the base period 1951-1980. The dotted black line is the annual mean and the solid red line is the five-year mean. The green bars show uncertainty estimates. Credit: NASA
But thousands of scientists from almost 200 countries around the world agreed on the most recent Intergovernmental Panel on Climate Change (IPCC) report which said most of the observed increases in global average temperatures is very likely due to the observed increase in anthropogenic greenhouse gas concentrations. Additionally, the US National Academy of Sciences, the National Academies of all the G-8 nations, the American Association for the Advancement of Science and several other scientific bodies have all issued equivalent statements of consensus of the reality of human-caused climate change.
“Certain facts cannot be denied because you don’t like the implications,” Mann said.
Mann is probably best known for known for his “hockey stick” reconstruction of past climate, (Nature, 1998) which shows the world is warmer now than it has been for at least 1000 years. The “hockey stick” has been attacked by climate change deniers, and while new research has better defined the data, it has not been disproven, nor is it the only line of evidence for global warming.
“The hockey stick is not ‘the’ pillar of evidence for the reality of climate change,” Mann said. “There are multiple pillars that include just the basic understanding of chemistry and physics. But it is one of the more visually compelling pieces of evidence for warming.”
The 'hockey stick' chart from the Intergovernmental Panel on Climate Change Third Assessment Report in 2001.
Mann conceded that various other studies and reconstructions of past climate data don’t agree entirely and that there are uncertainties of how much warming will continue because the predictions are based on models, which attempt to predict the future.
“There are legitimate uncertainties, but unfortunately the public discourse is so far removed from where the scientific discourse and controversies actually are, “Mann said. “There is not an uncertainty of the reality of climate change, that sea levels are going to rise, that arctic sea ice will be gone in a few decades or a whole lot of other areas, but we do have an uncertainty in our ability to project regional climate change.”
Mann said scientists don’t completely understand the El Nino and La Nina affects, how cloud feedback will influence the warming and other modeling issues.
However, Mann said, the science has improved over the past few years, and still, there is enough evidence for not just a hockey stick, but an entire hockey league.
“Every reconstruction reveals that the warming is indeed anomalous in a very long term context. Global temperatures are running the highest they have ever run. The twelve month running averages are warmer than they have ever been in documented history. There is no cooling of the globe and no decline to hide,” Mann said referring to the “Climategate” emails that were stolen from East Anglia climate research center and leaked just a few weeks before the Copenhagen climate summit in late 2009.
“Hackers stole thousands of emails –private correspondences between scientists,” said Mann, “and their words were cherry picked, taken out of context and distorted to make it sound like scientists were engaged in some sort of hoax.”
‘Hide the decline’ actually meant the scientists were going to remove unreliable tree-ring data, not cover up any decline in temperatures.
Mann said the real crime was the illegal theft of private correspondence, in addition to the moral crime of intentionally distorting what scientists believe and think.
Mann took his audience to task by saying, “I’d like to say the mainstream media recognized the manufactured controversy for what is was, but they didn’t, entirely.” He also admitted that scientists have not done all they could in the past to make the science clear and their words convincing.
But looking at the current political climate, Mann asked for journalists’ help in the future.
“No doubt we are in for a period of months or even years where climate science is likely to be subject to the sort of politically motivated inquisition that we haven’t seen, frankly, since the 1950’s,” he said. “It is necessary and important for the scientific community to do the best it I can to defend itself from this oncoming attack, and frankly, we are entirely reliant on the willingness of the mainstream media to serve in its role as the critical and independent arbiter and not just report the two sides of the so-called debate, but to actually establish what is fact and what is fiction. The scientists will not be successful against the attack that is coming unless the media is serving its role.”
Mann ended his talk with a picture of his daughter enthralled by a polar bear at a zoo. “I don’t want to have to tell my daughter that polar bears became extinct because we failed to counter a well funded effort to distract the public,” he said.
————————————
Note: For any reader who thinks they need to leave a comment to debate the climate change science, before posting, please take a look at the following information:
Earth's surface temperatures have mainly increased since 1880. Credit: NASA
[/caption]
A new NASA report says the past decade was the warmest ever on Earth, at least since modern temperature measurements began in 1880. The study analyzed global surface temperatures and also found that 2009 was the second-warmest year on record, again since modern temperature measurements began. Last year was only a small fraction of a degree cooler than 2005, the warmest yet, putting 2009 in a virtual tie with the other hottest years, which have all occurred since 1998. This annual surface temperature study is one that always generates considerable interest — and some controversy. Gavin Schmidt, a climatologist at NASA’s Goddard Institute for Space Studies (GISS) offered some context on this latest report, in an interview with the NASA Earth Science News Team.
NASA’s Earth Science News Team: Every year, some of the same questions come up about the temperature record. What are they?
Gavin Schmidt: First, do the annual rankings mean anything? Second, how should we interpret all of the changes from year to year — or inter-annual variability — the ups and downs that occur in the record over short time periods? Third, why does NASA GISS get a slightly different answer than the Met Office Hadley Centre does? Fourth, is GISS somehow cooking the books in its handling and analysis of the data?
NASA: 2009 just came in as tied as the 2nd warmest on record, which seems notable. What is the significance of the yearly temperature rankings? The map shows temperature changes for the last decade—January 2000 to December 2009—relative to the 1951-1980 mean. Credit: NASA
Gavin Schmidt: In fact, for any individual year, the ranking isn’t particularly meaningful. The difference between the second warmest and sixth warmest years, for example, is trivial. The media is always interested in the annual rankings, but whether it’s 2003, 2007, or 2009 that’s second warmest doesn’t really mean much because the difference between the years is so small. The rankings are more meaningful as you look at longer averages and decade-long trends.
NASA: Why does GISS get a different answer than the Met Office Hadley Centre [a UK climate research group that works jointly with the Climatic Research Unit at the University of East Anglia to perform an analysis of global temperatures]?
Gavin Schmidt: It’s mainly related to the way the weather station data is extrapolated. The Hadley Centre uses basically the same data sets as GISS, for example, but it doesn’t fill in large areas of the Arctic and Antarctic regions where fixed monitoring stations don’t exist. Instead of leaving those areas out from our analysis, you can use numbers from the nearest available stations, as long as they are within 1,200 kilometers. Overall, this gives the GISS product more complete coverage of the polar areas.
NASA: Some might hear the word “extrapolate” and conclude that you’re “making up” data. How would you reply to such criticism?
Gavin Schmidt: The assumption is simply that the Arctic Ocean as a whole is warming at the average of the stations around it. What people forget is that if you don’t put any values in for the areas where stations are sparse, then when you go to calculate the global mean, you’re actually assuming that the Arctic is warming at the same rate as the global mean. So, either way you are making an assumption.
Which one of those is the better assumption? Given all the changes we’ve observed in the Arctic sea ice with satellites, we believe it’s better to assume the Arctic Ocean is changing at the same rate as the other stations around the Arctic. That’s given GISS a slightly larger warming, particularly in the last couple of years, relative to the Hadley Centre.
NASA: Many have noted that the winter has been particularly cold and snowy in some parts of the United States and elsewhere. Does this mean that climate change isn’t happening?
Gavin Schmidt: No, it doesn’t, though you can’t dismiss people’s concerns and questions about the fact that local temperatures have been cool. Just remember that there’s always going to be variability. That’s weather. As a result, some areas will still have occasionally cool temperatures — even record-breaking cool — as average temperatures are expected to continue to rise globally.
NASA: So what’s happening in the United States may be quite different than what’s happening in other areas of the world?
Gavin Schmidt: Yes, especially for short time periods. Keep in mind that that the contiguous United States represents just 1.5 percent of Earth’s surface.
NASA: GISS has been accused by critics of manipulating data. Has this changed the way that GISS handles its temperature data?
Gavin Schmidt: Indeed, there are people who believe that GISS uses its own private data or somehow massages the data to get the answer we want. That’s completely inaccurate. We do an analysis of the publicly available data that is collected by other groups. All of the data is available to the public for download, as are the computer programs used to analyze it. One of the reasons the GISS numbers are used and quoted so widely by scientists is that the process is completely open to outside scrutiny.
NASA: What about the meteorological stations? There have been suggestions that some of the stations are located in the wrong place, are using outdated instrumentation, etc.
Gavin Schmidt: Global weather services gather far more data than we need. To get the structure of the monthly or yearly anomalies over the United States, for example, you’d just need a handful of stations, but there are actually some 1,100 of them. You could throw out 50 percent of the station data or more, and you’d get basically the same answers. Individual stations do get old and break down, since they’re exposed to the elements, but this is just one of things that the NOAA has to deal with. One recent innovation is the set up of a climate reference network alongside the current stations so that they can look for potentially serious issues at the large scale – and they haven’t found any yet.