Sendai, Japan after the disaster. Satellite image courtesy of GeoEye.
[/caption]
Photos from the GeoEye satellite imaging company from before and after the March 11 earthquake and tsunami in Japan show sobering views from above of the disaster. Above is the town of Sendai, Japan after the quake, below is how it looked before catastrophe struck.
Arahama, Japan before the disaster. Satellite image courtesy of GeoEye.
See more below.
The Sendai Airport after the disaster. Satellite image courtesy of GeoEye.The Sendai Airport in August of 2010. Satellite image courtesy of GeoEye.Yuriage, Japan on March 12, 2011. Satellite image courtesy of GeoEye.Yuriage, Japan on April 4, 2010. Satellite image courtesy of GeoEye.Sendai, Japan on March 12, 2011. Satellite image courtesy of GeoEye.Sendai, Japan on April 4, 2010. Satellite image courtesy of GeoEye.Ishinomaki, Japan on March 12, 2011. Satellite image courtesy of GeoEye.Ishinomaki, Japan on April 4, 2010. Satellite image courtesy of GeoEye.
Below is an images from the MODIS Rapid Response System, which is producing twice-daily images of Japan in response to the disaster.
The Moderate Resolution Imaging Spectroradiometer (MODIS) on NASA’s Aqua satellite took the right image on Mar. 13, 2011, while the MODIS sensor on NASA’s Terra satellite took the left image on Feb 26, 2011. NASA images courtesy the MODIS Rapid Response Team at NASA GSFC.
These two images, from the MODIS instrument on NASA’s Aqua satellite from Mar. 13, 2011 on the right, and the the MODIS sensor on NASA’s Terra satellite from Feb. 26, 2011 on the left before the earthquake and tsunami. Both images were made with infrared and visible light to highlight the presence of water on the ground. Plant-covered land is bright green, bare earth is tan-pink, and snow is blue. The city of Sendai is brown.
At this level of detail, the flooding along the coastline is the most obvious sign of the destructive earthquake and tsunami that struck Japan on March 11. A bright orange-red spot near the city of Sendai is the thermal signature from a fire, also likely caused by the earthquake. The photo-like true-color version of the image shows a plume of black smoke extending east over the ocean.
The German Aerospace Center (Deutsches Zentrum fur Luft- und Raumfahrt; DLR) is responding through its Center for Satellite Based Crisis Information (Zentrum fur Satellitengestutzte Kriseninformation; ZKI), based at its site in Oberpfaffenhofen, and provided the image below.
Japan's Coastline Before and After the Tsunami These images show the effects of the tsunami on Japan's coastline. The image on the left was taken on Sept. 5, 2010; the image on the right was taken on March 12, 2011, one day after an earthquake and resulting tsunami struck the island nation. Image Credit: German Aerospace Center (DLR)/Rapid Eye
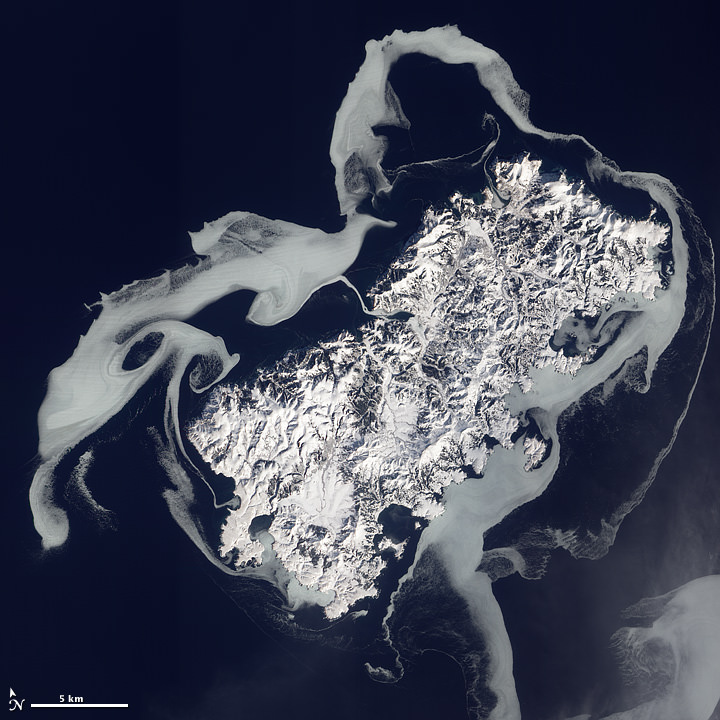
The volcanic island Ostrov Shikotan as seen by The Advanced Land Imager (ALI) on NASA’s Earth Observing-1 (EO-1) satellite.
[/caption]
Looking rather otherworldly, this haunting view of Shikotan-to island shows ghostly swirls of sea ice surrounding the snow-covered volcanic island. Also known as Ostrov Shikotan, this island is at the southern end of a volcanic archipelago called the Kuril Chain, which is part of the Pacific Ring of Fire. The chain stretches approximately 1,300 km (810 mi) northeast from Japan, off the coast of Russia. The Advanced Land Imager (ALI) on NASA’s Earth Observing-1 (EO-1) satellite captured this natural-color image of Shikotan on February 14, 2011.
When the ice around the island forms, it is shaped by the moving currents – giving it a swirly appearance. North of the western end of Shikotan, eddies have shaped the ice into rough circles.
The island’s rugged appearance comes from millions of years of volcanic and seismic activity, multiple tsunamis, and weathering from wind and rain. The total land area of Shikotan is 225 square km.
Although this island is a part of Russia, Japan maintains a claim to it as well. And although you wouldn’t guess it from this image, there are two different settlements of about 1,000 people each. The name of Shikotan derives from an ancient Japanese dialect and means “land with big communities.”
Here's an image from the top animation, the storm as seen on January 31, 2011
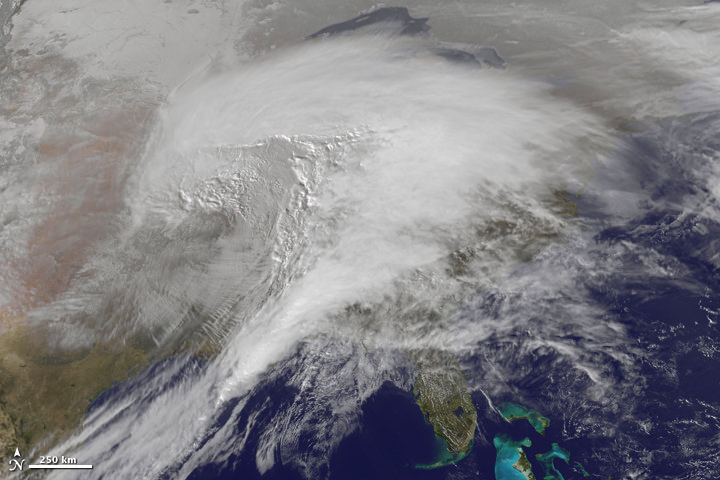
To speak in the vernacular of the peasantry, this storm was a whopper. Heavy snow, ice, freezing rain, and frigid wind battered about two thirds of the United States, making it “a winter storm of historic proportions,” said the National Weather Service. This animation—made with images from the NOAA-NASA GOES 13 satellite—shows the giant storm developing and moving across the country between January 31 and February 2. Below is another video view from GOES-East satellite, which includes infrared water vapor imagery from January 29 -February 1, 2011.
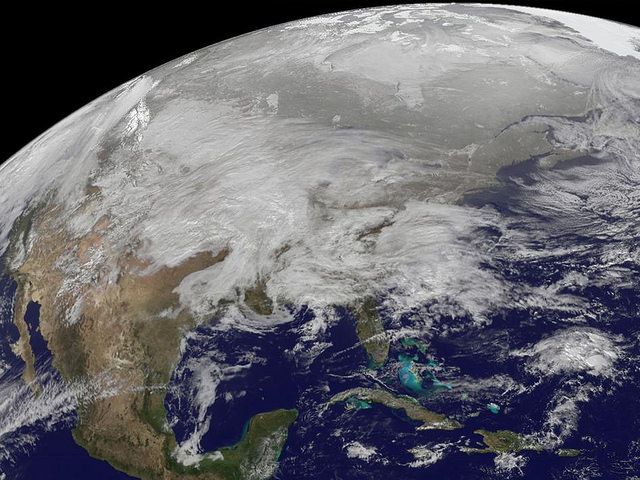
And there’s also an update on Cyclone Yasi.
[/caption]
Cyclone Yasi as seen on Feb. 1, 2011 from The Moderate Resolution Imaging Spectroradiometer (MODIS) on NASA’s Terra satellite
Yasi weakened after coming ashore early on Thursday morning but was still strong enough to produce high winds and tidal surges that sent waves crashing deep into seaside communities. Thankfully, so far no lives have been lost because of this storm. Officials said lives were saved because after days of dire warnings people heeded directions to flee to evacuation centers or bunker themselves at home. Track the storm on WeatherUnderground, and read more on the latest news from Yasi on The Guardian.
The GOES-13 satellite captured this image on Jan. 31, 2011 of a major winter storm covering a large portion of the US. Image Credit: NOAA/NASA GOES Project
[/caption]
The roads are a skating rink where I live! This visible image was captured by the GOES-13 satellite on January 31, 2011 and it shows the low pressure area bringing snowfall to the Midwest US. Heavy snow is expected today in portions of northern Iowa, southern Minnesota and Wisconsin. Snowfall from the system extends from Michigan west to Montana, Idaho, Utah and Arizona. A mix of rain and snow also stretches into the Ohio and Tennessee valleys, and it is all moving east. This system appears to be as large as 1/3rd of the Continental U.S.
Meanwhile, in another hemisphere on the other side of the world a huge tropical cyclone threatens parts of Australia that has already been suffering from flooding.
of Tropical Cyclone Yasi taken at 6:29 a.m. PST (9:29 a.m. EST) on Jan. 31, 2011. Areas colored purple represent the storm's coldest cloud-top temperatures and areas of heaviest precipitation. Image credit: NASA/JPL-Caltech
The northeastern Australian state of Queensland is now bracing for what could become one of the largest tropical cyclones the state has ever seen.
The Atmospheric Infrared Sounder (AIRS) instrument on NASA’s Aqua satellite captured this infrared image of Yasi on Jan. 31, 2011, at 6:29 a.m. PST (9:29 a.m. EST). The AIRS data create an accurate 3-D map of atmospheric temperature, water vapor and clouds, data that are useful to forecasters. The image shows the temperature of Yasi’s cloud tops or the surface of Earth in cloud-free regions.
The coldest cloud-top temperatures appear in purple, indicating towering cold clouds and heavy precipitation. The infrared signal of AIRS does not penetrate through clouds. Where there are no clouds, AIRS reads the infrared signal from the surface of the ocean waters, revealing warmer temperatures in orange and red.
At the approximate time this image was taken, Yasi had maximum sustained winds near 90 knots (166 kilometers per hour, or 103 mph), equivalent to a Category Two hurricane on the Saffir-Simpson Scale. It was centered about 1,400 kilometers (875 miles) east of Cairns, Australia, moving west at about 19 knots per hour (35 kilometers per hour, or 22 mph). Cyclone-force winds extend out to 48 kilometers (30 miles) from the center.
Yasi is forecast to move west, then southwestward, into an area of low vertical wind shear (strong wind shear can weaken a storm). Forecasters at the Joint Typhoon Warning Center expect Yasi to continue to strengthen over the next 36 hours. The Center forecasts a landfall just south of Cairns as a large 100-plus knot-per-hour (185 kilometers per hour, or 115 mph) system by around midnight local time on Wednesday, Feb. 2.
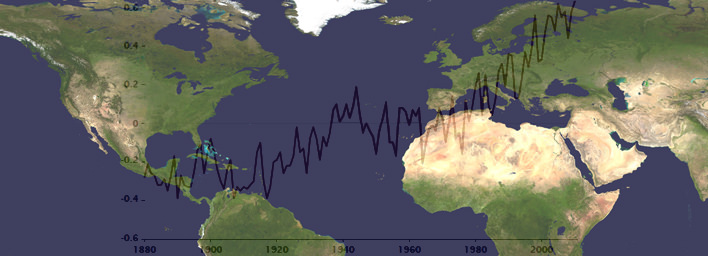
World map with global temperature changes from 1880 to 2010. Credit: NASA GISS
[/caption]
Newly released scientific data shows that 2010 equals 2005 as the Earths warmest year on record over the last 131 years, say researchers from NOAA and NASA. Temperature measurements from instrumented monitoring stations date back to 1880.
The past decade from 2001 to 2010 was the warmest on record and includes 9 of the 10 hottest years. A NOAA ranking of the 15 hottest years globally shows they all occurred in the last 15 years since 1995.
2010 was the 34th consecutive year with global temperatures above the 20th century average of 57.0 F (13.9°C), according to NOAA data. 1976 was the last year with a below average global temperature. Updated.
Global surface temperature anomalies for 2010. Credit: NOAA
Overall, the combined global land and ocean surface temperatures for 2010 and 2005 has risen 1.12 F (0.62 C) compared with the 20th century average, according to NOAA. The average global temperature in 2010 was 58.12 degrees compared to 57.0 F (13.9°C) as the average for all of 20th century. 2010 was also the wettest year on record.
The rise in Earths’ global temperature has been accompanied by a decline in arctic sea ice. Specifically, surface air temperatures in the arctic were warmer than normal during the summer of 2010. The sea ice extent measured in September 2010, was the 3rd lowest on record since accurate monitoring began in 1979, states NOAA in the annual Arctic report card. See Video below.
Scientists from NOAA’s National Climatic Data Center (NCDC) in Asheville, N.C. and NASA’s Goddard Institute for Space Studies (GISS) in New York City announced the findings on Jan 12. The temperature data are collected by weather stations that span across the globe.
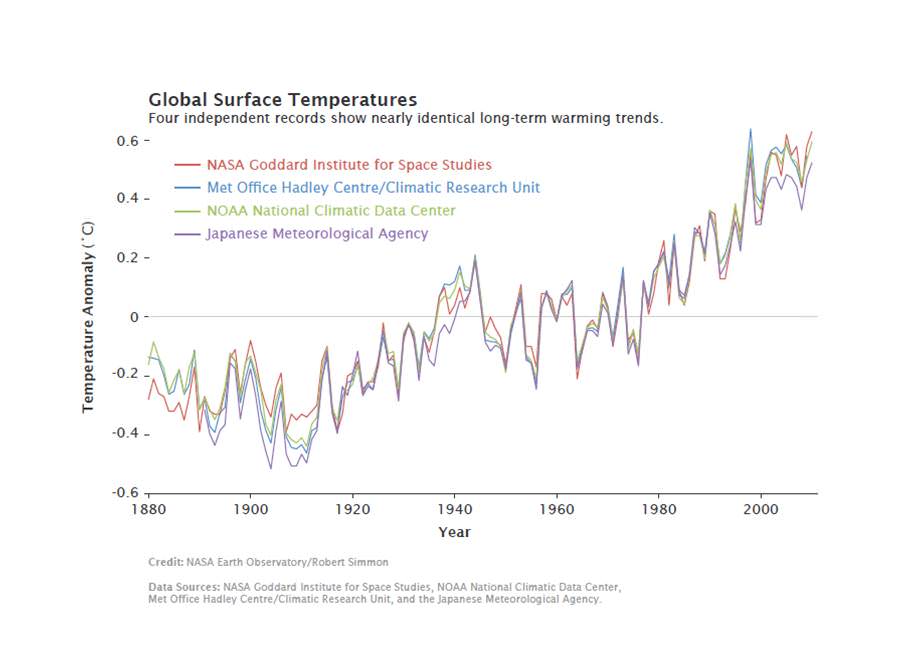
Global measurements by independent researchers in the UK at the Met Office Hadley Centre and at the Japanese Meteorological Agency closely match the trend of warming temperatures gathered by NOAA NCDC and NASA GISS.
The graphic below combines the actual temperature data collected independently by the four research agencies. The temperature trend lines are remarkably consistent.
Multiple institutions monitor global surface temperatures. Despite subtle differences in the ways the scientists perform their analyses, these four widely referenced records show remarkable agreement. Credit: NASA Earth Observatory/Robert Simmon
Much of the rise in global temperatures has taken place since the late 1970’s, says NASA. The rate of increase has been about 0.36 F per decade. The NASA GISS weather data were collected using over 1000 meteorological stations around the world, satellite observations of sea surface temperature and Antarctic research station measurements.
2010 average annual temperature ranks by state in the US. Credit: NOAA
The data are fed into a computer program which then calculates temperature anomalies — the difference between surface temperature in a given month and the average temperature for the same period during 1951 to 1980. NASA GISS uses that three-decade period as the baseline for analysis against which climate change can be tracked. NOAA uses the entire 20th century.
For the contiguous United States, NOAA analysis shows that “2010 was the 14th consecutive year with an annual temperature above the long-term average. Since 1895, the temperature across the US has increased at an average rate of approximately 0.12 F per decade.”
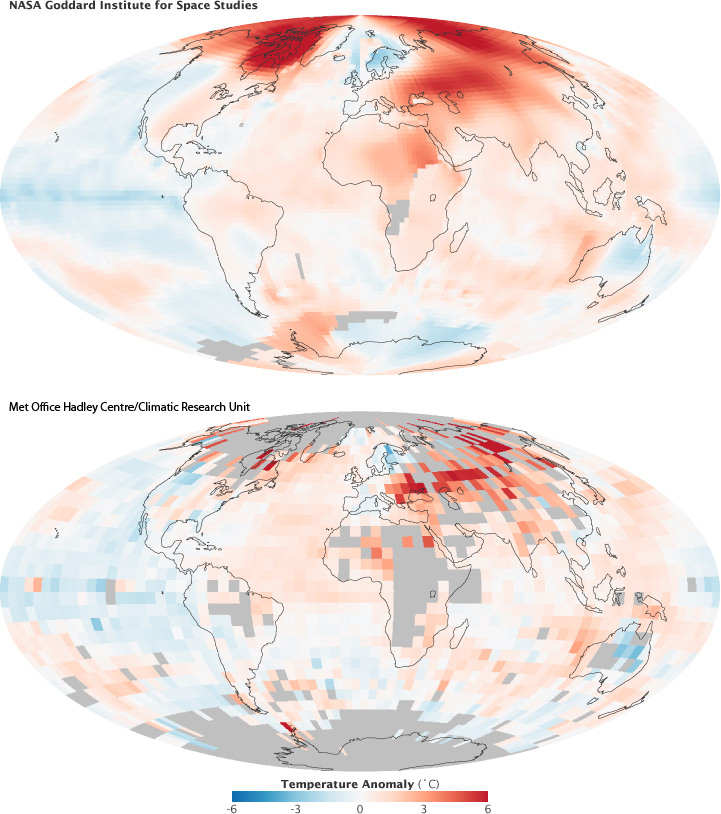
There are large areas in the Arctic without weather stations. NASA GISS approaches the problem by filling in gaps with data from the nearest land stations. The Climatic Research Unit at the University of East Anglia, which works jointly with the Met Office Hadley Centre, leaves much of the region out of its global temperature analysis. Credit: NASA Earth Observatory/Robert Simmon2010 Global Significant Weather and Climate Events. Credit: NOAA Global Temperatures.
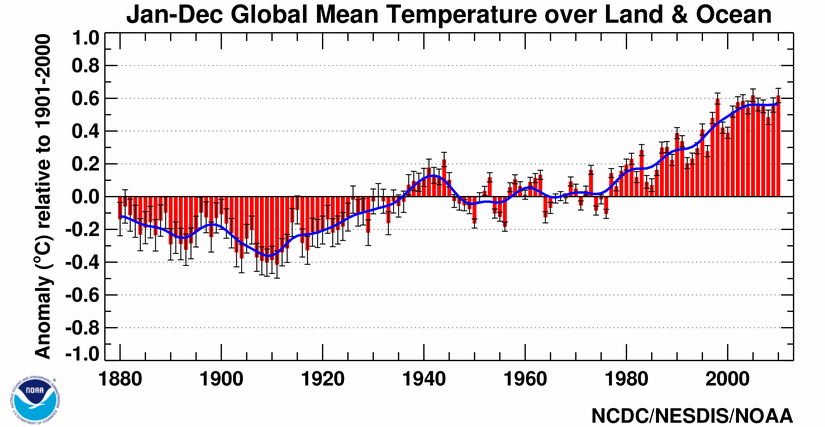
The year 2010 tied with 2005 as the warmest year since records began in 1880. The annual global combined land and ocean surface temperature was 0.62°C (1.12°F) above the 20th century average. The range associated with this value is plus or minus 0.07°C (0.13°F). The 2010 combined land and ocean surface temperature in the Northern Hemisphere was also the warmest on record, while the combined land and ocean surface temperature in the Southern Hemisphere was the sixth warmest such period on record. Credit: NOAA
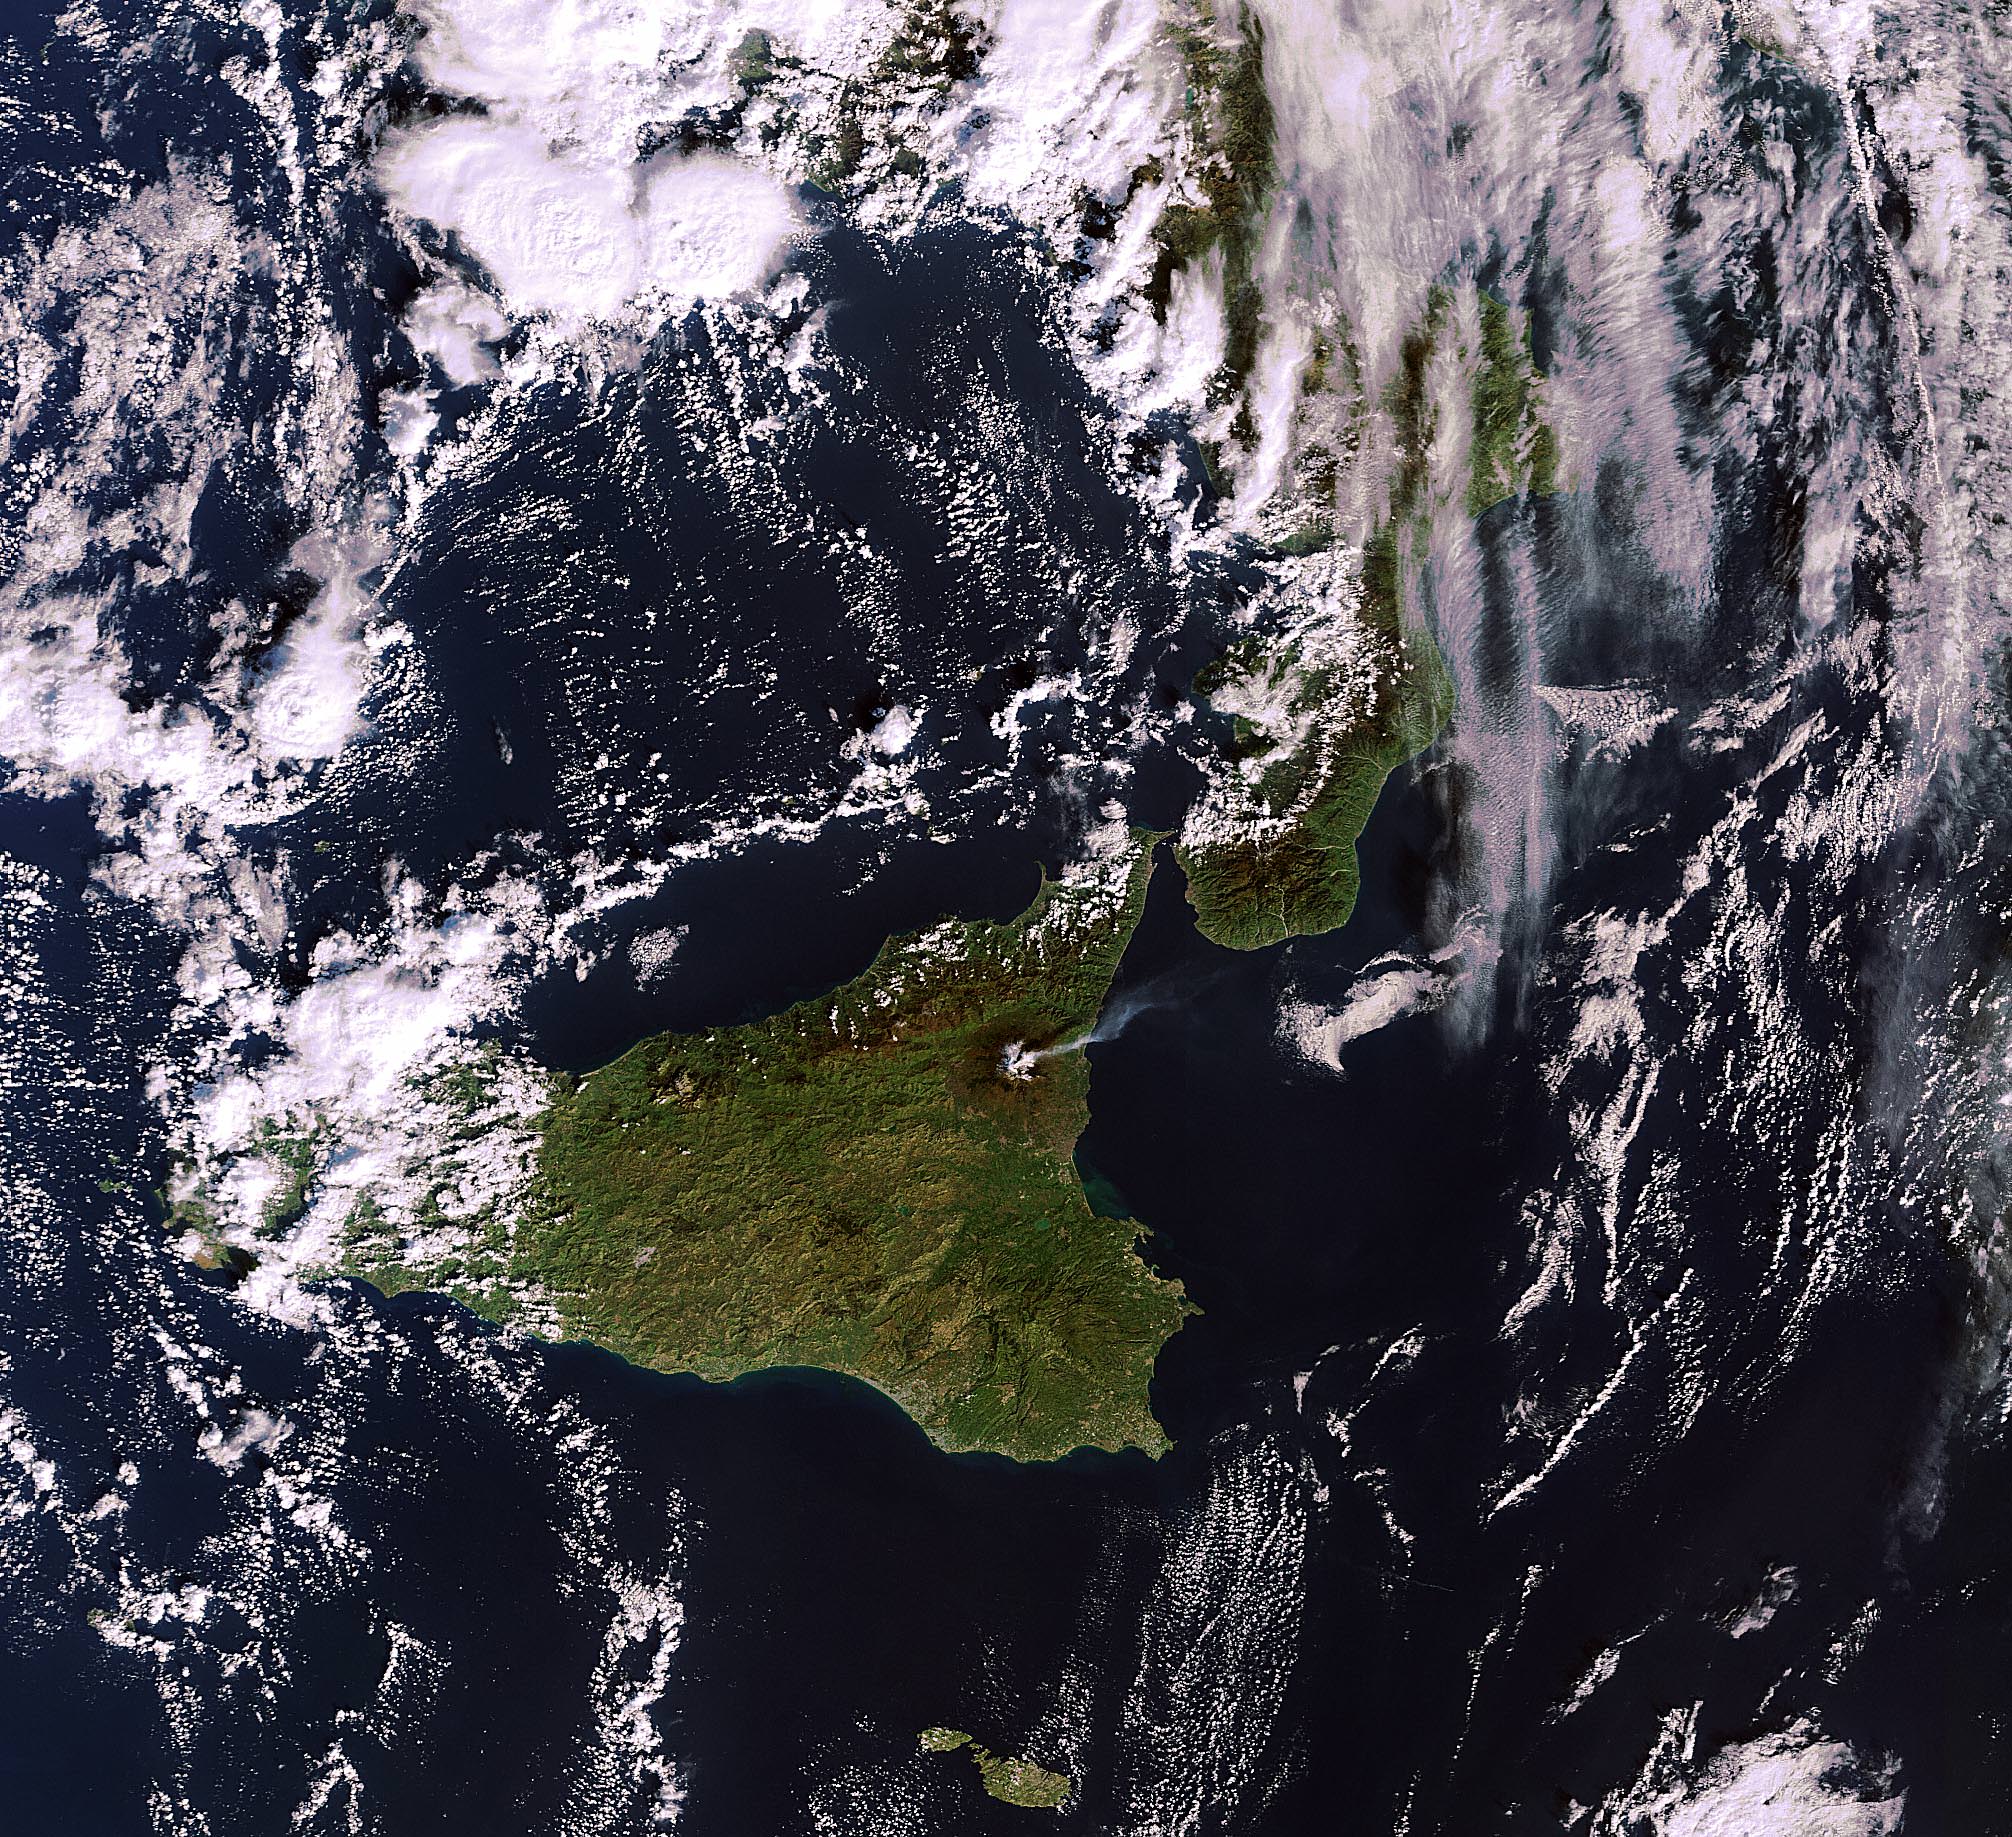
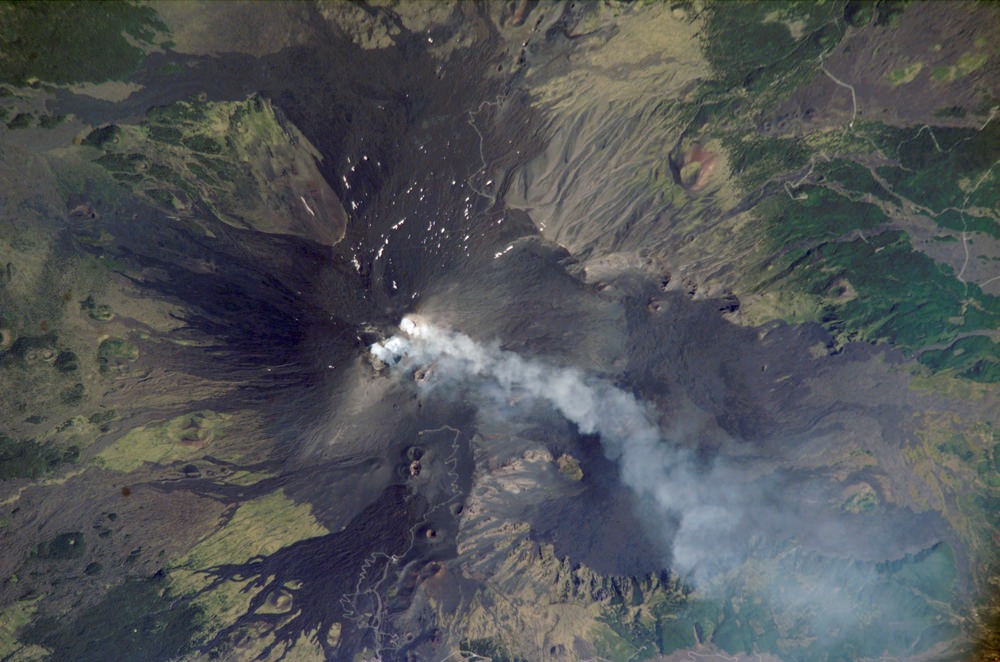
Volcanic eruptions at Mt. Etna from orbiting NASA Terra Satellite. Acquired on January 11, 2011. NASA Earth Observatory Image of the Day on January 15, 2011. Credit: NASA Terra Satellite
[/caption]
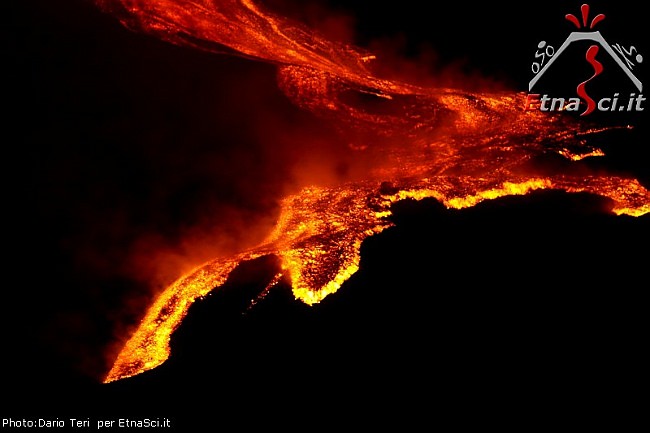
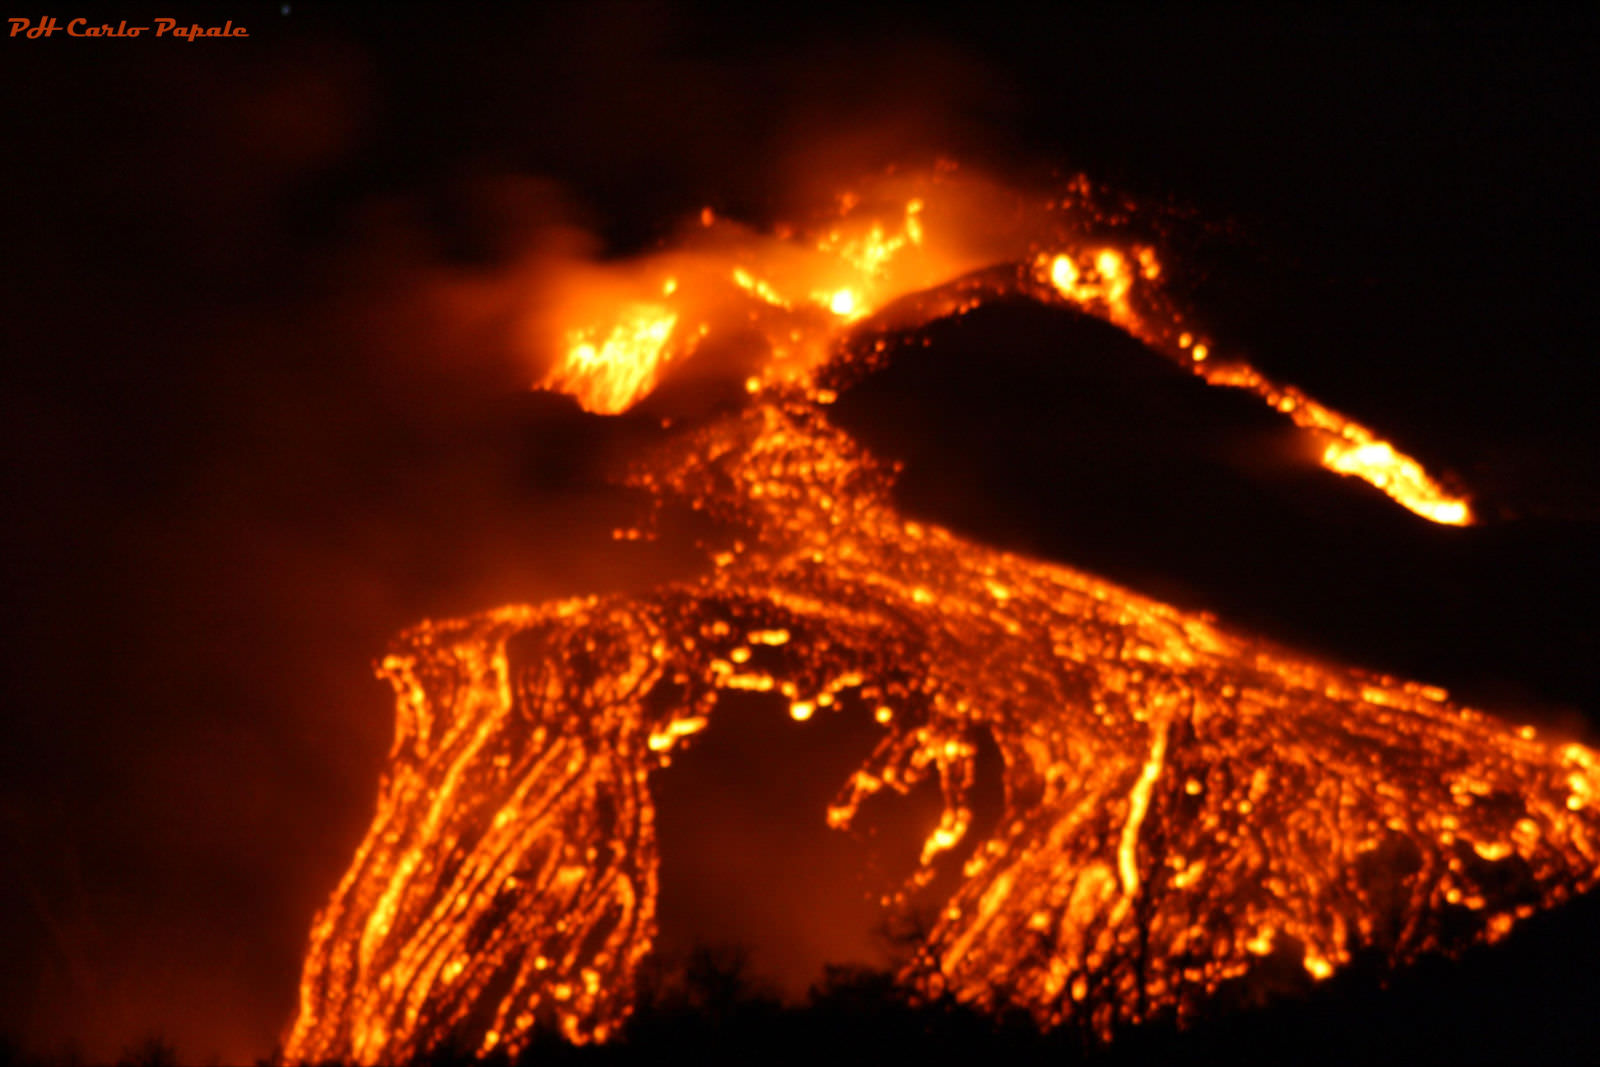
Spectacular eruptions from Mt Etna are spewing massive quantities of lava, smoke and ash many hundreds of meters high into the skies above the island of Sicily. Mt Etna is the most active volcano in Europe and one of the most active on all of Earth. The volcano rumbled to life again this week on the evening of January 12, 2011 and lit up the night sky. Mt Etna is 3350 meters high and located on the northeast coast of Sicily near the boot of Italy (see above, below).
Updated: comment or send me your Etna erupting photos/accounts to post below.
This fearsome natural wonder is providing an awe inspiring show from both Earth and Space. Local residents and lucky tourists nearby took stunning videos and photos (below) showing fountains of brilliant lava eruptions streaming mightily from the volcano.
This Envisat MERIS image, acquired on 11 January 2011, shows the plume of smoke billowing into the atmosphere from Mount Etna, Sicily, Italy. Activity gradually increased the following day, peaking in the evening. Credits: ESA
Click to Enlarge all images
Amazing photos from space were captured by Earth orbiting satellites from NASA and ESA. NASA’s Terra satellite took the above image on Jan. 11 as Mt Etna was spewing forth smoke or ash just prior to the volcanic eruptions on Jan. 12. The photo of Etna is NASA’s Earth Observatory Image of the Day, today, Jan. 15, 2011.
ESA’s Envisat likewise snapped a gorgeous view of the billowing plume of smoke rising to space (photo at left) and the international crew aboard the ISS, which currently includes Italian astronaut Paolo Nespoli. Perhaps he’ll send us a shot !
Local news and eyewitness accounts say that tremors from the volcano began increasing on Jan. 11. Emissions of volcanic gases and water vapor have been ongoing since late September 2010. The sounds of explosive tremors from deep inside were also detected months ago.
This sizzling hot video – “Etna at Maximum Activity” – is set to music and records the magnificent flowing streams of lava and the thunderous sounds of the crackling, explosive eruptions. Be sure to view at full screen, then just sit back and enjoy !
Plumes of volcanic ash from the eruptions spread across Sicily and forced the closure of the local Fontanarossa airport – nearby to the city of Catania, which is 24 kilometers away.
Rumblings of Mt Etna have been recorded in historical documents dating back to about 1500 BC.
Another short, dramatic video with the raw sounds of the eruption from a group of German tourists visiting the beautiful city of Taormina, Sicily
Eyewitness Description:
“Mount Etna erupted in the evening of January 12, 2011 for around four hours, providing an amazing scenery. We shot this unique video from Taormina on January 12, 2011 at 11.45 p.m. and uploaded it on YouTube.
On the evening of 11th January 2011 an increase in volcanic tremor was recorded at the summit of the volcano. The recorded seismic activity reached a peak at 7 a.m. on 12th January when the source moved from north of NE crater to the SE crater. The eruption started with strombolian explosive activity at SE crater at around 9.p.m. Lava overflowed the eastern rim of SE crater and fed a flow that moved toward the western wall of the Valle del Bove (Valley of the oxen), an ancient huge uninhabited depression on the NE side of the volcano.
The Sicilian communities near the volcano were not threatened by this latest fascinating eruption. Best place to watch the fascinating eruptions of Mount Etna is the town of Taormina, nestled on a hill at 220 meters / 722 feet above the sea level and at a safe linear distance of approx. 28 Km / 17,4 miles from the top craters of the Sicilian volcano.” Fearsome lava eruptions spewing from Mt Etna on Jan. 11, 2011
A few years back, I visited Mt Etna and was incredibly lucky to witness this spectacle of nature myself. It was an unforgettable experience to see the glowing red-orange colored lava flowing out from the bowels of the Earth. It was like a living being with circulating blood.
In the excitement, I did something that in retrospect was incredibly stupid. I stood on a ledge, perhaps 50 cm thick, right above the porthole of the scalding hot lava erupting from the earth beneath my feet. Many others did too.
Sicily is a lovely place of manmade and natural wonders. Don’t pass up an opportunity to see Etna aflame
Look at Etnaweb (in Italian, but Universal) for a fantastic collection of local photos and webcams of the eruption.
Volcanic eruptions are breathtaking events to behold. The residual plumes of smoke and ash can stay aloft for many years and can also effect how we see other astronomical events such as our view of solar and lunar eclipses.
For a more tranquil view of Earth and inspiration from Carl Sagan, click here
NASA’s Spirit robot is positioned next to an ancient and extinct volcanic feature on Mars. Learn more here
Can you envision a place hotter than Etna ? … A scorching, molten hellish world where the temperatures are unimaginably hot
Comment or send me your photos and eyewitness accounts of erupting Mt Etna
Signs of activity at the summit of Mount Etna, Europe’s most active volcano.
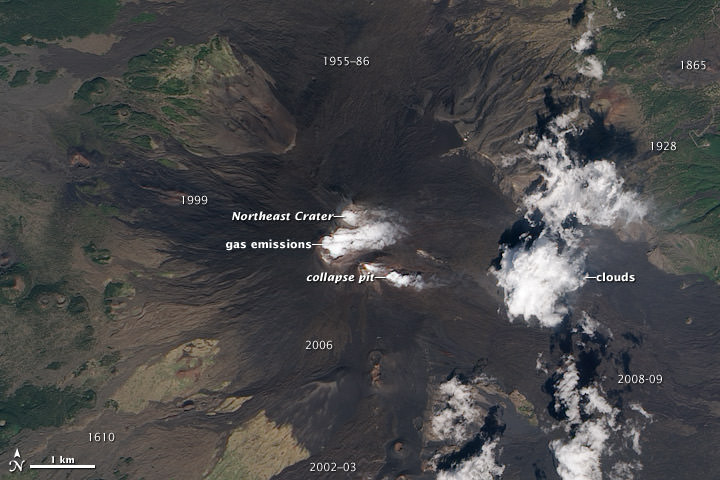
Water vapor and other volcanic gases overflow Etna’s summit craters, spilling out over the volcano’s upper slopes. A steam plume rises from a collapse pit that formed in late 2009, the newest volcanic feature on Etna. Dark lava flows from recent eruptions cover the peak, overlaying lighter, weathered flows from hundreds or thousands of years ago. (Numbers on the image indicate when a flow was erupted.) The oldest lavas are covered by green vegetation. Eruptive cones and fissures also dot the landscape. Frequent explosions deep within the Northeast Crater, which may presage an upcoming eruption, are audible at the summit. These explosions were occurring sporadically every few minutes, as recorded by nearby seismometers. This natural-color satellite image was acquired by the Advanced Land Imager (ALI) aboard (EO-1) on September 26, 2010.Mt Etna photographed by astronauts aboard the International Space Station on August, 2, 2006.
One of the most consistently active volcanoes in the world, Sicily’s Mount Etna has a historical record of eruptions dating back to 1500 BC. This astronaut photograph captures plumes of steam and possibly ash originating from summit craters on the mountain: the Northeast Crater and Central Crater, which includes two secondary craters (Voragine and Bocca Nuova). Locals heard explosions coming from the rim of the Northeast Crater on July 26, 2006, and the plumes shown in this image are likely a continuation of that activity. Credit: NASA.
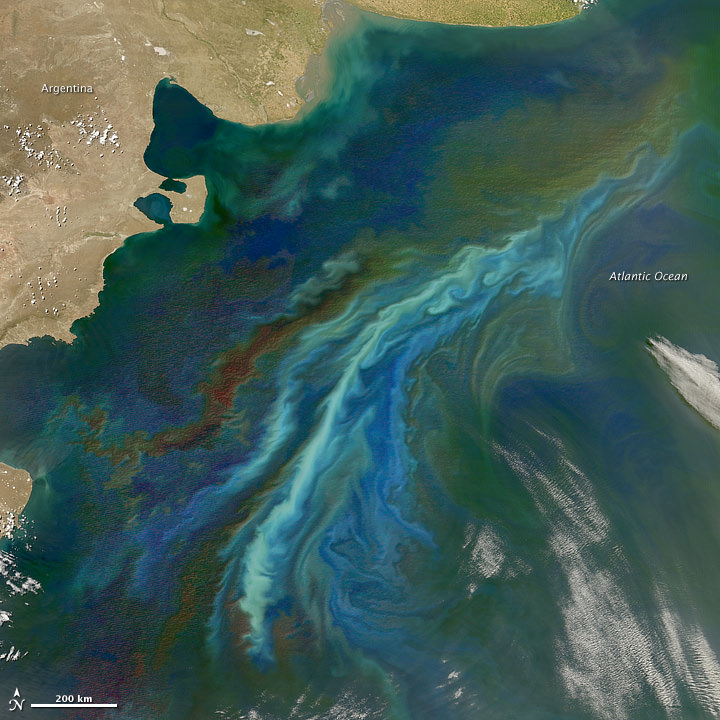
Phytoplankton bloom off of the Atlantic coast of Patagonia on December 21, 2010. NASA image created by Norman Kuring, Ocean Color Web. Instrument: Aqua - MODIS
[/caption]
The view from space of our home planet is often breathtaking and sobering. Lately, there has been a plethora of amazing images on NASA’s Earth Observatory website. Take the one above, for example. A swirling Van Gogh painting? No, phytoplankton blooming off of the Atlantic coast of Patagonia, and the swirls are created from two strong ocean currents stirring up a colorful brew of floating nutrients and microscopic plant life. Amazing that the tiny life joins together in huge assemblages that we can see from space. This image was taken on the southern hemisphere’s summer solstice on December 21, 2010. Scientists used seven separate different spectral bands to highlight the differences in the plankton communities across this swath of ocean.
Want more Earthly beauty? See below.
Tidal flats and channels in the Bahamas. Credit: NASA, astronaut photography from the ISS.
A giant dried rose laying across the ocean? No, this astronaut photograph provides a view of tidal flats and channels near Sandy Cay, on the western side of Long Island and along the eastern margin of the Great Bahama Bank. The continuously exposed parts of the island are brown, a result of soil formation and vegetation growth. To the north of Sandy Cay, an off-white tidal flat composed of carbonate sediments is visible; light blue-green regions indicate shallow water on the tidal flat. The tidal flow of seawater is concentrated through gaps in the land surface, leading to the formation of relatively deep channels that cut into the sediments. The channels and areas to the south of the island have a vivid blue color that indicates deeper water.
Antarctic icebergs. Credit: NASA; Instrument: EO-1 - ALI
While those of us in the northland have had long nights, Antarctica enjoys round-the-clock sunlight. The light arrives at a low angle, however, as the Sun makes a daily circuit around the horizon, and icebergs cast long shadows over the surrounding sea ice. This image, acquired on December 13, 2010, from the Advanced Land Imager (ALI) on NASA’s Earth Observing-1 (EO-1) satellite shows icebergs along the Princess Ragnhild Coast in East Antarctica. Besides distinguishing between icebergs and thinner ice, the low-angled Sun highlights the differences between the icebergs themselves.
The icebergs with rough surfaces likely broke off from the coast, far from this area, and spent time bobbing over the open ocean. Smooth icebergs likely originated in this area and have not yet traveled far.
On Monday, Dec. 27 at 1731 UTC (12:31 p.m. EST) the GOES-13 satellite captured this visible image of the powerful low pressure system that brought snows from Georgia to Maine along the US east coast. Some of the snowfall can be seen over South and North Carolina, Virginia, Maryland, Delaware, eastern Pennsylvania, New Jersey and southeastern New York. The clouds of the low obscure New England in the image. Credit: NOAA/NASA GOES Project
The Christmas Blizzard of 2010 dumped up to 30 inches of snow in the northeast United States, with winds gusts up to 60 mph. An Earth-orbiting satellite, GOES-13 captured a series of visible images of the storm, showing its progression. News reports from New York City say this is the sixth largest snowstorm in the city’s history and it buried the streets in four-foot drifts, bringing transit to a halt with cars and buses stranded in the streets.
Snowfall ranged from 1.5 inches in Atlanta, Georgia to more than two feet in various areas of New Jersey, New York and the New England states.
[/caption]
Some of those snows are visible in the above GOES-13 satellite image. Snowfall on the ground can be seen in the image over South and North Carolina, Virginia, Maryland, Delaware, eastern Pennsylvania, New Jersey, and southeastern New York. The clouds of the low obscure New England in the image.
Photographer Michael Black took an amazing timelapse of the blizzard, with a Canon DLSR on tripod with remote timer taking a photo once every five minutes (approximately 20 hours in 40 seconds.) — and obviously having to go outside and readjust the clock and markers.
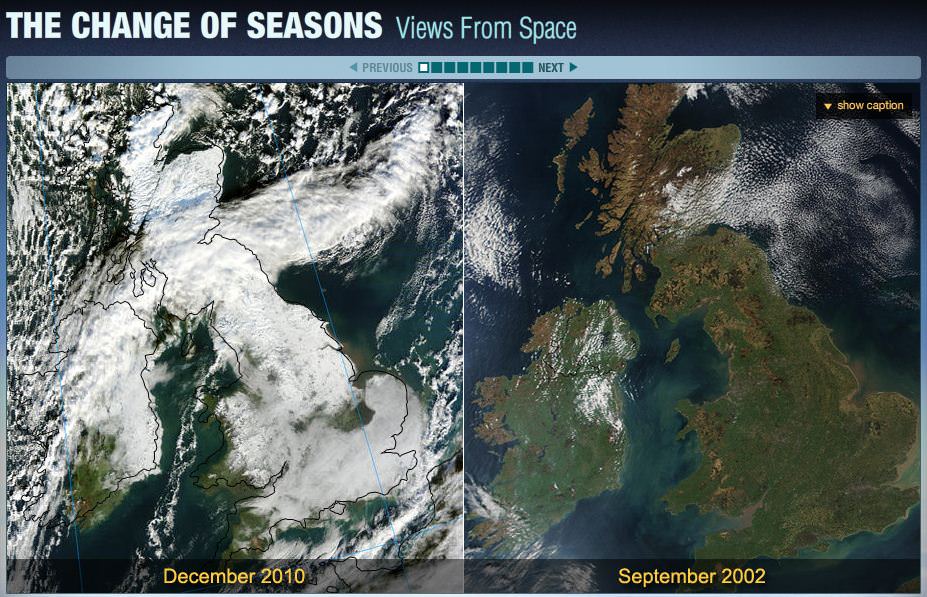
A new NASA webpage allows you to see – as well as share – the changing seasons here on Earth. From space, NASA satellites record the change of seasons, which scientists study regional patterns on Earth. These images also help show bigger changes that may occur over many years, and the slide show, “The Change of Seasons: Views from Space,” shows some of the ways seasonal change affects our planet, and invites you to share your own photos of seasonal change where you live.
Caused by the tilt of Earth’s axis relative to its orbital plane around the sun, seasons have profound changes on our weather and climate. When seasons change, nature reacts differently, depending on location. Temperatures change, rain or snow falls, rivers may flood, to name just a few effects. See the changes in action at the “Change of Seasons” webpage.
A window to the world on the International Space Station. Credit: NASA
[/caption]
A fish-eye camera view from the Cupola of the International Space Station shows a gorgeous view of Earth from space. Visible are parts of the Atlantic, Gulf of Mexico and Caribbean Sea, as well as the southern portion of the Florida peninsula, including the elongated metropolitan Miami area, Lake Okeechobee and the Florida Keys. This was taken by one of the Expedition 25 crew members on the ISS, from about 350 km (220 miles) above Earth. A 16mm f/2.8D lens gives this image a circular, fish-eye effect. Click on the image for access to higher-resolution versions,


 on NASA’s Aqua satellite took the right image on Mar. 13, 2011, while the MODIS sensor on NASA’s Terra satellite took the left image on Feb 26, 2011. NASA images courtesy the MODIS Rapid Response Team at NASA GSFC.")
/Rapid Eye")
 on NASA’s Terra satellite")
 on Jan. 31, 2011. Areas colored purple represent the storm's coldest cloud-top temperatures and areas of heaviest precipitation. Image credit: NASA/JPL-Caltech")