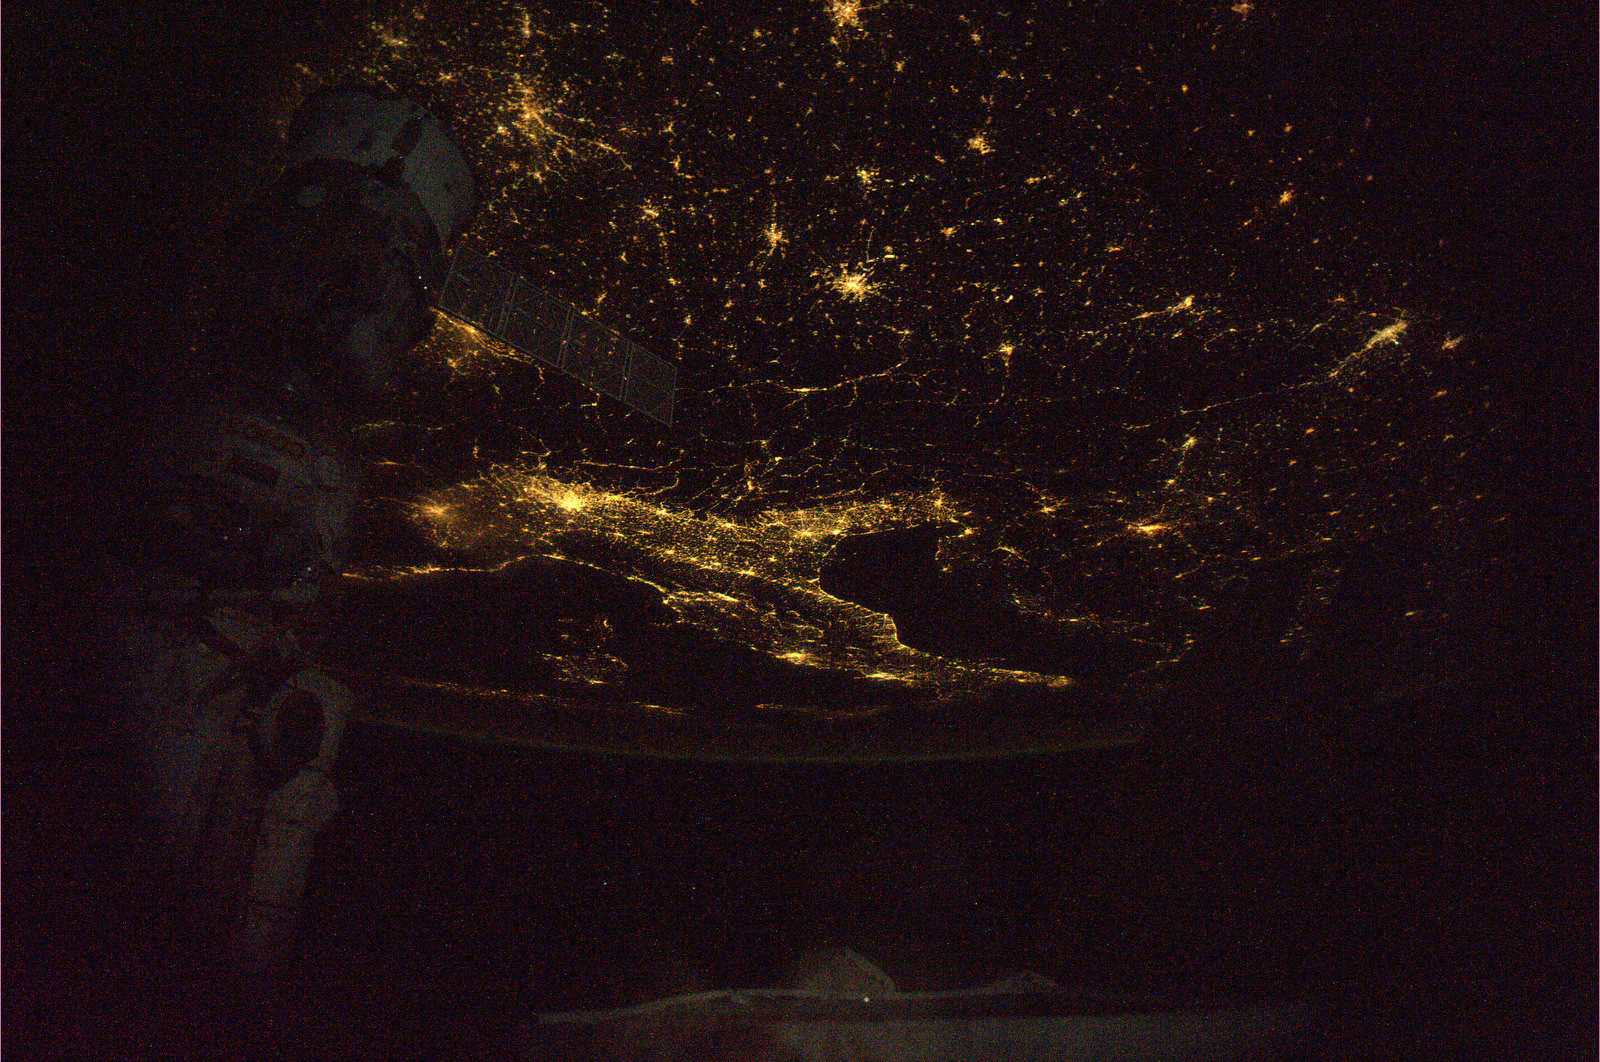
The first image from NASA's new geography trivia contest.
[/caption]
You can now test your knowledge of the world’s geography in a new trivia game on Twitter sponsored by NASA and the astronauts on board the International Space Station. It is kind of like our own “Where In the Universe Challenge” but strictly of images from Earth, and in this contest, there are even actual prizes. Astronaut Scott Kelly started the game this week, which is Geography Awareness Week. His vantage point is perfect for hosting the game, as where else can you get a better view of the various geographical features on our planet than from the International Space Station?
First of all, you have to be on Twitter, and follow Kelly: @StationCDRKelly. He’ll post a link to an image he took, and the first person to correctly identify the place depicted in his photos will win an autographed copy of the picture.
“Expanding our geography knowledge is essential to our economic well-being, our relationships with other nations and the environment,” Kelly said. “It helps us make sense of our world and allows us to make connections between people and places. Space exploration is a global endeavor, and the International Space Station is the result of these connections.”
The new trivia game is a way to engage the public in the activities of the ISS, and the pictures that Kelly, and other astronauts take from the station aren’t all just fun and games. “From the cupola, which is much like a bay window in a house, we are able to take pictures for many scientific reasons, but also to share with the public what we are learning about the planet on which we live,” Kelly said.
Kelly launched to the space station along with two Russian cosmonauts, Alexander Kaleri and Oleg Skripochka on Oct. 8. He is set to return to Earth March 16, 2011. The space station and its six crew members orbit the Earth more than a dozen times each day, traveling more than 320 km (200 miles) above Earth at 28,000 kph (17,500 mph).
Fire scars in Australia are featured in this image photographed by an Expedition 5 crewmember on the International Space Station (ISS). Bright orange fire scars show up the underlying dune sand in the Simpson Desert, Credit: NASA
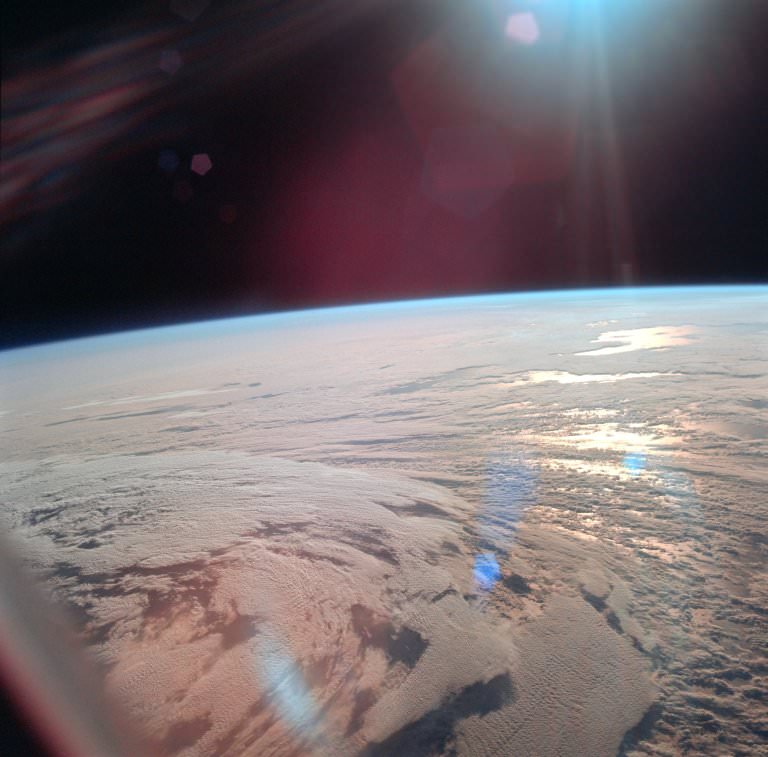
The International Space Station has been orbiting the Earth every day for over 10 years, and the astronauts all say their favorite pastime is looking at the Earth. During the past 10 years, the crews have taken some great pictures of our planet, and these images provide a unique look at our world. These are just a few of the spectacular views of Earth from the space station.
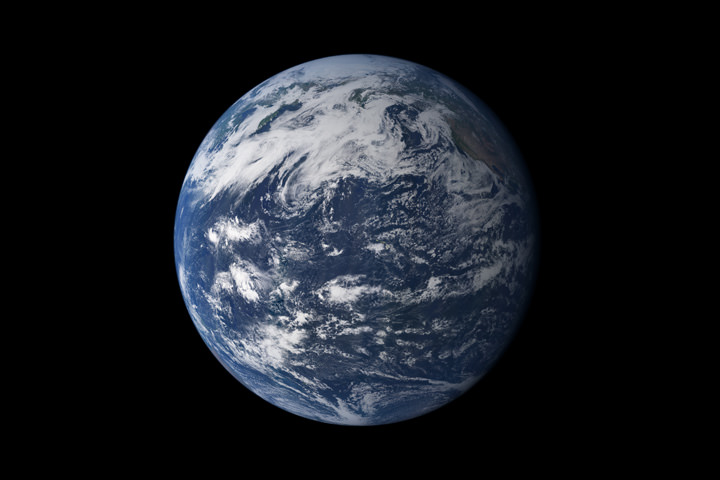
A new NASA image of Earth, by Robert Simmon and Marit Jentoft-Nilsen, based on MODIS data.
[/caption]
Despite recent news of potential habitable exoplanets and amazing images of Mars and the Saturn system returned from visiting spacecraft, the ol’ home planet is still about the most gorgeous-looking planetary body out there. We first saw it as a whole “blue marble” when the Apollo astronauts sent back pictures while circling the Moon, and it has been said that the original “Blue Marble” image taken by the Apollo 17 crew has been one of the most viewed and most influential images ever. But truth be told, that “Blue Marble” really wasn’t all that blue (see the original below). However, this new look at the home world shows how prevalent water really is. This composite image is based largely on observations from the Moderate Resolution Imaging Spectroradiometer (MODIS) on NASA’s Terra satellite.
It sure is pretty.
According to the NASA Earth Observatory website, Earth’s water content is about 1.39 billion cubic kilometers (331 million cubic miles), with the bulk of it, about 96.5%, being in the global oceans. As for the rest, approximately 1.7% is stored in the polar icecaps, glaciers, and permanent snow, and another 1.7% is stored in groundwater, lakes, rivers, streams, and soil. Only a thousandth of 1% of the water on Earth exists as water vapor in the atmosphere.
Here’s the original “Blue Marble,” the view of the Earth as seen by the Apollo 17 crew traveling toward the moon. This translunar coast photograph extends from the Mediterranean Sea area to the Antarctica south polar ice cap. This is the first time the Apollo trajectory made it possible to photograph the south polar ice cap. Almost the entire coastline of Africa is clearly visible. The Arabian Peninsula can be seen at the northeastern edge of Africa. The large island off the coast of Africa is Madagascar. The Asian mainland is on the horizon toward the northeast.
The original 'Blue Marble' taken by Apollo 17. Credit: NASA
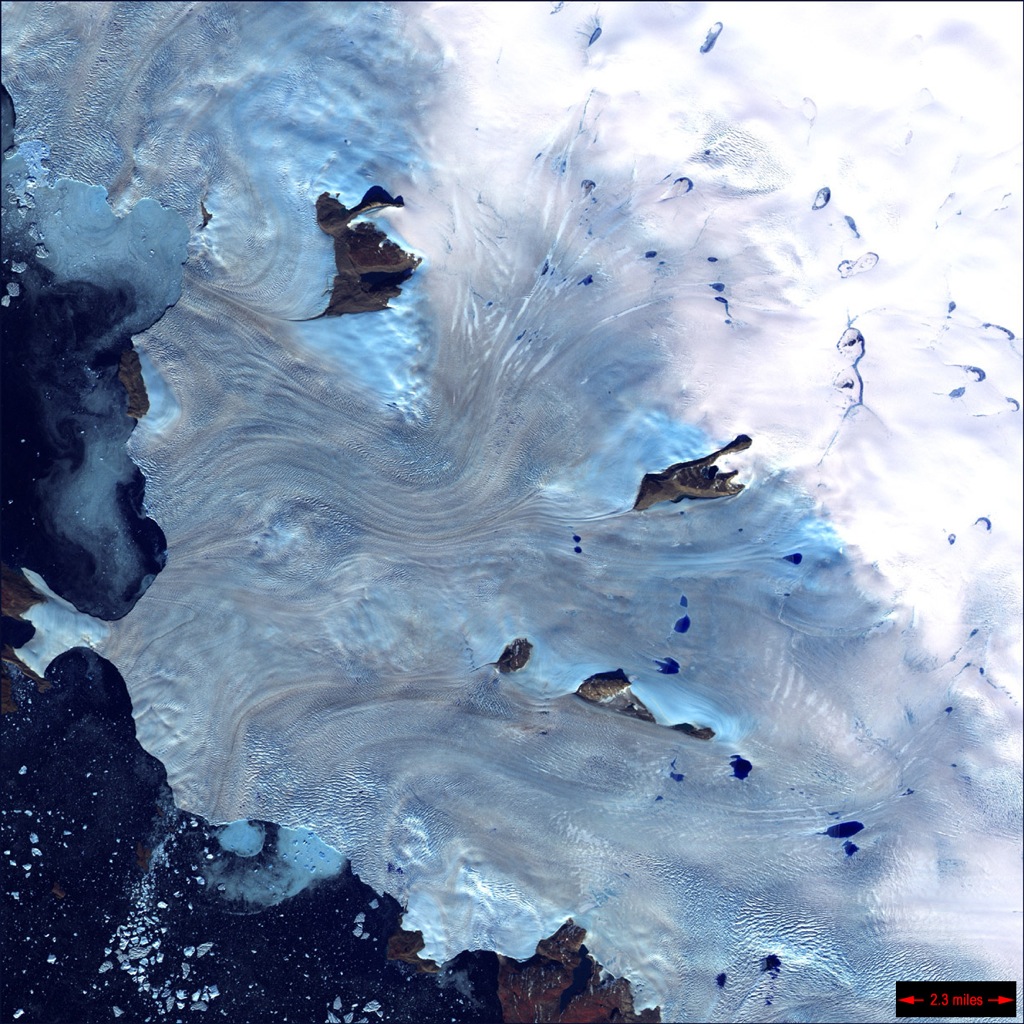
If you were asked what is the largest island in the world, what would you say? Australia maybe? Greenland is the worlds largest island. While Australia is an island, it is considered a continent. Greenland has an area of 2,166,086 square km, but a meager population of 56,452. The populations is over 85% Inuit. The remaining inhabitants are mainly Danish. The average annual temperature of Greenland varies between -9 to 7 °C.
Greenland is an autonomous country within the Kingdom of Denmark. Greenland is a group of islands and Greenland is the name of the largest, most populated one. Greenland has been inhabited on and off since 2500 BC. Denmark established rule in the 18th century. In 1979 Denmark granted home rule, in a relationship known as the Commonwealth of the Realm and in 2008 Greenland voted to transfer more powers to the local government. The Danish royal government is only in charge of foreign affairs, security, financial policy, and providing a subsidy to each citizen.
Greenland is bordered by the Atlantic Ocean to the southeast, the Greenland Sea to the east, the Artic Ocean to the north, and Baffin Bay to the west. The nearest countries to Greenland are Iceland to the east and Canada to the west. The country also contains the world’s largest national park. Scientists have thought for decades that the ice sheet covering the country may actually conceal three separate island land masses that have been bridged by glaciers over the last geologic cooling period.
The Greenland ice sheet covers 1,755,637 square km. It has a volume of 2,850,000 cubic km. Gunnbjorn Fjeld is the highest point on Greenland at 3,700 m. The majority of Greenland is less than 1,500 m in elevation. The weight of the ice sheet has formed a basin that is more than 300 m below sea level.
Between 1989 and 1993, climate researchers drilled into the summit of Greenland’s ice sheet, obtaining a pair of 3 km ice cores. Analysis of the layering and chemical composition of the cores has provided a revolutionary new record of climate change going back about 100,000 years. It illustrated that the world’s weather and temperature have often shifted rapidly from one stable state to another. The glaciers of Greenland are also contributing to a rise in the global sea level at a faster rate than was previously believed.
Greenland is fascinating and intimidating at the same time. To live there is a daily struggle against the elements that has forged a tough people.
When we think of clouds we think of those white cotton ball masses in the air. What we don’t really think about is what are clouds made of. We all know about the water cycle in some form. We know that clouds are created from the water that evaporates from various lakes, rivers, and oceans. We also know that at some time this evaporated water becomes rain and starts the cycle all over again.
However there are important questions about clouds we overlook. First, how are clouds visible if water vapor is normally supposed to be invisible like air or at least dissipate quickly after the first gush of steam? Second, why do clouds last so long in their different forms? Finally, what gives clouds their white or grey colors? As you can see there is a lot we take for granted in our understanding of clouds and how they are formed.
We know that clouds are made of water vapor, what we don’t know or at least forget is the important role that condensation plays in making clouds visible. For the most part water vapor is invisible. This is proven by the fact that the air we breathe regularly has some water vapor as part of its composition. However we don’t see it since its apart of the air. Condensation is what makes water vapor visible.
Basically high temperatures excite water molecules until they change from a liquid state to a gaseous one. However lower temperatures can cause enough water vapor to condense back into liquid form. This small amount stays as very small droplets that can stay suspended in the air mostly thanks to small dust particles that they attach themselves to.
It is pretty much the same way you see small bits of glitter suspended in clear glue. The drops are small enough to stay trapped in the air until condensation reaches a point of no return making rain. One result of this is that light becomes reflected and refracted. This is what makes clouds visible.
Now if you think about it we also just answered the second question about why clouds last so long. You may understand the first explanation because you can see your breath on a cold day. However after a while depending on the weather you notice that later in the day you can no longer see your breath. Clouds are visible because of colder temperatures in the upper atmosphere.
You have to remember that in the upper reaches of the atmosphere that the temperatures are much colder. This means that water vapor once condensed can no longer return fully to its gas state. Since temperatures don’t change in this region clouds are able to keep shape longer.
Finally, clouds have color. Some are white, some are grey, and in special circumstances such as major storms can have weird colors like green or red. This goes back to refraction. Most color that we can see is visible because are eyes perceive how objects absorb or reflect certain wavelengths of light. The white colors of clouds come from the condensed water vapor having a high reflective quality.
When all wavelengths of light are reflected back you see white. The grey color comes from seeing clouds from beneath. White clouds are white if you notice, on sunny days. This is because you can see the sunlight directly hitting them and see that light almost completely reflected back. On cloudy days most sunlight is blocked by the translucent and refractive quality of cloud cover. This makes clouds appear darker in color as part of the light has been uniformly absorbed.
We have written many articles about clouds for Universe Today. Here’s an article about the types of clouds, and here’s an article about cirrocumulus clouds.
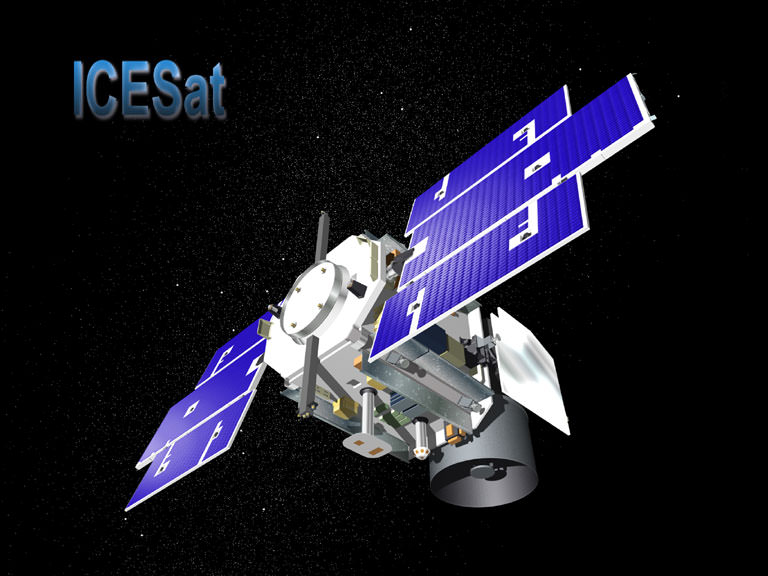
NASA’s Ice, Cloud, and land Elevation (ICESat) mission is now on ice, so to speak, or perhaps we should say, it ultimately became an inferno. The satellite was intentionally deorbited and burned up in the atmosphere on August 30, after completing a very productive seven-year scientific stint in orbit. And talk about the ultimate high-stakes, high-adventure, hands-on student project: students at the University of Colorado Boulder conducted the final maneuvers to send the spacecraft to its fiery death.
ICESat’s science mission ended in February 2010 when its primary instrument failed. NASA lowered the satellite’s orbit this summer and then decommissioned the spacecraft in preparation for re-entry. The satellite largely burned up, (NASA calculated that no more than 90 kg (200 pounds) of the ICESat’s original 900 kg (2,000 pounds) would survive re-entry) with pieces of debris falling into the Barents Sea, part of the Arctic Ocean north of Norway and Russia.
Originally a slated for 3 year mission, it continued for seven years and 15 laser-operations campaigns. While the GLAS instrument failed, the spacecraft itself remained in operating condition, so NASA could fire its thrusters to lower its orbit. This began in June, and reduced the lowest point of the spacecraft’s orbit to 125 miles (200 km) above Earth’s surface. The orbit then naturally decayed, but the final maneuvering was controlled by a group of students from the University of Colorado, working at the school’s Laboratory for Atmospheric and Space Physics (LASP). They sent it successfully plummeting through Earth’s atmosphere at just the right moment so that the satellite’s remains would land in the chilly – and uninhabited — seas north of Norway and Russia.
“They ran calculations to determine where the spacecraft was located,” said Darrin Osborne, flight director for ICESat.
The student operators provide a lower cost to NASA, and CU students at LASP receive hands-on training and experience that helps position them for a future in space-related careers.
“It’s amazing for an undergraduate like me to get hands-on experience controlling multimillion-dollar NASA satellites,” said third-year aerospace engineering sciences student Katelynn Finn, quoted in an article in The Register. ICESat orbital image. Credit: NASA
ICESat was launched in January, 2003, and was the first mission of its kind, designed to study Earth’s polar regions with a space-based laser altimeter called the Geoscience Laser Altimeter System, or GLAS. ICESat has helped in our understanding of ice sheet and sea ice dynamic, leading to scientific advances in measuring changes in the mass of the Greenland and Antarctic ice sheets, polar sea ice thickness, vegetation-canopy heights, and the heights of clouds and aerosols. Using ICESat data, scientists identified a network of lakes beneath the Antarctic ice sheet. ICESat introduced new capabilities, technology and methods such as the measurement of sea ice freeboard – or the amount of ice and snow that protrudes above the ocean surface – for estimating sea ice thickness.
A final eulogy for the satellite was offered by NASA’s Earth Science Mission Operations office: “The ICESat mission operations team is commended for its exceptional performance, working tirelessly for the past eleven years (four years of preparation and seven years of operations), overcoming several obstacles in the early years of the mission, and closing out the mission with a flawless series of orbital maneuvers before final decommissioning. The positive control maintained over the mission right to the end shows the quality and effort that went into designing, building, qualifying, launching, and operating a tremendously successful mission such as ICESat.”
This time lapse footage was taken by astronaut Don Pettit — of Saturday Morning Science and the Zero-G coffee cup fame — during his time on the International Space Station. It shows Earth from day to night and back to day again. Pettit was on the ISS from November 23, 2002 to May 3, 2003, so he was in space when the Columbia accident happened. Pettit is one of the most interesting and quirkier astronauts and I hope he gets to return to the ISS. is scheduled to return to the ISS in 2011 (thanks to Ben H. for clarifying — see comments). This video provides some great views of Earth, especially at night, that can’t be captured with a regular video shot. Stunning.
Can’t get enough of “Avatar?” Now, you can see James Cameron and scenes from the 3-D epic on NASA TV and elsewhere, promoting the many contributions of NASA’s Earth science program that helps enable exploration of our home planet, as well as making the public more environmentally aware. NASA has 14 science satellites in orbit making cutting-edge global observations of the entire global system including the atmosphere, oceans, land surface, snow and ice.
“When NASA ventures into space, it remembers to keep a steady eye on home,” Cameron said. “Its fleet of Earth-orbiting satellites constantly reveals our whole planet: its remotest places, its mysteries and the powerful influence of humans.”
The movie “Avatar,” depicts the fictional planet of Pandora and is coming back to theaters this week. The story centers on a beautiful planet threatened by forces that want to exploit its natural resources.
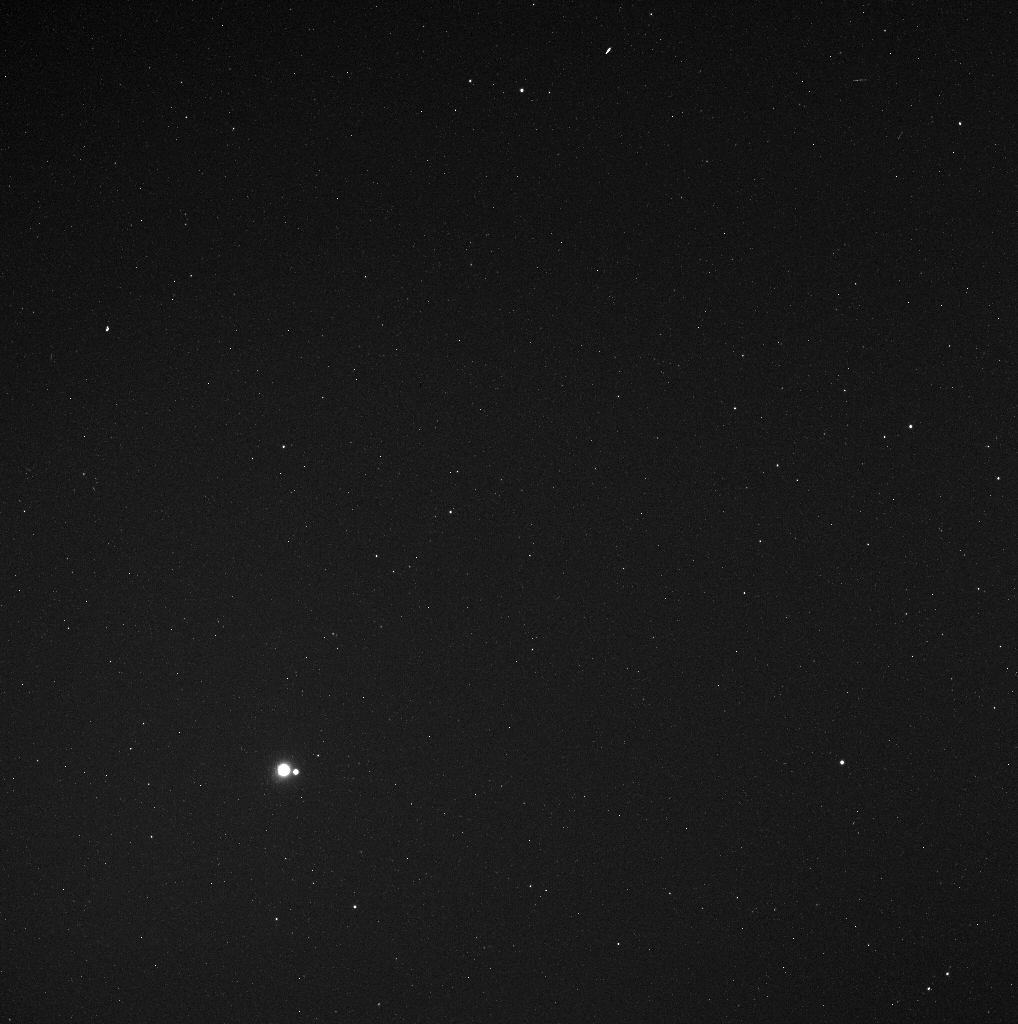
Earth and Moon from 114 Million Miles.Credit: NASA/Johns Hopkins University Applied Physics Laboratory/Carnegie Institution of Washington
[/caption]
A new image to add to the family photo album! The MESSENGER spacecraft is working its way to enter orbit around Mercury in March of 2011, and while wending its way, took this image of the Earth and Moon, visible in the lower left. When the image was taken in May 2010, MESSENGER was 183 million kilometers (114 million miles) away from Earth. For context, the average separation between the Earth and the Sun is about 150 million kilometers (93 million miles). It’s a thought provoking image (every one of us is in that image!), just like other Earth-Moon photos — Fraser put together a gallery of Earth-Moon images from other worlds, and this one will have to be added. But this image was taken not just for the aesthetics.
This image was taken as part of MESSENGER’s campaign to search for vulcanoids, small rocky objects hypothesized to exist in orbits between Mercury and the Sun. Though no vulcanoids have yet been detected, the MESSENGER spacecraft is in a unique position to look for smaller and fainter vulcanoids than has ever before been possible. MESSENGER’s vulcanoid searches occur near perihelion passages, when the spacecraft’s orbit brings it closest to the Sun. August 17, 2010 was another such perihelion, so if MESSENGER was successful in finding any tiny asteroids lurking close to the Sun, we may hear about it soon.
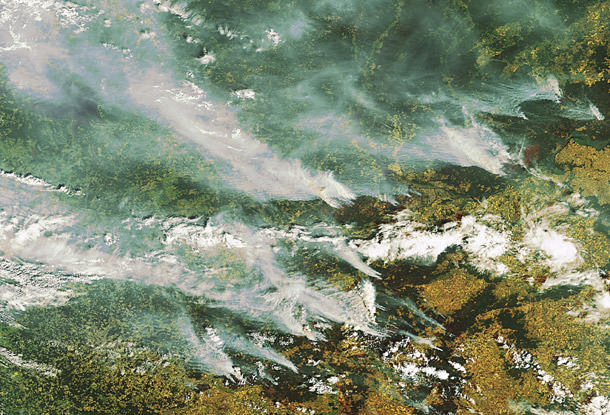
Wildfires in Russia as seen from space by ESA's Envisat satellite. Credit: ESA
[/caption]
Massive rains in Pakistan, China and Iowa in the US. Drought, heat and unprecedented fires in Russia and western Canada. 2010 is going down as the year of crazy, extreme weather. Is this just a wacky year or a trend of things to come? According to meteorologists, unusual holding patterns in the jet stream in the northern hemisphere are to blame for the extreme weather in Pakistan and Russia. But also, the World Meteorological Organization and other scientists say this type of weather fits patterns predicted by climate scientists, and could be the result of climate change.
“All these things are the kinds of things we would expect to happen as the planet warms up,” said Tom Wagner, a NASA scientist who studies the cryosphere, during an interview on CNN on August 11. “And we are seeing that the planet is warming about .35 degrees per decade. Places like Greenland are warming even faster, like 3.5 degrees per decade. And all these events from heat waves to stronger monsoons, to loss of ice are all consistent with that. Where it gets a little tricky is assigning any specific event to say, the cause of this event is definitely global warming, that is where we get to the edge of the research.”
“This weather is very unusual but there are always extremes every year,” said Andrew Watson from the University of East Anglia’s Environmental Studies. “We can never say that weather in a single year is unequivocal evidence of climate change, if you get many years of extreme weather then that can point to climate change.”
The Intergovernmental Panel on Climate Change (IPCC) has long predicted that rising global temperatures would produce more frequent and intense heat waves, and more severe rainfalls. In its 2007 report, the panel said these trends have already been observed, with an increase in heat waves since 1950, for example.
NOAA measurements show that the combined global surface temperatures for June 2010 are the warmest on record, and Wagner said there are larger conclusions to be drawn from the definite global warming trend. “We are seeing things that haven’t really happened before on the planet, like warming at this specific rate. We think it is very well tied to increasing carbon dioxide in the atmosphere since the late 1800’s caused by humans.”
This graph, based on the comparison of atmospheric samples contained in ice cores and more recent direct measurements, provides evidence that atmospheric CO2 has increased since the Industrial Revolution. (Source: NOAA)
“Not just over 10 years, but we have satellites images, weather station records and other good records going back to the late 1800’s that tells us all about how the planet is warming up,” Wagner said. “Not only that but we have evidence from geologic records, ice cores, and sediment cores from ocean cores. All of this feeds together to show us how the planet is changing.”
Asked if the cycle can be reversed, Wagner replied, “That is the million dollar question. One thing we have to think about is that the planet is changing and we have to deal with that. Ice around Antarctica and Greenland is melting. Sea level is rising right now at 3 millimeters a year. If you just extrapolate that to 100 years, it will rise to at least a foot of sea level rise. But there is the possibility it could be more than that. These are the types of things we need to think about and come up with mitigation strategies to deal with them. We’re doing the research to try and nail down these questions a little more tightly to see how much sea level is going to rise, how much temperatures are going to rise and how are weather patterns going to change.”
Reducing emissions is one thing that everyone can do to help protect the planet and the climate, and climate experts have been saying for years that there needs to be sharp cutbacks in emissions of carbon dioxide and other heat-trapping gases that go into the atmosphere from automobiles, power plants, and other fossil fuel-burning industrial and residential sources.
In the news this week was the huge ice chunk coming loose from a Greenland glacier. Not only is this an indication of warming water, but other problems could develop, such as the large ice chunks getting in the way of shipping lanes or heading towards oil rigs. The high temperatures and fires in Russia are affecting big percentage of the world’s wheat production, and could have an effect on our food supply this coming year.
Not only that, but the wildfires have created a noxious soup of air pollution that is affecting life far beyond just the local regions, JPL reports. Among the pollutants created by wildfires is carbon monoxide, a gas that can pose a variety of health risks at ground level. Carbon monoxide is also an ingredient in the production of ground-level ozone, which causes numerous respiratory problems. As the carbon monoxide from these wildfires is lofted into the atmosphere, it becomes caught in the lower bounds of the mid-latitude jet stream, which swiftly transports it around the globe.
Two movies were created using continuously updated data from the “Eyes on the Earth 3-D” feature, also on NASA’s global climate change website. They show three-day running averages of daily measurements of carbon monoxide present at an altitude of 5.5 kilometers (18,000) feet, along with its global transport.
And in case you are wondering, the recent solar flares have nothing to do with the wildfires — as Ian O’Neill from Discovery space deftly points out.

. Bright orange fire scars show up the underlying dune sand in the Simpson Desert,")


")