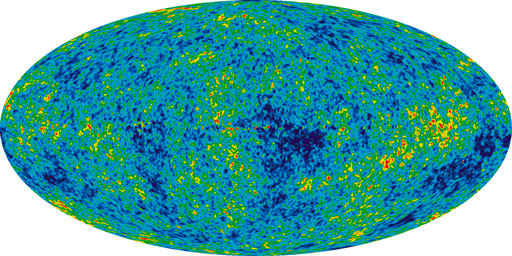
Seven Year Microwave Sky (Credit: NASA/WMAP Science Team)
[/caption]
The cosmological constant, symbol Λ (Greek capital lambda), was ‘invented’ by Einstein, not long after he published his theory of general relativity (GR). It appears on the left-hand side of the Einstein field equations.
Einstein added this term because he – along with all other astronomers and physicists of the time – thought the universe was static (the cosmological constant can make a universe filled with mass-energy static, neither expanding nor contracting). However, he very quickly realized that this wouldn’t work, because such a universe would be unstable … and quickly turn into one either expanding or contracting! Not long afterwards, Hubble (actually Vesto Slipher) discovered that the universe is, in fact, expanding, so the need for a cosmological constant went away.
Until 1998.
In that year, two teams of astronomers independently announced that distant Type Ia supernovae did not have the apparent luminosity they should, in a universe composed almost entirely of mass-energy in the form of baryons (ordinary matter) and cold dark matter.
Dark Energy had been discovered: dark energy is a form of mass-energy that has a constant density throughout the universe, and perhaps throughout time as well; counter-intuitively, it causes the expansion of the universe to accelerate (i.e. it acts kinda like anti-gravity). The most natural form of dark energy is the cosmological constant.
A great deal of research has gone into trying to discover if dark energy is, in fact, just the cosmological constant, or if it is quintessence, or something else. So far, results from observations of the CMB (by WMAP, mainly), of BAO (baryon acoustic oscillations, by extensive surveys of galaxies), and of high-redshift supernovae (by many teams) are consistent with dark energy being the cosmological constant.
So if the cosmological constant is (a) mass-energy (density), it can be expressed as kilograms (per cubic meter), can’t it? Yes, and the best estimate today is 7.3 x 10⁻²⁷ kg m 3.
But do the WMAP data really, truly, absolutely contain evidence of anomalies, things that just do not fit within the six-parameters-and-a-model the WMAP team recently reported?
In a word, no.
Seven Year Microwave Sky (Credit: NASA/WMAP Science Team)
Every second year since 2003 the WMAP science team has published a set of papers on their analyses of the cumulative data, and their findings (with the mission due to end later this year, their next set will, sadly, be their last). With time and experience – not to mention inputs from the thousands of other researchers who have picked over the data – the team has not only amassed a lot more data, but has also come to understand how WMAP operates far better. As a consequence, not only are the published results – such as limits on the nature of dark energy, and the number of different kinds of neutrinos – more stringent and robust, but the team has also become very au fait with the various anomalies reported.
For the first time, the team has examined these anomalies, in detail, and has concluded that the answer to the question, in their words, “are there potential deviations from ?CDM within the context of the allowed parameter ranges of the existing WMAP observations?” is “no”.
The reported anomalies the team examined are many – two prominent cold spots, strength of the quadrupole, lack of large angular scale CMB power, alignment of the quadrupole and octupole components, hemispherical or dipole power asymmetry, to name but a handful – but the reasons for the apparent anomalies are few.
“Human eyes and brains are excellent at detecting visual patterns, but poor at assessing probabilities. Features seen in the WMAP maps, such as the large Cold Spot I near the Galactic center region, can stand out as unusual. However, the likelihood of such features can not be discerned by visual inspection of our particular realization of the universe,” they write, and “Monte Carlo simulations are an invaluable way to determine the expected deviations within the ?CDM model. Claims of anomalies without Monte Carlo simulations are necessarily weak claims”.
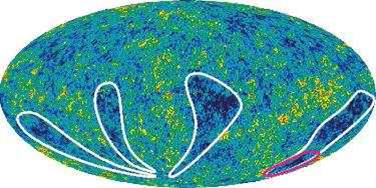
Stephen Hawking’s initials in the CMB (Credit: NASA/WMAP Science Team)
An amusing example: Stephen Hawking’s initials (“SH”) can be clearly seen in the WMAP sky map. “The “S” and “H” are in roughly the same font size and style, and both letters are aligned neatly along a line of fixed Galactic latitude,” the team says; “A calculation would show that the probability of this particular occurrence is vanishingly small. Yet, there is no case to made for a non-standard cosmology despite this extraordinarily low probability event,” they dryly note.
Many of the reports of WMAP CMB anomalies would likely make for good teaching material, as they illustrate well the many traps that you can so easily fall into when doing after-the-fact (a posteriori) statistical analyses. Or, as the team puts it in regard to the Stephen Hawking initials: “It is clear that the combined selection of looking for initials, these particular initials, and their alignment and location are all a posteriori choices. For a rich data set, as is the case with WMAP, there are a lot of data and a lot of ways of analyzing the data.”
And what happens when you have a lot of data? Low probability events are guaranteed to occur! “For example, it is not unexpected to find a 2? feature when analyzing a rich data set in a number of different ways. However, to assess whether a particular 2? feature is interesting, one is often tempted to narrow in on it to isolate its behavior. That process involves a posteriori choices that amplify the apparent significance of the feature.”
So, does the team conclude that all this anomaly hunting is a waste of effort? Absolutely not! I’ll quote from the team’s own conclusion: “The search for oddities in the data is essential for testing the model. The success of the model makes these searches even more important. A detection of any highly significant a posteriori feature could become a serious challenge for the model. The less significant features discussed in this paper provided the motivation for considering alternative models and developing new analysis of WMAP (and soon Planck) data. The oddities have triggered proposed new observations that can further test the models. It is often difficult to assess the statistical claims. It may well be that an oddity could be found that motivates a new theory, which then could be tested as a hypothesis against ?CDM. The data support these comparisons. Of course, other cosmological measurements must also play a role in testing new hypotheses. No CMB anomaly reported to date has caused the scientific community to adopt a new standard model of cosmology, but claimed anomalies have been used to provoke thought and to search for improved theories.”
Primary source: Seven-Year Wilkinson Microwave Anisotropy Probe (WMAP) Observations: Are There Cosmic Microwave Background Anomalies? (arXiv:1001.4758). The five other Seven-Year WMAP papers are: Seven-Year Wilkinson Microwave Anisotropy Probe (WMAP) Observations: Cosmological Interpretation (arXiv:1001.4538), Seven-Year Wilkinson Microwave Anisotropy Probe (WMAP) Observations: Planets and Celestial Calibration Sources (arXiv:1001.4731), Seven-Year Wilkinson Microwave Anisotropy Probe (WMAP) Observations: Sky Maps, Systematic Errors, and Basic Results (arXiv:1001.4744), Seven-Year Wilkinson Microwave Anisotropy Probe (WMAP) Observations: Power Spectra and WMAP-Derived Parameters (arXiv:1001.4635), and Seven-Year Wilkinson Microwave Anisotropy Probe (WMAP) Observations: Galactic Foreground Emission (arXiv:1001.4555). Also check out the official WMAP website.
Temperature and polarization around hot and cold spots (Credit: NASA / WMAP Science Team)
[/caption]
The Wilkinson Microwave Anisotropy Probe (WMAP) science team has finished analyzing seven full years’ of data from the little probe that could, and once again it seems we can sum up the universe in six parameters and a model.
Using the seven-year WMAP data, together with recent results on the large-scale distribution of galaxies, and an updated estimate of the Hubble constant, the present-day age of the universe is 13.75 (plus-or-minus 0.11) billion years, dark energy comprises 72.8% (+/- 1.5%) of the universe’s mass-energy, baryons 4.56% (+/- 0.16%), non-baryonic matter (CDM) 22.7% (+/- 1.4%), and the redshift of reionization is 10.4 (+/- 1.2).
In addition, the team report several new cosmological constraints – primordial abundance of helium (this rules out various alternative, ‘cold big bang’ models), and an estimate of a parameter which describes a feature of density fluctuations in the very early universe sufficiently precisely to rule out a whole class of inflation models (the Harrison-Zel’dovich-Peebles spectrum), to take just two – as well as tighter limits on many others (number of neutrino species, mass of the neutrino, parity violations, axion dark matter, …).
The best eye-candy from the team’s six papers are the stacked temperature and polarization maps for hot and cold spots; if these spots are due to sound waves in matter frozen in when radiation (photons) and baryons parted company – the cosmic microwave background (CMB) encodes all the details of this separation – then there should be nicely circular rings, of rather exact sizes, around the spots. Further, the polarization directions should switch from radial to tangential, from the center out (for cold spots; vice versa for hot spots).
And that’s just what the team found!
Concerning Dark Energy. Since the Five-Year WMAP results were published, several independent studies with direct relevance to cosmology have been published. The WMAP team took those from observations of the baryon acoustic oscillations (BAO) in the distribution of galaxies; of Cepheids, supernovae, and a water maser in local galaxies; of time-delay in a lensed quasar system; and of high redshift supernovae, and combined them to reduce the nooks and crannies in parameter space in which non-cosmological constant varieties of dark energy could be hiding. At least some alternative kinds of dark energy may still be possible, but for now Λ, the cosmological constant, rules.
Concerning Inflation. Very, very, very early in the life of the universe – so the theory of cosmic inflation goes – there was a period of dramatic expansion, and the tiny quantum fluctuations before inflation became the giant cosmic structures we see today. “Inflation predicts that the statistical distribution of primordial fluctuations is nearly a Gaussian distribution with random phases. Measuring deviations from a Gaussian distribution,” the team reports, “is a powerful test of inflation, as how precisely the distribution is (non-) Gaussian depends on the detailed physics of inflation.” While the limits on non-Gaussianity (as it is called), from analysis of the WMAP data, only weakly constrain various models of inflation, they do leave almost nowhere for cosmological models without inflation to hide.
Concerning ‘cosmic shadows’ (the Sunyaev-Zel’dovich (SZ) effect). While many researchers have looked for cosmic shadows in WMAP data before – perhaps the best known to the general public is the 2006 Lieu, Mittaz, and Zhang paper (the SZ effect: hot electrons in the plasma which pervades rich clusters of galaxies interact with CMB photons, via inverse Compton scattering) – the WMAP team’s recent analysis is their first to investigate this effect. They detect the SZ effect directly in the nearest rich cluster (Coma; Virgo is behind the Milky Way foreground), and also statistically by correlation with the location of some 700 relatively nearby rich clusters. While the WMAP team’s finding is consistent with data from x-ray observations, it is inconsistent with theoretical models. Back to the drawing board for astrophysicists studying galaxy clusters. Seven Year Microwave Sky (Credit: NASA/WMAP Science Team)
I’ll wrap up by quoting Komatsu et al. “The standard ΛCDM cosmological model continues to be an exquisite fit to the existing data.”
Primary source: Seven-Year Wilkinson Microwave Anisotropy Probe (WMAP) Observations: Cosmological Interpretation (arXiv:1001.4738). The five other Seven-Year WMAP papers are: Seven-Year Wilkinson Microwave Anisotropy Probe (WMAP) Observations: Are There Cosmic Microwave Background Anomalies? (arXiv:1001.4758), Seven-Year Wilkinson Microwave Anisotropy Probe (WMAP) Observations: Planets and Celestial Calibration Sources (arXiv:1001.4731), Seven-Year Wilkinson Microwave Anisotropy Probe (WMAP) Observations: Sky Maps, Systematic Errors, and Basic Results (arXiv:1001.4744), Seven-Year Wilkinson Microwave Anisotropy Probe (WMAP) Observations: Power Spectra and WMAP-Derived Parameters (arXiv:1001.4635), and Seven-Year Wilkinson Microwave Anisotropy Probe (WMAP) Observations: Galactic Foreground Emission (arXiv:1001.4555). Also check out the official WMAP website.
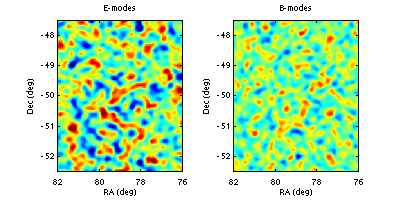
The measure of polarized light from the early Universe allowed researchers to better plot the location of matter - the left image - which later became the stars and galaxies we have today. Image Credit: Sarah Church/Walter Gear
New measurements of the cosmic microwave background (CMB) – the leftover light from the Big Bang – lend further support the Standard Cosmological Model and the existence of dark matter and dark energy, limiting the possibility of alternative models of the Universe. Researchers from Stanford University and Cardiff University produced a detailed map of the composition and structure of matter as it would have looked shortly after the Big Bang, which shows that the Universe would not look as it does today if it were made up solely of ‘normal matter’.
By measuring the way the light of the CMB is polarized, a team led by Sarah Church of the Kavli Institute for Particle Astrophysics and Cosmology at Stanford University and by Walter Gear, head of the School of Physics and Astronomy at Cardiff University in the United Kingdom were able construct a map of the way the Universe would have looked shortly after matter came into existence after the Big Bang. Their findings lend evidence to the predictions of the Standard Model in which the Universe is composed of 95% dark matter and energy, and only 5% of ordinary matter.
Polarization is a feature of light rays in which the oscillation of the light wave lies in right angles to the direction in which the light is traveling. Though most light is unpolarized, light that has interacted with matter can become polarized. The leftover light from the Big Bang – the CMB – has now cooled to a few degrees above 0 Kelvin, but it still retains the same polarization it had in the early Universe, once it had cooled enough to become transparent to light. By measuring this polarization, the researchers were able to extrapolate the location, structure, and velocity of matter in the early Universe with unprecedented precision. The gravitational collapse of large clumps of matter in the early universe creates certain resonances in the polarization that allowed the researchers to create a map of the matter composition.
Dr. Gear said, “The pattern of oscillations in the power spectra allow us to discriminate, as “real” and “dark” matter affect the position and amplitudes of the peaks in different ways. The results are also consistent with many other pieces of evidence for dark matter, such as the rotation rate of galaxies, and the distribution of galaxies in clusters.”
The measurements made by the QUaD experiment further constrain those made by previous experiments to measure properties of the CMB, such as WMAP and ACBAR. In comparison to these previous experiments, the measurements come closer to fitting what is predicted by the Standard Cosmologicl Model by more than an order of magnitude, said Dr. Gear. This is a very important step on the path to verifying whether our model of the Universe is correct.
The researchers used the QUaD experiment at the South Pole to make their observations. The QUaD telescope is a bolometer, essentially a thermometer that measures how certain types of radiation increase the temperature of the metals in the detector. The detector itself has to be near 1 degree Kelvin to eliminate noise radiation from the surrounding environment, which is why it is located at the frigid South Pole, and placed inside of a cryostat.
Paper co-author Walter Gear said in an email interview:
“The polarization is imprinted at the time the Universe becomes transparent to light, about 400,000 years after the big bang, rather than right after the big bang before matter existed. There are major efforts now to try to find what is called the “B-mode” signal” which is a more complicated polarization pattern that IS imprinted right after the big-bang. QuaD places the best current upper limit on this but is still more than an order of magnitude away in sensitivity from even optimistic predictions of what that signal might be. That is the next generation of experiments’s goal.”
The results, published in a paper titled Improved Measurements of the Temperature and Polarization of the Cosmic Microwave Background from QUaD in the November 1st Astrophysical Journal, fit the predictions of the Standard Model remarkably well, providing further evidence for the existence of dark matter and energy, and constraining alternative models of the Universe.
Source: SLAC, email interview with Dr. Walter Gear
[/caption]
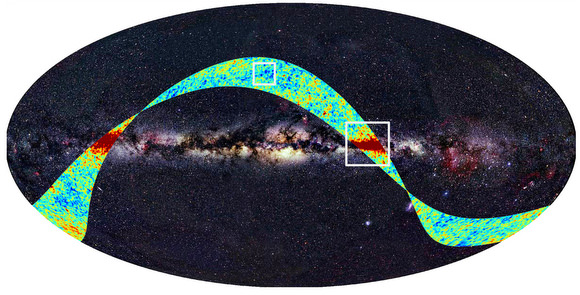
One of the newest telescopes in space, the Planck spacecraft, recently completed its “first light” survey which began on August 13. Astronomers say the initial data, gathered from Planck’s vantage point at the L2 point in space, is excellent. Planck is studying the Cosmic Microwave Background, looking for variations in temperature that are about a million times smaller than one degree. This is comparable to measuring from Earth the body heat of a rabbit sitting on the Moon.
The initial survey yielded maps of a strip of the sky, one for each of Planck’s nine frequencies. Each map is a ring, about 15° wide, stretching across the full sky.
The the differences in color in the strips indicate the magnitude of the deviations of the temperature of the Cosmic Microwave Background from its average value, as measured by Planck at a frequency close to the peak of the CMB spectrum (red is hotter and blue is colder).
The large red strips trace radio emission from the Milky Way, whereas the small bright spots high above the galactic plane correspond to emission from the Cosmic Microwave Background itself.
In order to do its work, Planck’s detectors must be cooled to extremely low temperatures, some of them being very close to absolute zero (–273.15°C, or zero Kelvin, 0K).
Routine operations are now underway, and surveying will continue for at least 15 months without a break. In approximately 6 months, the first all-sky map will be assembled.
Within its projected operational life of 15 months, Planck will gather data for two complete sky maps. To fully exploit the high sensitivity of Planck, the data will require delicate adjustments and careful analysis. It promises to return a treasure trove that will keep both cosmologists and astrophysicists busy for decades to come.
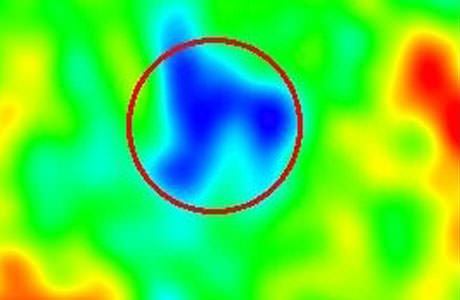
Region in space detected by WMAP cooler than its surroundings. But not really. Rudnick/NRAO/AUI/NSF, NASA.
Rats! Another perplexing space mystery solved by science. New analysis of the famous “cold spot” in the cosmic microwave background reveals, and confirms, actually, that the spot is just an artifact of the statistical methods used to find it. That means there is no supervoid lurking in the CMB, and no parallel universe lying just beyond the edge of our own. What fun is that?
Back in 2004, astronomers studying data from the Wilkinson Microwave Anisotropy Probe (WMAP) found a region of the cosmic microwave background in the southern hemisphere in the direction of the constellation of Eridanus that was significantly colder than the rest by about 70 microkelvin. The probability of finding something like that was extremely low. If the Universe really is homogeneous and isotropic, then all points in space ought to experience the same physical development, and appear the same. This just wasn’t supposed to be there.
Some astronomers suggested the spot could be a supervoid, a remnant of an early phase transition in the universe. Others theorized it was a window into a parallel universe.
Well, it turns out, it wasn’t there.
Ray Zhang and Dragan Huterer at the University of Michigan in Ann Arbor say that the cold spot is simply an artifact of the statistical method–called Spherical Mexican Hat Wavelets–used to analyze the WMAP data. Use a different method of analysis and the cold spot disappears (or at least is no colder than expected).
“We trace this apparent discrepancy to the fact that WMAP cold spot’s temperature profile just happens to favor the particular profile given by the wavelet,” the duo says in their paper. “We find no compelling evidence for the anomalously cold spot in WMAP at scales between 2 and 8 degrees.”
This confirms another paper from 2008 also by Huterer along with colleague Kendrick Smith from the University of Cambridge who showed that the huge void could be considered as a statistical fluke because it had stars both in front of and behind it.
And in fact, one of the earlier papers suggesting the cold spot by Lawrence Rudnick from the University of Minnesota does indeed say that statistical uncertainties have not been accounted for.
Oh well. Now, on to the next cosmological mysteries like dark matter and dark energy!

")

 measurements come closer to fitting what is predicted by the Standard Cosmologicl Model by more than an order of magnitude, said Dr. Gear. This is a very important step on the path to verifying whether our model of the Universe is correct.