A simulation of galaxies during the era of deionization in the early Universe. Credit: M. Alvarez, R. Kaehler, and T. AbelCredit: M. Alvarez, R. Kaehler, and T. Abel
In the beginning, there was chaos.
Hot, dense, and packed with energetic particles, the early Universe was a turbulent, bustling place. It wasn’t until about 300,000 years after the Big Bang that the nascent cosmic soup had cooled enough for atoms to form and light to travel freely. This landmark event, known as recombination, gave rise to the famous cosmic microwave background (CMB), a signature glow that pervades the entire sky.
Now, a new analysis of this glow suggests the presence of a pronounced bruise in the background — evidence that, sometime around recombination, a parallel universe may have bumped into our own.
Although they are often the stuff of science fiction, parallel universes play a large part in our understanding of the cosmos. According to the theory of eternal inflation, bubble universes apart from our own are theorized to be constantly forming, driven by the energy inherent to space itself.
Like soap bubbles, bubble universes that grow too close to one another can and do stick together, if only for a moment. Such temporary mergers could make it possible for one universe to deposit some of its material into the other, leaving a kind of fingerprint at the point of collision.
Ranga-Ram Chary, a cosmologist at the California Institute of Technology, believes that the CMB is the perfect place to look for such a fingerprint.
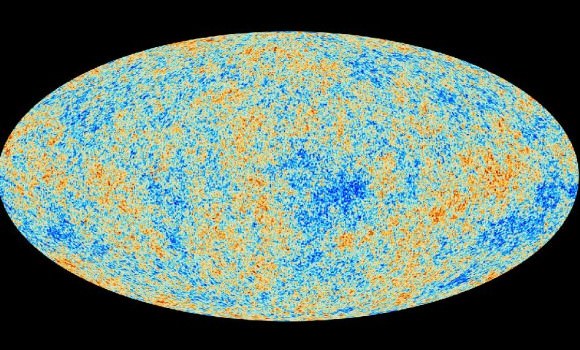
The cosmic microwave background (CMB), a pervasive glow made of light from the Universe’s infancy, as seen by the Planck satellite in 2013. Tiny deviations in average temperature are represented by color. Credit: ESA and the Planck Collaboration.
After careful analysis of the spectrum of the CMB, Chary found a signal that was about 4500x brighter than it should have been, based on the number of protons and electrons scientists believe existed in the very early Universe. Indeed, this particular signal — an emission line that arose from the formation of atoms during the era of recombination — is more consistent with a Universe whose ratio of matter particles to photons is about 65x greater than our own.
There is a 30% chance that this mysterious signal is just noise, and not really a signal at all; however, it is also possible that it is real, and exists because a parallel universe dumped some of its matter particles into our own Universe.
After all, if additional protons and electrons had been added to our Universe during recombination, more atoms would have formed. More photons would have been emitted during their formation. And the signature line that arose from all of these emissions would be greatly enhanced.
Chary himself is wisely skeptical.
“Unusual claims like evidence for alternate Universes require a very high burden of proof,” he writes.
Indeed, the signature that Chary has isolated may instead be a consequence of incoming light from distant galaxies, or even from clouds of dust surrounding our own galaxy.
New images returned by the Planck telescope (right) begin to rival the complexity and beauty of a great artists imagination - Starry Night.A visulization of the Planck data represents the interaction of interstellar dust with the galactic magnetic field. Color defines the intensity of dust emisions and the measurements of polarized light reveals the direction of the magnetic field lines. (Credits: Vincent Van Gogh, ESA)
From the vantage point of a window in an insane asylum, Vincent van Gogh painted one of the most noted and valued artistic works in human history. It was the summer of 1889. With his post-impressionist paint strokes, Starry Night depicts a night sky before sunrise that undulates, flows and is never settled. Scientific discoveries are revealing a Cosmos with such characteristics.
Since Vincent’s time, artists and scientists have taken their respective paths to convey and understand the natural world. The latest released images taken by the European Planck Space Telescope reveals new exquisite details of our Universe that begin to touch upon the paint strokes of the great master and at the same time looks back nearly to the beginning of time. Since Van Gogh – the passage of 125 years – scientists have constructed a progressively intricate and incredible description of the Universe.
New images returned by the Planck telescope (right) begin to rival the complexity and beauty of a great artists imagination – Starry Night.A visulization of the Planck data represents the interaction of interstellar dust with the galactic magnetic field. Color defines the intensity of dust emisions and the measurements of polarized light reveals the direction of the magnetic field lines. (Credits: Vincent Van Gogh, ESA)
The path from Van Gogh to the Planck Telescope imagery is indirect, an abstraction akin to the impressionism of van Gogh’s era. Impressionists in the 1800s showed us that the human mind could interpret and imagine the world beyond the limitations of our five senses. Furthermore, optics since the time of Galileo had begun to extend the capability of our senses.
A photograph of James Clerk Maxwell and a self-portrait of Vincent van Gogh. Maxwell’s equations and impressionism in the fine arts in the 19th Century sparked an enhanced perception, expression and abstraction of the World and began a trek of knowledge and technology into the modern era. (Credit: National Gallery of Art, Public Domain)
Mathematics is perhaps the greatest form of abstraction of our vision of the World, the Cosmos. The path of science from the era of van Gogh began with his contemporary, James Clerk Maxwell who owes inspiration from the experimentalist Michael Faraday. The Maxwell equations mathematically define the nature of electricity and magnetism. Since Maxwell, electricity, magnetism and light have been intertwined. His equations are now a derivative of a more universal equation – the Standard Model of the Universe. The accompanying Universe Today article by Ramin Skibba describes in more detail the new findings by Planck Mission scientists and its impact on the Standard Model.
The work of Maxwell and experimentalists such as Faraday, Michelson and Morley built an overwhelming body of knowledge upon which Albert Einstein was able to write his papers of 1905, his miracle year (Annus mirabilis). His theories of the Universe have been interpreted, verified time and again and lead directly to the Universe studied by scientists employing the Planck Telescope.
The first Solvay Conference in 1911 was organized by Max Planck and Hendrik Lorentz. Planck is standing, second from left. The first Solvay, by invitation only, included most of the greatest scientists of the early 20th Century. While Planck is known for his work on quanta, the groundwork for quantum theory – the Universe in minutiae , the Planck telescope is surveying the Universe in the large. Physicists are closer to unifying the nature of the two extremes. Insets – Planck (1933, 1901).
In 1908, the German physicist Max Planck, for whom the ESA telescope is named, recognized the importance of Einstein’s work and finally invited him to Berlin and away from the obscurity of a patent office in Bern, Switzerland.
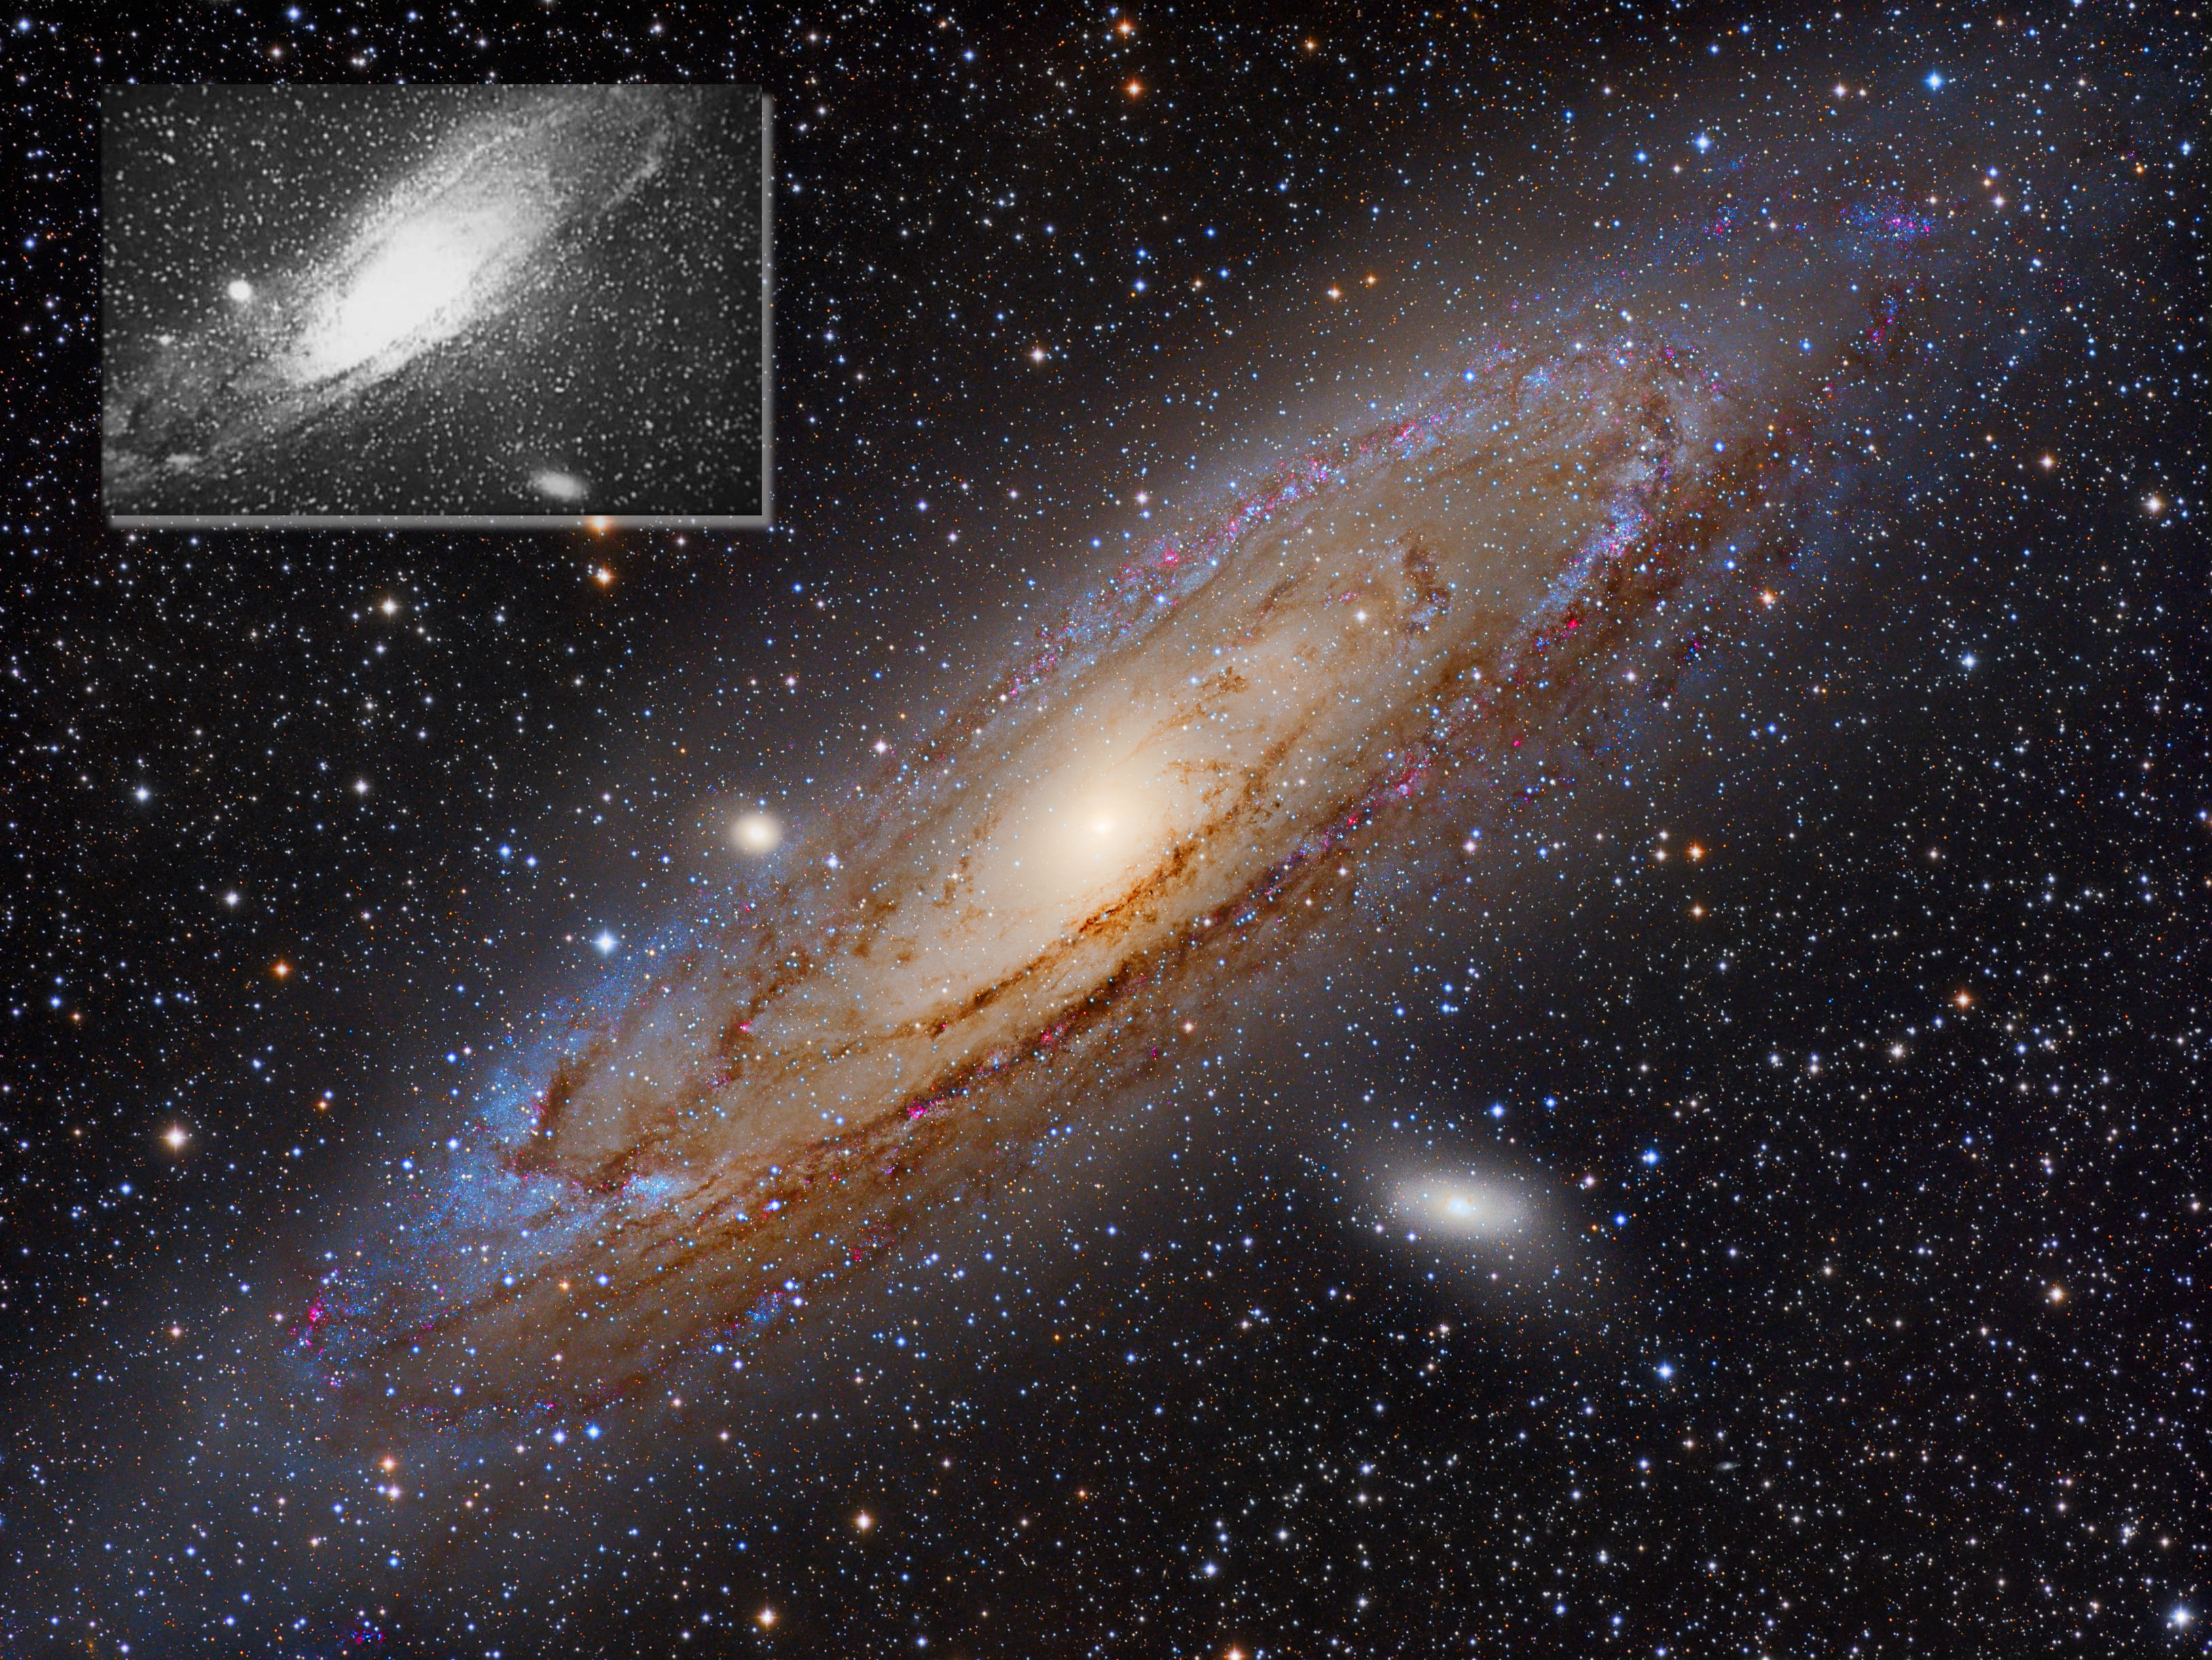
As Einstein spent a decade to complete his greatest work, the General Theory of Relativity, astronomers began to apply more powerful tools to their trade. Edwin Hubble, born in the year van Gogh painted Starry Night, began to observe the night sky with the most powerful telescope in the World, the Mt Wilson 100 inch Hooker Telescope. In the 1920s, Hubble discovered that the Milky Way was not the whole Universe but rather an island universe, one amongst billions of galaxies. His observations revealed that the Milky Way was a spiral galaxy of a form similar to neighboring galaxies, for example, M31, the Andromeda Galaxy.
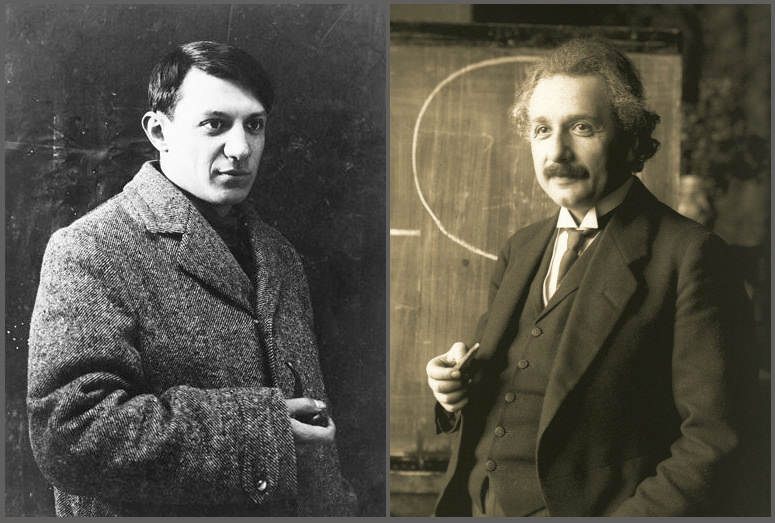
Pablo Picasso and Albert Einstein were human wrecking balls in their respective professions. What began with Faraday and Maxwell, van Gogh and Gaugin were taken to new heights. We are encapsulated in the technology derived from these masters but are able to break free of the confinement technology can impose through the expression and art of Picasso and his contemporaries.
Einstein’s equations and Picasso’s abstraction created another rush of discovery and expressionism that propel us for another 50 years. Their influence continues to impact our lives today.
The Andromeda Galaxy, M31, the nearest spiral galaxy to the Milky Way, several times the angular size of the Moon. First photographed by Isaac Roberts, 1899 (inset), spirals are a function of gravity and the propagation of shock waves, across the expanses of such galaxies are electromagnetic fields such as reported by Planck mission scientists.
Telescopes of Hubble’s era reached their peak with the Palomar 200 inch telescope, four times the light gathering power of Mount Wilson’s. Astronomy had to await the development of modern electronics. Improvements in photographic techniques would pale in comparison to what was to come.
The development of electronics was accelerated by the pressures placed upon opposing forces during World War II. Karl Jansky developed radio astronomy in the 1930s which benefited from research that followed during the war years. Jansky detected the radio signature of the Milky Way. As Maxwell and others imagined, astronomy began to expand beyond just visible light – into the infrared and radio waves. Discovery of the Cosmic Microwave Background (CMB) in 1964 by Arno Penzias and Robert Wilson is arguably the greatest discovery from observations in the radio wave (and microwave) region of the electromagnetic spectrum.
From 1937 to the present day, radio astronomy has been an ever refining merger of electronics and optics. Karl Jansky’s first radio telescope, 1937 (inset) and the great ALMA array now in operation studying the Universe in the microwave region of the electromagnetic spectrum. (Credits: ESO)
Analog electronics could augment photographic studies. Vacuum tubes led to photo-multiplier tubes that could count photons and measure more accurately the dynamics of stars and the spectral imagery of planets, nebulas and whole galaxies. Then in the 1947, three physicists at Bell Labs , John Bardeen, Walter Brattain, and William Shockley created the transistor that continues to transform the World today.
For astronomy and our image of the Universe, it meant more acute imagery of the Universe and imagery spanning across the whole electromagnetic spectrum. Infrared Astronomy developed slowly beginning in the 1800s but it was solid state electronics in the 1960s when it came of age. Microwave or Millimeter Radio Astronomy required a marriage of radio astronomy and solid state electronics. The first practical millimeter wave telescope began operations in 1980 at Kitt Peak Observatory.
An early work of Picasso (center), the work at Bell Labs of John Bardeen, Walter Brattain, and William Shockley and the mobile art of Alexander Calder. As artists attempt to balance color and shape, the Bell Lab engineers balanced electrons essentially on the head of a pin, across junctions to create the first transistor.
With further improvements in solid state electronics and development of extremely accurate timing devices and development of low-temperature solid state electronics, astronomy has reached the present day. With modern rocketry, sensitive devices such as the Hubble and Planck Space Telescopes have been lofted into orbit and above the opaque atmosphere surrounding the Earth.
In 1964, the Cosmic Microwave Background (CMB) was discovered. In the early 1990s, the COBE space telescope returned even more detailed results and now Planck has refined and expanded upon IRAS, COBE and BICEP observations of the CMB. Inset, first light observations of the Planck mission. (Photo Credits: ESA)
Astronomers and physicists now probe the Universe across the whole electromagnetic spectrum generating terabytes of data and abstractions of the raw data allow us to look out into the Universe with effectively a sixth sense, that which is given to us by 21st century technology. What a remarkable coincidence that the observations of our best telescopes peering through hundreds of thousands of light years, even more so, back 13.8 billion years to the beginning of time, reveal images of the Universe that are not unlike the brilliant and beautiful paintings of a human with a mind that gave him no choice but to see the world differently.
Now 125 years later, this sixth sense forces us to see the World in a similar light. Peer up into the sky and you can imagine the planetary systems revolving around nearly every star, swirling clouds of spiral galaxies, one even larger in the sky than our Moon, and waves of magnetic fields everywhere across the starry night.
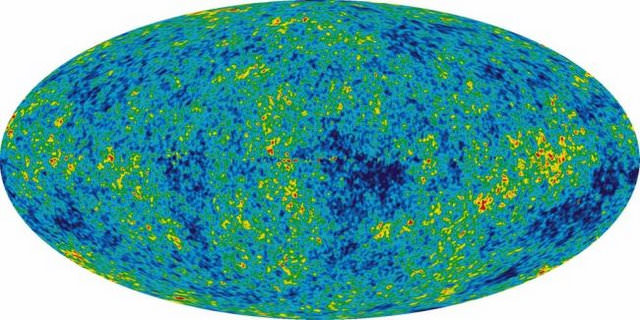
This image, the best map ever of the Universe, shows the oldest light in the universe. This glow, left over from the beginning of the cosmos called the cosmic microwave background, shows tiny changes in temperature represented by color. Credit: ESA and the Planck Collaboration.
The Cosmic Microwave Background (CMB) radiation is one of the greatest discoveries of modern cosmology. Astrophysicist George Smoot once likened its existence to “seeing the face of God.” In recent years, however, scientists have begun to question some of the attributes of the CMB. Peculiar patterns have emerged in the images taken by satellites such as WMAP and Planck – and they aren’t going away. Now, in a paper published in the December 1 issue of The Astronomical Journal, one scientist argues that the existence of these patterns may not only imply new physics, but also a revolution in our understanding of the entire Universe.
Let’s recap. Thanks to a blistering ambient temperature, the early Universe was blanketed in a haze for its first 380,000 years of life. During this time, photons relentlessly bombarded the protons and electrons created in the Big Bang, preventing them from combining to form stable atoms. All of this scattering also caused the photons’ energy to manifest as a diffuse glow. The CMB that cosmologists see today is the relic of this glow, now stretched to longer, microwave wavelengths due to the expansion of the Universe.
As any fan of the WMAP and Planck images will tell you, the hallmarks of the CMB are the so-called anisotropies, small regions of overdensity and underdensity that give the picture its characteristic mottled appearance. These hot and cold spots are thought to be the result of tiny quantum fluctuations born at the beginning of the Universe and magnified exponentially during inflation.
Temperature and polarization around hot and cold spots (Credit: NASA / WMAP Science Team)
Given the type of inflation that cosmologists believe occurred in the very early Universe, the distribution of these anisotropies in the CMB should be random, on the order of a Gaussian field. But both WMAP and Planck have confirmed the existence of certain oddities in the fog: a large “cold spot,” strange alignments in polarity known as quadrupoles and octupoles, and, of course, Stephen Hawking’s initials.
In his new paper, Fulvio Melia of the University of Arizona argues that these types of patterns (Dr. Hawking’s signature notwithstanding) reveal a problem with the standard inflationary picture, or so-called ΛCDM cosmology. According to his calculations, inflation should have left a much more random assortment of anisotropies than the one that scientists see in the WMAP and Planck data. In fact, the probability of these particular anomalies lining up the way they do in the CMB images is only about 0.005% for a ΛCDM Universe.
Melia posits that the anomalous patterns in the CMB can be better explained by a new type of cosmology in which no inflation occurred. He calls this model the R(h)=ct Universe, where c is the speed of light, t is the age of the cosmos, and R(h) is the Hubble radius – the distance beyond which light will never reach Earth. (This equation makes intuitive sense: Light, traveling at light speed (c) for 13.7 billion years (t), should travel an equivalent number of light-years. In fact, current estimates of the Hubble radius put its value at about 13.4 billion light-years, which is remarkably close to the more tightly constrained value of the Universe’s age.)
R(h)=ct holds true for both the standard cosmological scenario and Melia’s model, with one crucial difference: in ΛCDM cosmology, this equation only works for the current age of the Universe. That is, at any time in the distant past or future, the Universe would have obeyed a different law. Scientists explain this odd coincidence by positing that the Universe first underwent inflation, then decelerated, and finally accelerated again to its present rate.
Melia hopes that his model, a Universe that requires no inflation, will provide an alternative explanation that does not rely on such fine-tuning. He calculates that, in a R(h)=ct Universe, the probability of seeing the types of strange patterns that have been observed in the CMB by WMAP and Planck is 7–10%, compared with a figure 1000 times lower for the standard model.
So, could this new way of looking at the cosmos be a death knell for ΛCDM? Probably not. Melia himself cites a few less earth-shattering explanations for the anomalous signals in the CMB, including foreground noise, statistical biases, and instrumental errors. Incidentally, the Planck satellite is scheduled to release its latest image of the CMB this week at a conference in Italy. If these new results show the same patterns of polarity that previous observations did, cosmologists will have to look into each possible explanation, including Melia’s theory, more intensively.
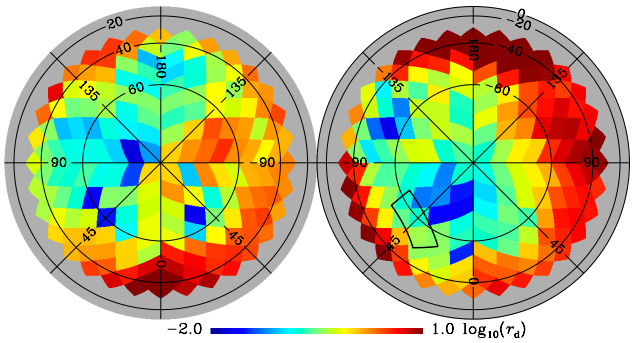
Dust map of the Universe. The region studied by BICEP2 is indicated by the rectangle in the right circle. Credit: Planck Collaboration
One of the recent sagas in cosmology began with the BICEP2 press conference announcing evidence of early cosmic inflation. There was some controversy since the press release was held before the paper was peer reviewed. The results were eventually published in Physical Review Letters, though with a more cautious conclusion than the original press release. Now the Planck team has released more of their data. This new work hasn’t yet been peer reviewed, but it doesn’t look good for BICEP2.
As you might recall, BICEP2 analyzed light from the cosmic microwave background (CMB) looking for a type of pattern known as B-mode polarization. This is a pattern of polarized light that (theoretically) is caused by gravitational waves produced by early cosmic inflation. There’s absolutely no doubt that BICEP2 detected B-mode polarization, but that’s only half the challenge. The other half is proving that the B-mode polarization they saw was due to cosmic inflation, and not due to some other process, mainly dust. And therein lies the problem. Dust is fairly common in the Milky Way, and it can also create B-mode polarization. Because the dust is between us and the CMB, it can contaminate its B-mode signal. This is sometimes referred to as the foreground problem. To really prove you have evidence of B-mode polarization in the CMB, you must ensure that you’ve eliminated any foreground effects from your data.
When the BICEP2 results were first announced, the question of dust was immediately raised. Some researchers noted that dust particles caught in magnetic fields could produce stronger B-mode effects than originally thought. Others pointed out that part of the data BICEP2 used to distinguish foreground dust wasn’t very accurate. This is part of the reason the final results went from “We found inflation!” to “We think we’ve found inflation! (But we can’t be certain.)”
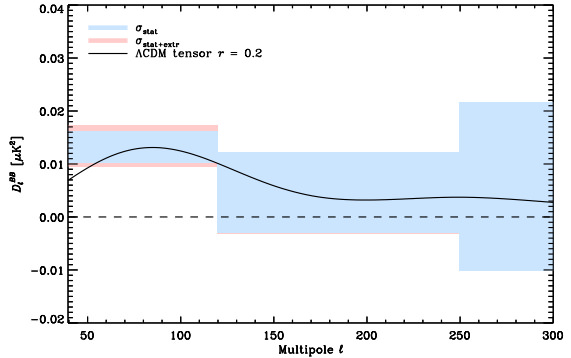
Dust effects seen by Planck (shaded region) compared with inflation results of BICEP2 (solid line). Credit: Planck Collaboration
The new results from Planck chip at that claim even further. Whereas BICEP2 looked at a specific region of the sky, Planck has been gathering data across the entire sky. This means lots more data that can be used to distinguish foreground dust from a CMB signal. This new paper presented a map of the foreground dust, and a good summary can be seen in the figure. The shaded areas represents the B-mode levels due to dust at different scales. The solid line represents the B-mode distribution due to inflation as seen by BICEP2. As you can see, it matches the dust signal really well.
The simple conclusion is that the results of BICEP2 have been shown to be dust, but that isn’t quite accurate. It is possible that BICEP2 has found a mixture of dust and inflation signals, and with a better removal of foreground effects there may still be a real result. It is also possible that it’s all dust.
While this seems like bad news, it actually answers a mystery in the BICEP2 results. The level of inflation claimed by BICEP2 was actually quite large. Much larger than expected than many popular models. The fact that a good chuck of the B-mode polarization is due to dust means that inflation can’t be that large. So small inflation models are back in favor. It should also be emphasized that even if the BICEP2 results are shown to be entirely due to dust, that doesn’t mean inflation doesn’t exist. It would simply mean we have no evidence either way.
It’s tempting to look at all this with a bit of schadenfreude. Har, har, the scientists got it wrong again. But a more accurate view would be of two rival sports teams playing an excellent game. BICEP2 almost scored, but Planck rallied an excellent defense. Both teams want to be the first to score, but the other team won’t let them cheat to win. And we get to watch it happen.
Anyone who says science is boring hasn’t been paying attention.
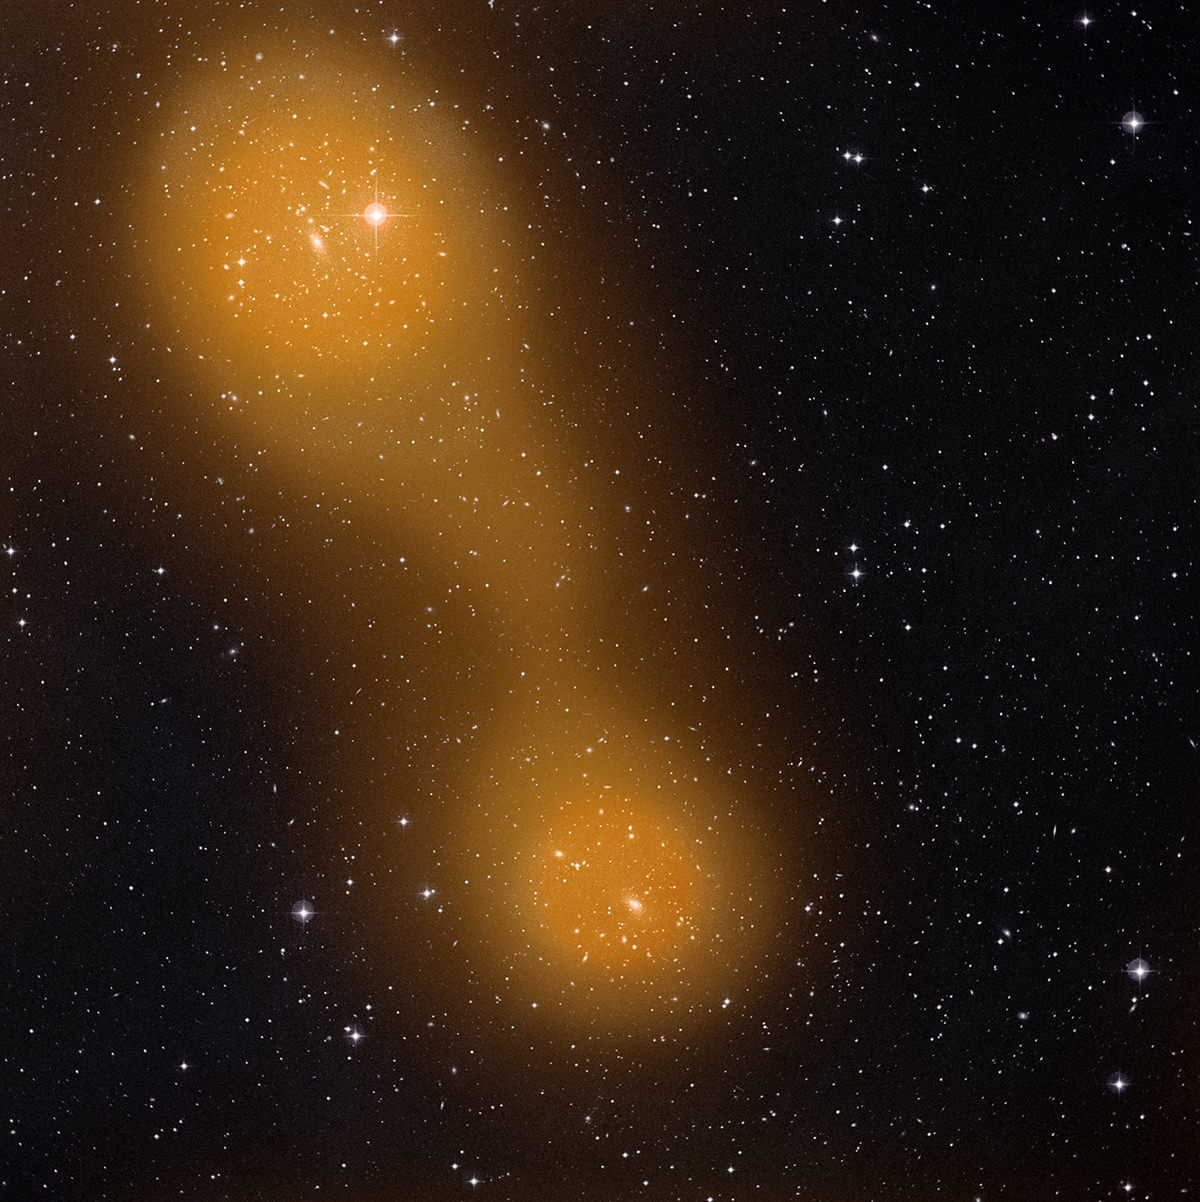
An “bridge” of hot gas stretches between galaxy clusters Abell 401 and Abell 399
It may not be good practice to burn bridges but this is one super-heated bridge that astronomers were happy to find: an enormous swath of hot gas connecting two galaxy clusters 10 million light-years apart, and nearly a billion light-years away.
Using ESA’s Planck space telescope, astronomers have identified leftover light from the Big Bang interacting with a filament of hot gas stretching between Abell 401 and Abell 399, two galactic clusters each containing hundreds of individual galaxies.
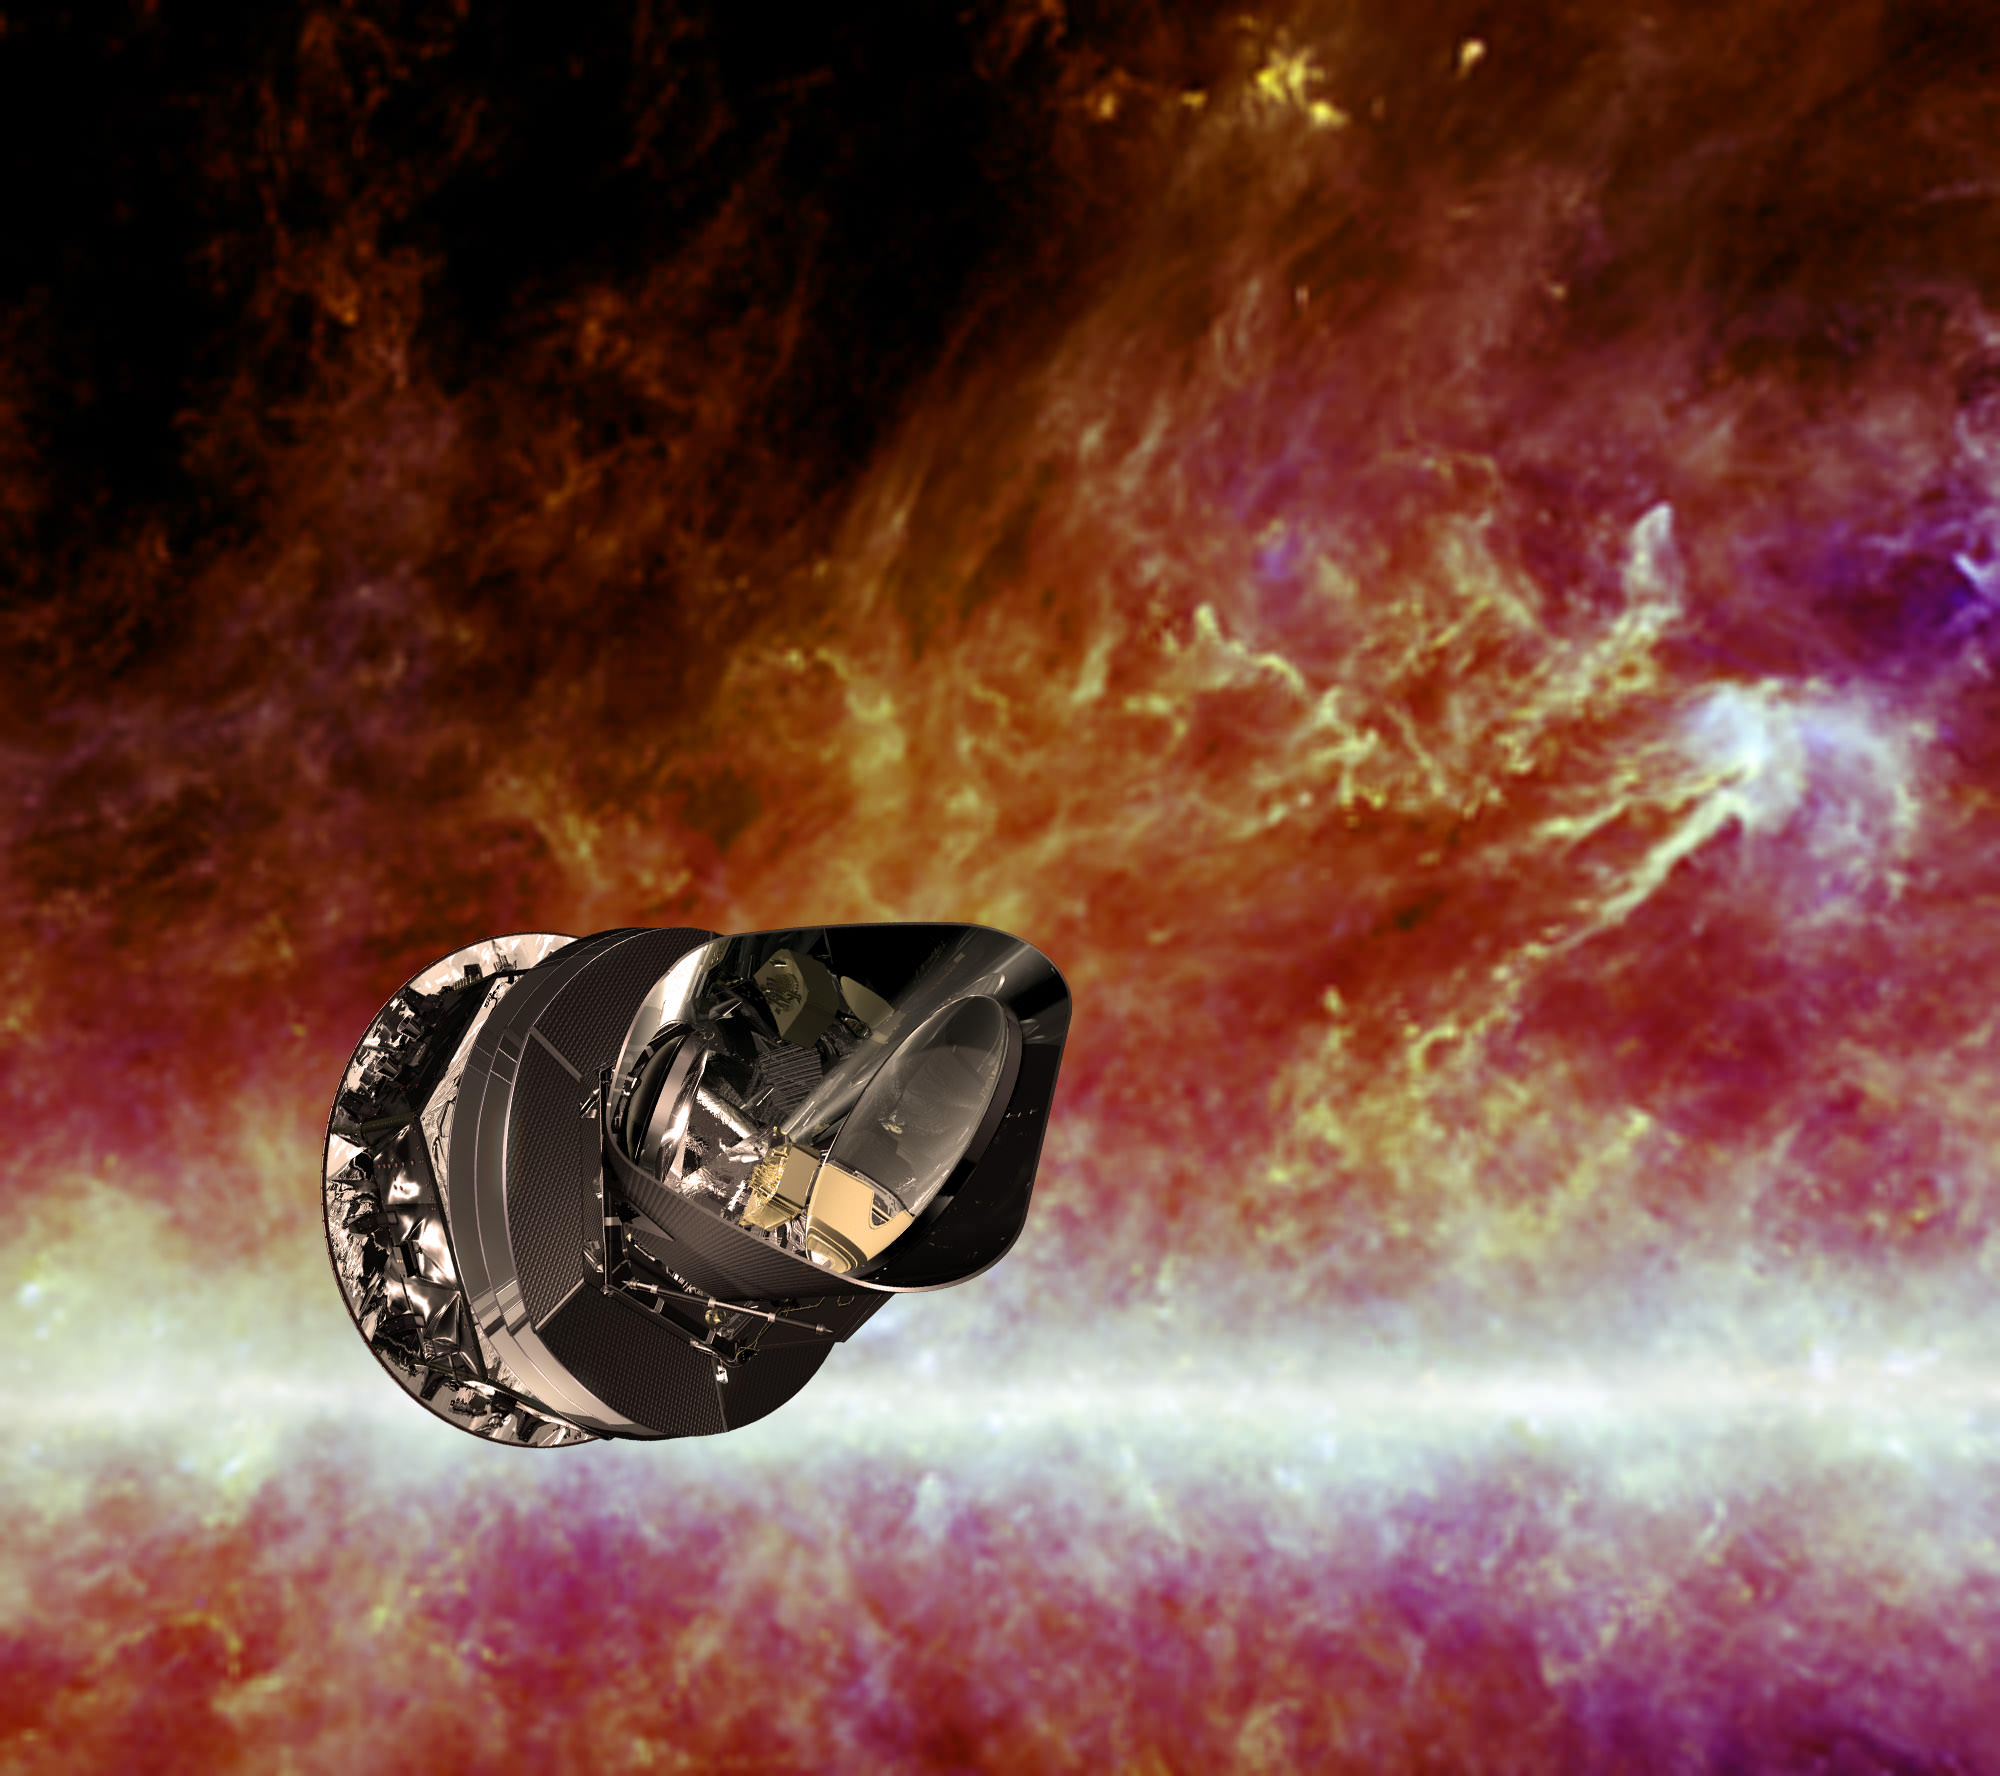
Launched in May 2009, Planck is designed to study the Cosmic Microwave Background (CMB) — the leftover light from the Big Bang. When this radiation interacts with large-scale cosmic structures, like the hot gas bridging clusters of galaxies, its energy is modified in a specific way. This is referred to as the Sunyaev–Zel’dovich Effect (SZE), and Planck is specifically attuned to finding it.
This, however, is Planck’s first discovery of inter-cluster gas found using the SZ technique.
The temperature of the gas is estimated to be around 80 million degrees C, similar to the temperature of the gas found within the clusters themselves. It’s thought that the gas may be a combination of cosmic web filaments left over from the early Universe mixed with gas from the clusters.
The image above shows the clusters Abell 401 and Abell 399 as seen at optical wavelengths with ground-based telescopes overlaid with the SZE from Planck. The entire bridge spans a distance about the size of two full Moons in the sky.
Top image: Sunyaev–Zel’dovich effect: ESA Planck Collaboration; optical image: STScI Digitized Sky Survey. Inset image: Artist’s impression of Planck against the CMB. (ESA and the HFI Consortium, IRAS)
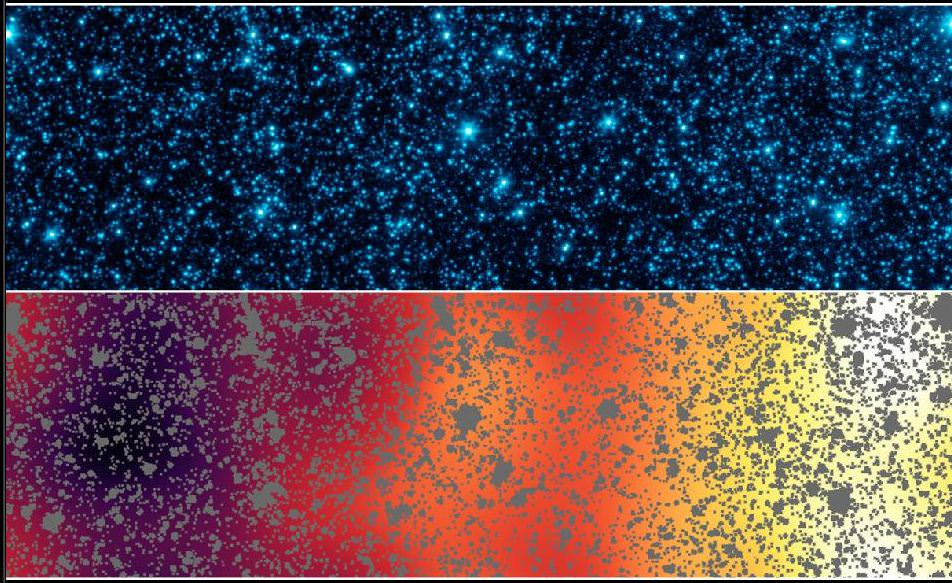
These two panels show the same slice of sky in the constellation Boötes, dubbed the "Extended Groth Strip." The area covered is about 1 by 0.12 degrees. Image credit: NASA/JPL-Caltech/GSFC
[/caption]
The Spitzer Space Telescope has looked back in time to see what scientists called the “faint, lumpy glow” given off by the very first objects in the Universe, and these ancient objects obviously provided some early cosmic fireworks. While they are too faint and distant to figure out what the individual objects are – they may be massive stars or voracious black holes – Spitzer has captured what appears to be the collective pattern of their infrared light, revealing these first objects were numerous and furiously burned cosmic fuel.
“These objects would have been tremendously bright,” said Alexander “Sasha” Kashlinsky from the Goddard Space Flight Center, lead author of a new paper appearing in The Astrophysical Journal. “We can’t yet directly rule out mysterious sources for this light that could be coming from our nearby universe, but it is now becoming increasingly likely that we are catching a glimpse of an ancient epoch. Spitzer is laying down a roadmap for NASA’s upcoming James Webb Telescope, which will tell us exactly what and where these first objects were.”
This isn’t the first time astronomers have used Spitzer to search for the very first stars and black holes, and back in 2005 they saw hints of this remote pattern of light, known as the cosmic infrared background, and again with more precision in 2007. Now, Spitzer is in the extended phase of its mission, during which it performs more in-depth studies on specific patches of the sky. Kashlinsky and his colleagues used Spitzer to look at two patches of sky for more than 400 hours each.
The team then carefully subtracted all the known stars and galaxies in the images. Rather than being left with a black, empty patch of sky, they found faint patterns of light with several telltale characteristics of the cosmic infrared background. The lumps in the pattern observed are consistent with the way the very distant objects are thought to be clustered together.
Kashlinsky likens the observations to looking for Fourth of July fireworks in New York City from Los Angeles. First, you would have to remove all the foreground lights between the two cities, as well as the blazing lights of New York City itself. You ultimately would be left with a fuzzy map of how the fireworks are distributed, but they would still be too distant to make out individually.
“We can gather clues from the light of the Universe’s first fireworks,” said Kashlinsky. “This is teaching us that the sources, or the “sparks,” are intensely burning their nuclear fuel.”
The Universe formed roughly 13.7 billion years ago in a fiery, explosive Big Bang. With time, it cooled and, by around 500 million years later, the first stars, galaxies and black holes began to take shape. Astronomers say some of that “first light” might have traveled billions of years to reach the Spitzer Space Telescope. The light would have originated at visible or even ultraviolet wavelengths and then, because of the expansion of the universe, stretched out to the longer, infrared wavelengths observed by Spitzer.
The new study improves on previous observations by measuring this cosmic infrared background out to scales equivalent to two full moons — significantly larger than what was detected before. Imagine trying to find a pattern in the noise in an old-fashioned television set by looking at just a small piece of the screen. It would be hard to know for certain if a suspected pattern was real. By observing a larger section of the screen, you would be able to resolve both small- and large-scale patterns, further confirming your initial suspicion.
Likewise, astronomers using Spitzer have increased the amount of sky examined to obtain more definitive evidence of the cosmic infrared background. The researchers plan to explore more patches of sky in the future to gather more clues hidden in the light of this ancient era.
“This is one of the reasons we are building the James Webb Space Telescope,” said Glenn Wahlgren, Spitzer program scientist at NASA Headquarters in Washington. “Spitzer is giving us tantalizing clues, but James Webb will tell us what really lies at the era where stars first ignited.”
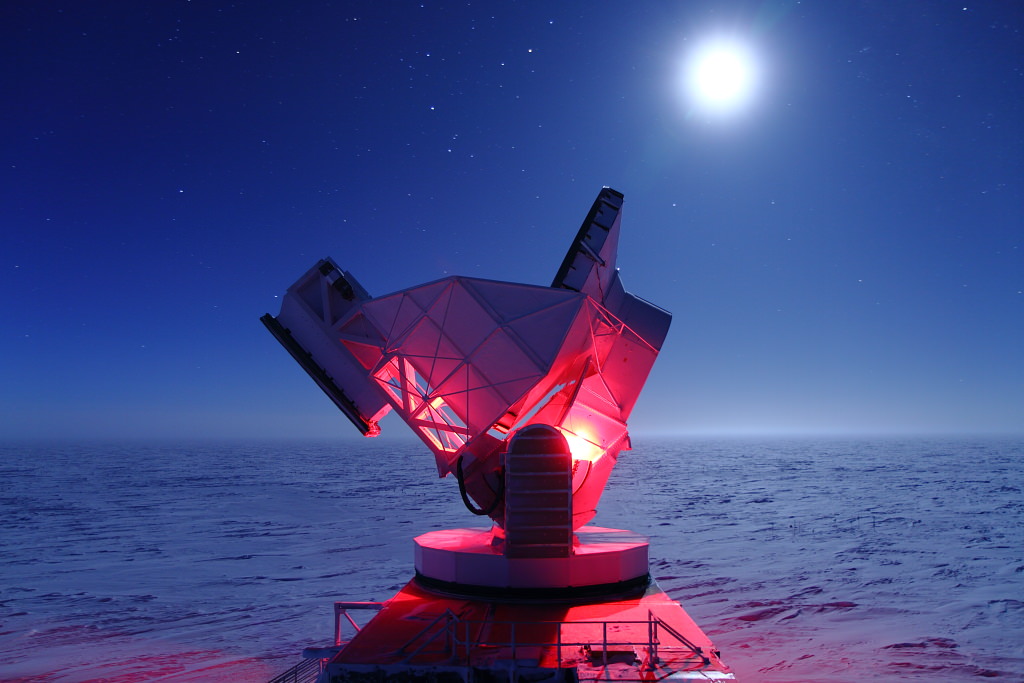
The 10-meter South Pole Telescope in Antarctica at the Amundsen-Scott Station. (Daniel Luong-Van, National Science Foundation)
[/caption]
Located at the southermost point on Earth, the 280-ton, 10-meter-wide South Pole Telescope has helped astronomers unravel the nature of dark energy and zero in on the actual mass of neutrinos — elusive subatomic particles that pervade the Universe and, until very recently, were thought to be entirely without measureable mass.
The NSF-funded South Pole Telescope (SPT) is specifically designed to study the secrets of dark energy, the force that purportedly drives the incessant (and apparently still accelerating) expansion of the Universe. Its millimeter-wave observation abilities allow scientists to study the Cosmic Microwave Background (CMB) which pervades the night sky with the 14-billion-year-old echo of the Big Bang.
Overlaid upon the imprint of the CMB are the silhouettes of distant galaxy clusters — some of the most massive structures to form within the Universe. By locating these clusters and mapping their movements with the SPT, researchers can see how dark energy — and neutrinos — interact with them.
“Neutrinos are amongst the most abundant particles in the universe,” said Bradford Benson, an experimental cosmologist at the University of Chicago’s Kavli Institute for Cosmological Physics. “About one trillion neutrinos pass through us each second, though you would hardly notice them because they rarely interact with ‘normal’ matter.”
If neutrinos were particularly massive, they would have an effect on the large-scale galaxy clusters observed with the SPT. If they had no mass, there would be no effect.
The SPT collaboration team’s results, however, fall somewhere in between.
Even though only 100 of the 500 clusters identified so far have been surveyed, the team has been able to place a reasonably reliable preliminary upper limit on the mass of neutrinos — again, particles that had once been assumed to have no mass.
Previous tests have also assigned a lower limit to the mass of neutrinos, thus narrowing the anticipated mass of the subatomic particles to between 0.05 – 0.28 eV (electron volts). Once the SPT survey is completed, the team expects to have an even more confident result of the particles’ masses.
“With the full SPT data set we will be able to place extremely tight constraints on dark energy and possibly determine the mass of the neutrinos,” said Benson.
“We should be very close to the level of accuracy needed to detect the neutrino masses,” he noted later in an email to Universe Today.
The South Pole Telescope's unique position allows it to watch the night sky for months on end. (NSF)
Such precise measurements would not have been possible without the South Pole Telescope, which has the ability due to its unique location to observe a dark sky for very long periods of time. Antarctica also offers SPT a stable atmosphere, as well as very low levels of water vapor that might otherwise absorb faint millimeter-wavelength signals.
“The South Pole Telescope has proven to be a crown jewel of astrophysical research carried out by NSF in the Antarctic,” said Vladimir Papitashvili, Antarctic Astrophysics and Geospace Sciences program director at NSF’s Office of Polar Programs. “It has produced about two dozen peer-reviewed science publications since the telescope received its ‘first light’ on Feb. 17, 2007. SPT is a very focused, well-managed and amazing project.”
The team’s findings were presented by Bradford Benson at the American Physical Society meeting in Atlanta on April 1.
Artist's impression of the Planck spacecraft. Credit: ESA
[/caption]
After two and a half years of observing the Cosmic Microwave Background, the ESA Planck spacecraft’s High Frequency Instrument ran out of its on-board coolant gases over this past weekend, reaching the end of its very successful mission. But that doesn’t mean the end for Planck observations. The Low Frequency Instrument, which does not need to be super-cold (but is still at a bone-chilling -255 C), will continue taking data.
“The Low Frequency Instrument will now continue operating for another year,” said Richard Davis, of the University of Manchester in the UK. “During that time it will provide unprecedented sensitivity at the lower frequencies.”
From its location at the Earth/Sun’s L2 Lagrangian point, Planck was designed to ‘see’ the microwaves from the CMB and detects them by measuring temperature. The expansion of the Universe means that the CMB is brightest when seen in microwave light, with wavelengths between 100 and 10,000 times longer than visible light. To measure such long wavelengths Planck’s detectors have to be cooled to very low temperatures. The colder the spacecraft, the lower the temperatures the spacecraft can detect.
The High Frequency Instrument (HFI) was cooled to as close to 2.7K (about –270°C, near absolute zero) as possible.
Planck worked perfectly for 30 months, about twice the span originally required, and completed five full-sky surveys with both instruments.
“Planck has been a wonderful mission; spacecraft and instruments have been performing outstandingly well, creating a treasure trove of scientific data for us to work with,” said Jan Tauber, ESA’s Planck Project Scientist.
While it was the combination of both instruments that made Planck so powerful, there is still work for the LFI to do.
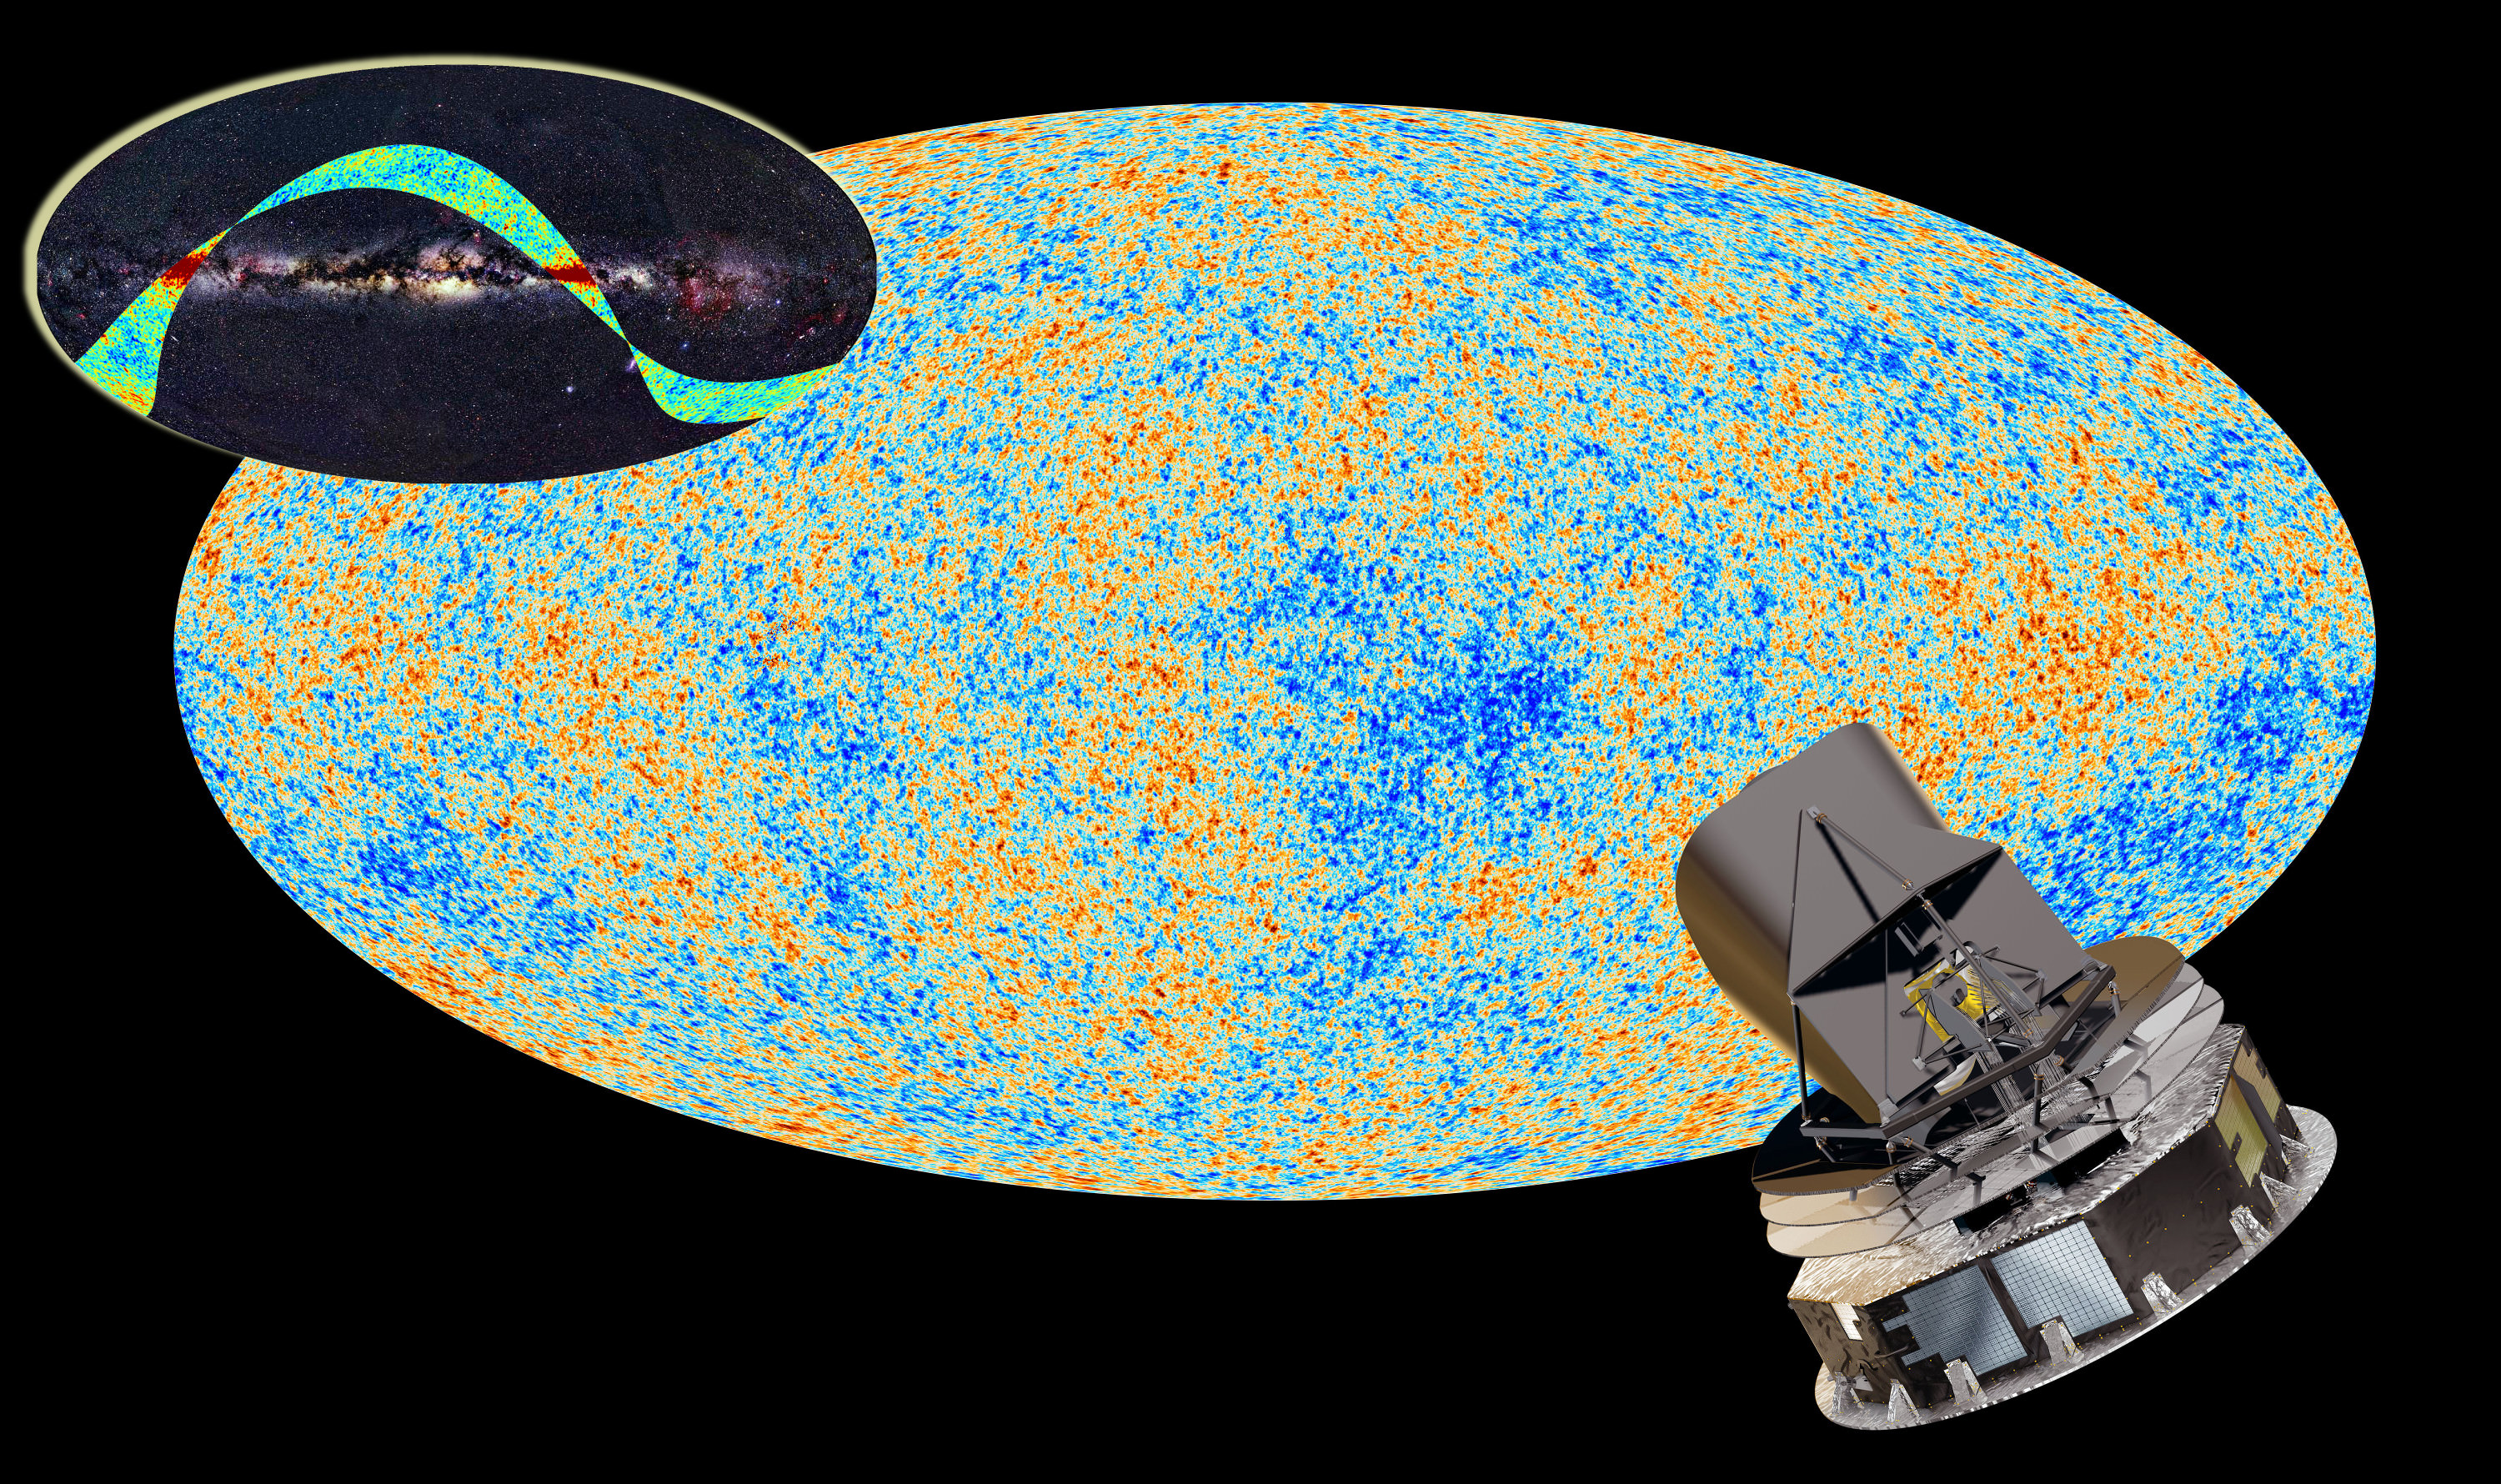
Now and Then. This single all-sky image simultaneously captured two snapshots that straddle virtually the entire 13.7 billion year history of the universe. One of them is ‘now’ – our galaxy and its structures seen as they are over the most recent tens of thousands of years (the thin strip extending across the image is the edge-on plane of our galaxy – the Milky Way). The other is ‘then’ – the red afterglow of the Big Bang seen as it was just 380,000 years after the Big Bang (top and bottom of image). The time between these two snapshots therefore covers about 99.997% of the 13.7 billion year age of the universe. The image was obtained by the Planck spacecraft. Credit: ESA
The scientists involved in Planck have been busy understanding and analyzing the data since Planck launched in May 2009. Initial results from Planck were announced last year, and with Planck data, scientists have created a map of the CMB identifying which bits of the map are showing light from the early Universe, and which parts are due to much closer objects, such as gas and dust in our galaxy, or light from other galaxies. The scientists have also produced a catalog of galaxy clusters in the distant Universe — many of which had not been seen before — and included some gigantic ‘superclusters,’ which are probably merging clusters.
The scientists expect to release data about star formation later next month, and reveal cosmological findings from the Big Bang and the very early Universe in 2013.
“The fact that Planck has worked so perfectly means that we have an incredible amount of data,” said George Efstathiou, a Planck Survey Scientist from the University of Cambridge. “Analyzing it takes very high-performance computers, sophisticated software, and several years of careful study to ensure that the results are correct.”
A1689-zD1, one of the brightest and most distant galaxies, is 12.8 billion light years away - an extremely far distance in our expanding universe. Image credit: NASA/ESA/JPL-Caltech/STScI
[/caption]
Welcome back to the third, and last, installment of Cosmology 101. So far, we’ve covered the history of the universe up to the present moment. But what happens next? How will our universe end? And how can we be so sure that this is how the story unfolded?
Robert Frost once wrote, “Some say the world will end in fire; some say in ice.” Likewise, some scientists have postulated that the universe could die either a dramatic, cataclysmic death – either a “Big Rip” or a “Big Crunch” – or a slower, more gradual “Big Freeze.” The ultimate fate of our cosmos has a lot to do with its shape. If the universe were open, like a saddle, and the energy density of dark energy increased without bound, the expansion rate of the cosmos would eventually become so great that even atoms would be torn apart – a Big Rip. Conversely, if the universe were closed, like a sphere, and gravity’s strength trumped the influence of dark energy, the outward expansion of the cosmos would eventually come to a halt and reverse, collapsing on itself in a Big Crunch.
Despite the poetic beauty of fire, however, current observations favor an icy end to our universe – a Big Freeze. Scientists believe that we live in a spatially flat universe whose expansion is accelerating due to the presence of dark energy; however, the total energy density of the cosmos is most likely less than or equal to the so-called “critical density,” so there will be no Big Rip. Instead, the contents of the universe will eventually drift prohibitively far away from each other and heat and energy exchange will cease. The cosmos will have reached a state of maximum entropy, and no life will be able to survive. Depressing and a bit anti-climactic? Perhaps. But it probably won’t be perceptible until the universe is at least twice its current age.
At this point you might be screaming, “How do we know all this? Isn’t it all just rampant speculation?” Well, first of all, we know without a doubt that the universe is expanding. Astronomical observations consistently demonstrate that light from distant stars is always redshifted relative to us; that is, its wavelength has been stretched due to the expansion of the cosmos. This leads to two possibilities when you wind back the clock: either the expanding universe has always existed and is infinite in age, or it began expanding from a smaller version of itself at a specific time in the past and thus has a fixed age. For a long time, proponents of the Steady State Theory endorsed the former explanation. It wasn’t until Arno Penzias and Robert Wilson discovered the cosmic microwave background in 1965 that the big bang theory became the most accepted explanation for the origin of the universe.
Why? Something as large as our cosmos takes quite a while to cool completely. If the universe did, in fact, began with the kind of blistering energies that the big bang theory predicts, astronomers should still see some leftover heat today. And they do: a uniform 3K glow evenly dispersed at every point in the sky. Not only that – but WMAP and other satellites have observed tiny inhomogeneities in the CMB that precisely match the initial spectrum of quantum fluctuations predicted by the big bang theory.
What else? Take a look at the relative abundances of light elements in the universe. Remember that during the first few minutes of the cosmos’ young life, the ambient temperature was high enough for nuclear fusion to occur. The laws of thermodynamics and the relative density of baryons (i.e. protons and neutrons) together determine exactly how much deuterium (heavy hydrogen), helium and lithium could be formed at this time. As it turns out, there is far more helium (25%!) in our current universe than could be created by nucleosynthesis in the center of stars. Meanwhile, a hot early universe – like the one postulated by the big bang theory – gives rise to the exact proportions of light elements that scientists observe in the universe today.
But wait, there’s more. The distribution of large-scale structure in the universe can be mapped extremely well based solely on observed anisotropies in the CMB. Moreover, today’s large-scale structure looks very different from that at high redshift, implying a dynamic and evolving universe. Additionally, the age of the oldest stars appears to be consistent with the age of the cosmos given by the big bang theory. Like any theory, it has its weaknesses – for instance, the horizon problem or the flatness problem or the problems of dark energy and dark matter; but overall, astronomical observations match the predictions of the big bang theory far more closely than any rival idea. Until that changes, it seems as though the big bang theory is here to stay.
A map of the Cosmic Microwave Background (CMB) as captured by the Wilkinson Microwave Anisotropy Probe. Credit: WMAP team
[/caption]
Welcome back! Last time, we discussed the first few controversial and eventful moments following the birth of our cosmos. Looking around us today, we know that in the span of just a few billion years, the universe was transformed from that blistering amalgam of tiny elementary particles into a vast and organized expanse just teeming with large-scale structure. How does something like that happen?
Let’s recap. When we left off, the universe was a chaotic soup of simple matter and radiation. A photon couldn’t travel very far without bumping into and being absorbed by a charged particle, exciting it and later being emitted, just to go through the cycle again. After about three minutes, the ambient temperature had cooled to such an extent that these charged particles (protons and electrons) could begin to come together and form stable nuclei.
But, despite the falling temperature, it was still hot enough for these nuclei to start to combine into heavier elements. For the next few minutes, the universe cooked up various isotopes of hydrogen, helium and lithium nuclei in a process commonly known as big bang nucleosynthesis. As time went on and the universe expanded even further, these nuclei slowly captured surrounding electrons until neutral atoms dominated the landscape. Finally, after about 300,000 years, photons could travel freely across the universe without charged particles getting in their way. The cosmic microwave background radiation that astronomers observe today is actually the relic light from that very moment, stretched over time due to the expansion of the universe.
If you look at a picture of the CMB (above), you will see a pattern of differently colored patches that represent anisotropies in the background temperature of the cosmos. These temperature differences originally stemmed from tiny quantum fluctuations that were dramatically blown up in the very early universe. Over the next few hundred million years, the slightly overdense regions in the spacetime fabric attracted more and more matter (both baryonic – the kind that you and I are made of – and dark) under the influence of gravity. Some small regions eventually became so hot and dense that they were able to begin nuclear fusion in their cores; thus, in a delicate dance between external gravity and internal pressure, the first stars were born. Gravity then continued its pull, dragging clumps of stars into galaxies and later, clumps of galaxies into galaxy clusters. Some massive stars collapsed into black holes. Others grew so heavy and bloated that they exploded, spewing chunks of metal-rich debris in every direction. About 4.7 billion years ago, some of this material found its way into orbit around one unassuming main sequence star, creating planets of all sizes, shapes, and compositions – our Solar System!
Billions of years of geology and evolution later, here we are. And there the rest of the universe is. It’s a pretty striking story. But what’s next? And how do we know that all of this theory is even close to correct? Make sure to come back next time to find out!