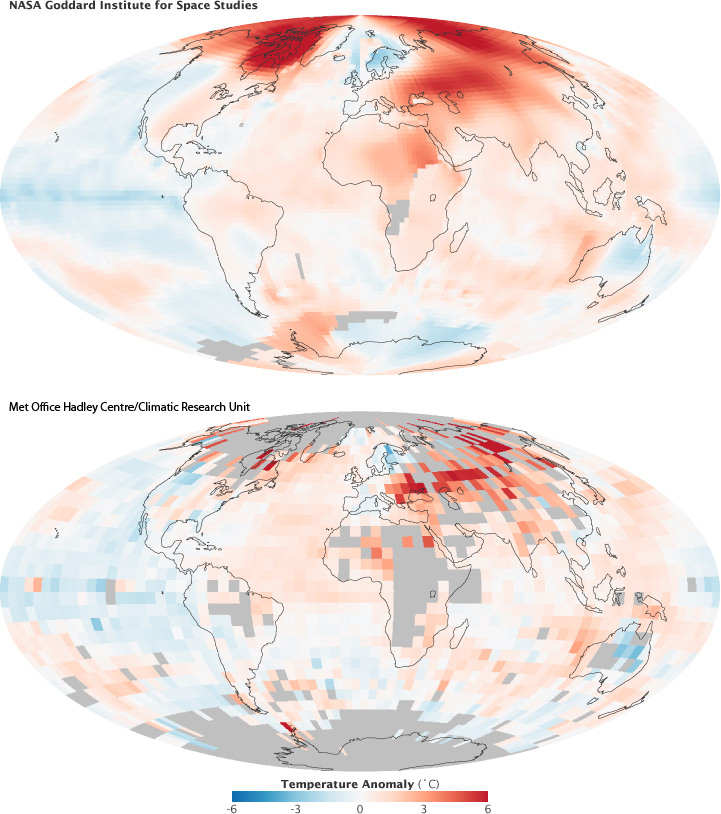
World map with global temperature changes from 1880 to 2010. Credit: NASA GISS
[/caption]
Newly released scientific data shows that 2010 equals 2005 as the Earths warmest year on record over the last 131 years, say researchers from NOAA and NASA. Temperature measurements from instrumented monitoring stations date back to 1880.
The past decade from 2001 to 2010 was the warmest on record and includes 9 of the 10 hottest years. A NOAA ranking of the 15 hottest years globally shows they all occurred in the last 15 years since 1995.
2010 was the 34th consecutive year with global temperatures above the 20th century average of 57.0 F (13.9°C), according to NOAA data. 1976 was the last year with a below average global temperature. Updated.
Global surface temperature anomalies for 2010. Credit: NOAA
Overall, the combined global land and ocean surface temperatures for 2010 and 2005 has risen 1.12 F (0.62 C) compared with the 20th century average, according to NOAA. The average global temperature in 2010 was 58.12 degrees compared to 57.0 F (13.9°C) as the average for all of 20th century. 2010 was also the wettest year on record.
The rise in Earths’ global temperature has been accompanied by a decline in arctic sea ice. Specifically, surface air temperatures in the arctic were warmer than normal during the summer of 2010. The sea ice extent measured in September 2010, was the 3rd lowest on record since accurate monitoring began in 1979, states NOAA in the annual Arctic report card. See Video below.
Scientists from NOAA’s National Climatic Data Center (NCDC) in Asheville, N.C. and NASA’s Goddard Institute for Space Studies (GISS) in New York City announced the findings on Jan 12. The temperature data are collected by weather stations that span across the globe.
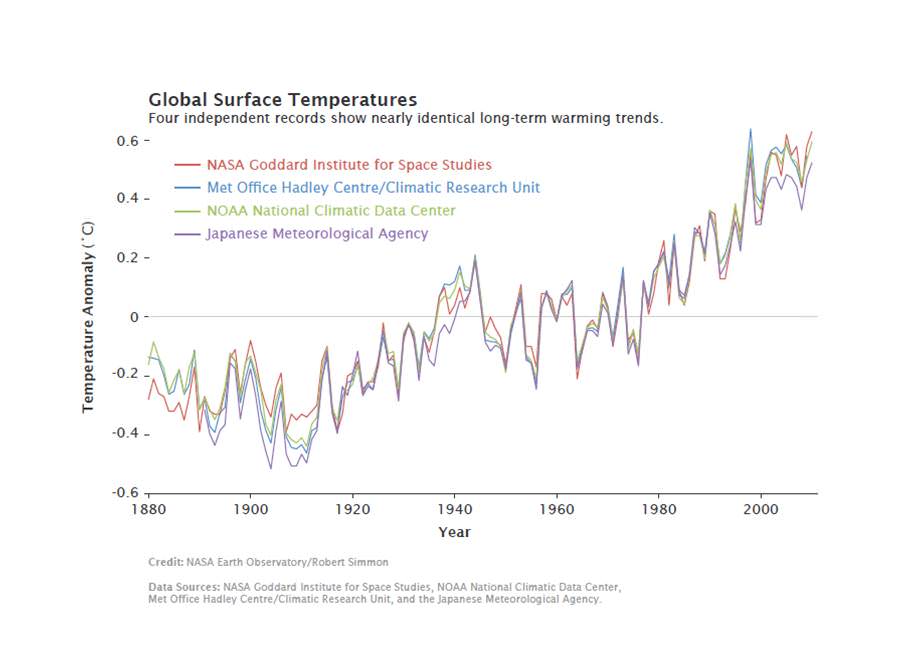
Global measurements by independent researchers in the UK at the Met Office Hadley Centre and at the Japanese Meteorological Agency closely match the trend of warming temperatures gathered by NOAA NCDC and NASA GISS.
The graphic below combines the actual temperature data collected independently by the four research agencies. The temperature trend lines are remarkably consistent.
Multiple institutions monitor global surface temperatures. Despite subtle differences in the ways the scientists perform their analyses, these four widely referenced records show remarkable agreement. Credit: NASA Earth Observatory/Robert Simmon
Much of the rise in global temperatures has taken place since the late 1970’s, says NASA. The rate of increase has been about 0.36 F per decade. The NASA GISS weather data were collected using over 1000 meteorological stations around the world, satellite observations of sea surface temperature and Antarctic research station measurements.
2010 average annual temperature ranks by state in the US. Credit: NOAA
The data are fed into a computer program which then calculates temperature anomalies — the difference between surface temperature in a given month and the average temperature for the same period during 1951 to 1980. NASA GISS uses that three-decade period as the baseline for analysis against which climate change can be tracked. NOAA uses the entire 20th century.
For the contiguous United States, NOAA analysis shows that “2010 was the 14th consecutive year with an annual temperature above the long-term average. Since 1895, the temperature across the US has increased at an average rate of approximately 0.12 F per decade.”
There are large areas in the Arctic without weather stations. NASA GISS approaches the problem by filling in gaps with data from the nearest land stations. The Climatic Research Unit at the University of East Anglia, which works jointly with the Met Office Hadley Centre, leaves much of the region out of its global temperature analysis. Credit: NASA Earth Observatory/Robert Simmon2010 Global Significant Weather and Climate Events. Credit: NOAA Global Temperatures.
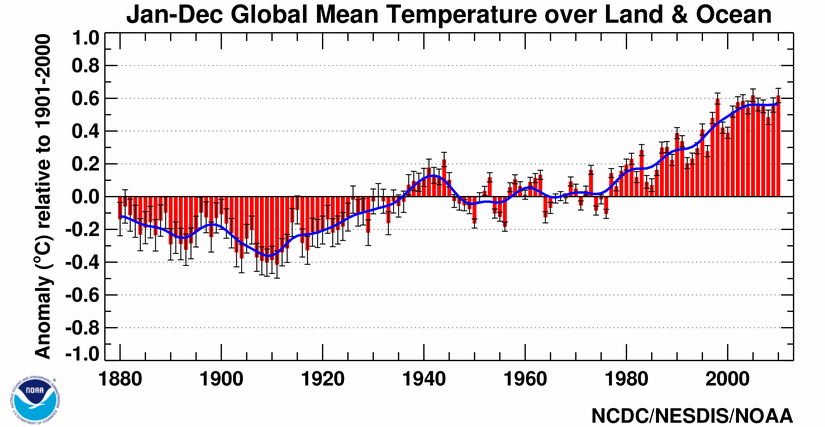
The year 2010 tied with 2005 as the warmest year since records began in 1880. The annual global combined land and ocean surface temperature was 0.62°C (1.12°F) above the 20th century average. The range associated with this value is plus or minus 0.07°C (0.13°F). The 2010 combined land and ocean surface temperature in the Northern Hemisphere was also the warmest on record, while the combined land and ocean surface temperature in the Southern Hemisphere was the sixth warmest such period on record. Credit: NOAA
Greenhouse Effect vs. Enhanced Greenhouse Effect. Image Credit: environment.act.gov.au
Every day, solar radiation reaches the surface of our planet from the sun. It is then converted into thermal radiation which is then absorbed by atmospheric greenhouse gases (such as carbon dioxide) and is re-radiated in all directions. Known as the Greenhouse Effect, this process is essential to life as we know it. Without it, Earth’s surface temperature would be significantly lower and many life forms would cease to exist. However, where human agency is involved, this effect has been shown to have a downside. Indeed, when excess amounts of greenhouse gases are put into the atmosphere, this natural warming effect is boosted to the point where it can have damaging, even disastrous consequences for life here on Earth. This process is known as the Enhanced Greenhouse Effect, where the natural process of warming caused by solar radiation and greenhouse gases is heightened by anthropogenic (i.e. human) factors.
The effect of CO2 and other greenhouse gases on the global climate was first publicized in 1896 by Swedish scientist Svante Arrhenius. It was he that first developed a theory to explain the ice ages, as well as the first scientist to speculate that changes in the levels of carbon dioxide in the atmosphere could substantially alter the surface temperature of the Earth. This was expanded upon in the mid-20th century by Guy Stewart Callendar, an English steam engineer and inventor who was also interested in the link between increased CO2 levels in the atmosphere and rising global temperatures. Thanks to his research in the field, the link between the two came to be known for a time as the “Callendar effect”.
As the 20th century rolled on, a scientific consensus emerged that recognized this phenomenon as a reality and increasingly urgent problem. Relying on ice core data, atmospheric surveys performed by NASA, the Mauna Loa observatory and countless other research institutes all over the planet, scientists now believe there is a direct link between human agency and the rise in global mean temperatures over the fifty and even two-hundred years. This is due largely to increased production of CO2 through fossil fuel burning and other activities such as cement production and tropical deforestation. In addition, methane production has also been successfully linked to an increase in global temperatures, which is the result of growing consumption of meat and the need to clear large areas of tropical rainforests in order to make room for pasture land.
According to the latest Assessment Report from the Intergovernmental Panel on Climate Change which was released in 2007, “most of the observed increase in globally averaged temperatures since the mid-20th century is very likely due to the observed increase in anthropogenic greenhouse gas concentrations”. If left unchecked, it is unclear what the exact consequences would be, but most scenarios predict a steep drop in worldwide food production, widespread drought, glacial depletion, the near to total depletion of the polar ice cap, and the possibility that the process could become irreversible.
Getting toasty in here!
We have written many articles about enhanced greenhouse effect for Universe Today. Here’s an article about greenhouse effect, and here’s an article about atmospheric gases.
If you’d like more info on Enhanced Greenhouse Effect, check out these articles from USA Today and Earth Observatory.
We’ve also recorded an episode of Astronomy Cast all about planet Earth. Listen here, Episode 51: Earth.
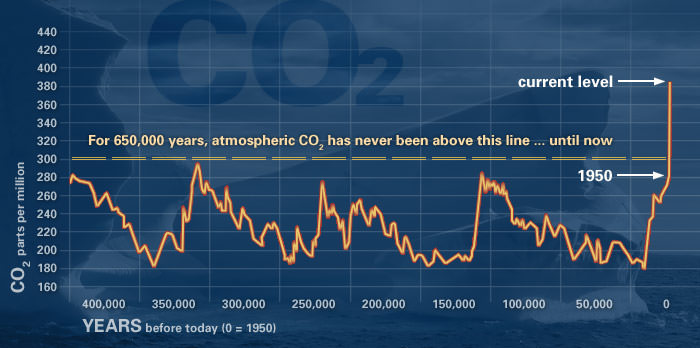
This graph, based on the comparison of atmospheric samples contained in ice cores and more recent direct measurements, provides evidence that atmospheric CO2 has increased since the Industrial Revolution. (Source: NOAA)
[/caption]
The body of evidence for climate change is strong and convincing, and multiple lines of evidence show the changes are caused largely by human activities. The consensus among scientists about the reality of the phenomenon is also convincing.
But from the nature of public discussions on the subject today – at least in the US – that consensus might not be apparent. And somehow the discussion has become a “debate,” which is often divided down political party lines.
“We have to make it clear that the ice sheets are not Republicans or Democrats – they don’t have a political agenda as they disappear,” said Michael Mann, a physicist at Pennsylvania State University, who has been at the recent forefront of climate research. “Certain facts cannot be denied. We have to find a way to steer the conversation to a good faith debate about what we can do about the problem, not this bad faith debate about the reality of it.”
Why has the public discourse become so polarizing and why is there a fair amount of legislators and the public who now think that climate change is an elaborate hoax?
Michael Mann, Professor Director, Earth System Science Center, Pennsylvania State University. Credit: PSU
Mann referred specifically to an infamous memo sent out by GOP political consultant Frank Luntz in 2002 to President George Bush, “which basically said that if the public comes to understand the reality of this problem they will demand policy action to deal with it,” Mann said, “and so you need to manufacture doubt and controversy and uncertainty and cultivate a set of scientists who can act for advocates essentially for fossil fuel industry. And that is what is happened.”
And the science became politicized. “If you can politicize something in today’s political environment,” Mann continued, “you can immediately get half the population on your side. Unfortunately the forces of anti-science — those who deny the science — have been very effective in politicizing the framing.”
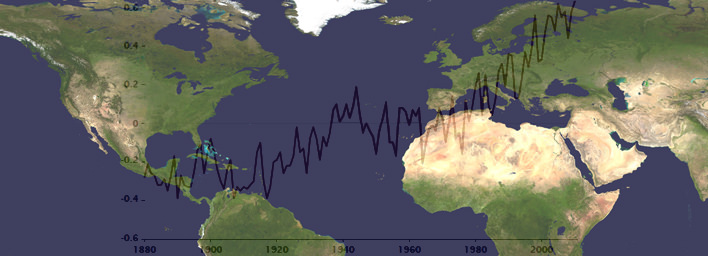
Line plot of global mean land-ocean temperature index, 1880 to present, with the base period 1951-1980. The dotted black line is the annual mean and the solid red line is the five-year mean. The green bars show uncertainty estimates. Credit: NASA
But thousands of scientists from almost 200 countries around the world agreed on the most recent Intergovernmental Panel on Climate Change (IPCC) report which said most of the observed increases in global average temperatures is very likely due to the observed increase in anthropogenic greenhouse gas concentrations. Additionally, the US National Academy of Sciences, the National Academies of all the G-8 nations, the American Association for the Advancement of Science and several other scientific bodies have all issued equivalent statements of consensus of the reality of human-caused climate change.
“Certain facts cannot be denied because you don’t like the implications,” Mann said.
Mann is probably best known for known for his “hockey stick” reconstruction of past climate, (Nature, 1998) which shows the world is warmer now than it has been for at least 1000 years. The “hockey stick” has been attacked by climate change deniers, and while new research has better defined the data, it has not been disproven, nor is it the only line of evidence for global warming.
“The hockey stick is not ‘the’ pillar of evidence for the reality of climate change,” Mann said. “There are multiple pillars that include just the basic understanding of chemistry and physics. But it is one of the more visually compelling pieces of evidence for warming.”
The 'hockey stick' chart from the Intergovernmental Panel on Climate Change Third Assessment Report in 2001.
Mann conceded that various other studies and reconstructions of past climate data don’t agree entirely and that there are uncertainties of how much warming will continue because the predictions are based on models, which attempt to predict the future.
“There are legitimate uncertainties, but unfortunately the public discourse is so far removed from where the scientific discourse and controversies actually are, “Mann said. “There is not an uncertainty of the reality of climate change, that sea levels are going to rise, that arctic sea ice will be gone in a few decades or a whole lot of other areas, but we do have an uncertainty in our ability to project regional climate change.”
Mann said scientists don’t completely understand the El Nino and La Nina affects, how cloud feedback will influence the warming and other modeling issues.
However, Mann said, the science has improved over the past few years, and still, there is enough evidence for not just a hockey stick, but an entire hockey league.
“Every reconstruction reveals that the warming is indeed anomalous in a very long term context. Global temperatures are running the highest they have ever run. The twelve month running averages are warmer than they have ever been in documented history. There is no cooling of the globe and no decline to hide,” Mann said referring to the “Climategate” emails that were stolen from East Anglia climate research center and leaked just a few weeks before the Copenhagen climate summit in late 2009.
“Hackers stole thousands of emails –private correspondences between scientists,” said Mann, “and their words were cherry picked, taken out of context and distorted to make it sound like scientists were engaged in some sort of hoax.”
‘Hide the decline’ actually meant the scientists were going to remove unreliable tree-ring data, not cover up any decline in temperatures.
Mann said the real crime was the illegal theft of private correspondence, in addition to the moral crime of intentionally distorting what scientists believe and think.
Mann took his audience to task by saying, “I’d like to say the mainstream media recognized the manufactured controversy for what is was, but they didn’t, entirely.” He also admitted that scientists have not done all they could in the past to make the science clear and their words convincing.
But looking at the current political climate, Mann asked for journalists’ help in the future.
“No doubt we are in for a period of months or even years where climate science is likely to be subject to the sort of politically motivated inquisition that we haven’t seen, frankly, since the 1950’s,” he said. “It is necessary and important for the scientific community to do the best it I can to defend itself from this oncoming attack, and frankly, we are entirely reliant on the willingness of the mainstream media to serve in its role as the critical and independent arbiter and not just report the two sides of the so-called debate, but to actually establish what is fact and what is fiction. The scientists will not be successful against the attack that is coming unless the media is serving its role.”
Mann ended his talk with a picture of his daughter enthralled by a polar bear at a zoo. “I don’t want to have to tell my daughter that polar bears became extinct because we failed to counter a well funded effort to distract the public,” he said.
————————————
Note: For any reader who thinks they need to leave a comment to debate the climate change science, before posting, please take a look at the following information:
High concentrations of carbon dioxide (in red) tend to congregate in the northern hemisphere during colder months, when plants can't absorb as much from the atmosphere. This picture is based on a NASA Goddard computer model from ground-based observations and depicts concentrations on March 30, 2006. Credit: NASA's Goddard Space Flight Center/B. Putman/YouTube (screenshot)
What if it were possible to just suck all the harmful pollutants out of the air so that they wouldn’t be such a nuisance? What if it were also possible to convert these atmospheric pollutants back into fossil fuels, or possibly ecologically-friendly bio fuels? Why, then we would be able to worry far less about smog, respiratory illnesses, and the effects that high concentrations of these gases have on the planet.
This is the basis of Carbon Capture, a relatively new concept where carbon dioxide is captured at point sources – such as factories, natural-gas plants, fuel plants, major cities, or any other place where large concentrations of CO² are known to be found. This CO² can then be stored for future use, converted into biofuels, or simply put back into the Earth so that it doesn’t enter the atmosphere.
Description:
Like many other recent developments, carbon capture is part of a new set of procedures that are collectively known as geoengineering. The purpose of these procedures are to alter the climate to counteract the effects of global warming, generally by targeting one of the chief greenhouse gases. The technology has existed for some time, but it has only been in recent years that it has been proposed as a means of combating climate change as well.
Schematic showing both terrestrial and geological sequestration of carbon dioxide emissions from a coal-fired plant. Credit: web.ornl.gov
Currently, carbon capture is most often employed in plants that rely on fossil fuel burning to generate electricity. This process is performed in one of three basic ways – post-combustion, pre-combustion and oxy-fuel combustion. Post-combustion involves removing CO2 after the fossil fuel is burned and is converted into a flue gas, which consists of CO2, water vapor, sulfur dioxides and nitrogen oxide.
When the gases travel through a smokestack or chimney, CO² is captured by a “filter” which actually consists of solvents that are used to absorb CO2 and water vapor. This technique is effective in that such filters can be retrofitted to older plants, avoiding the need for a costly power plant overhaul.
Benefits and Challenges:
The results of these processes have so far been encouraging – which boast the possibility of up to 90 % of CO² being removed from emissions (depending on the type of plant and the method used). However, there are concerns that some of these processes add to the overall cost and energy consumption of power plants.
According to 2005 report by the Intergovernmental Panel on Climate Change (IPCC), the additional costs range from 24 to 40% for coal power plants, 11 to 22% for natural gas plants, and 14 to 25% for coal-based gasification combined cycle systems. The additional power consumption also creates more in the way of emissions.
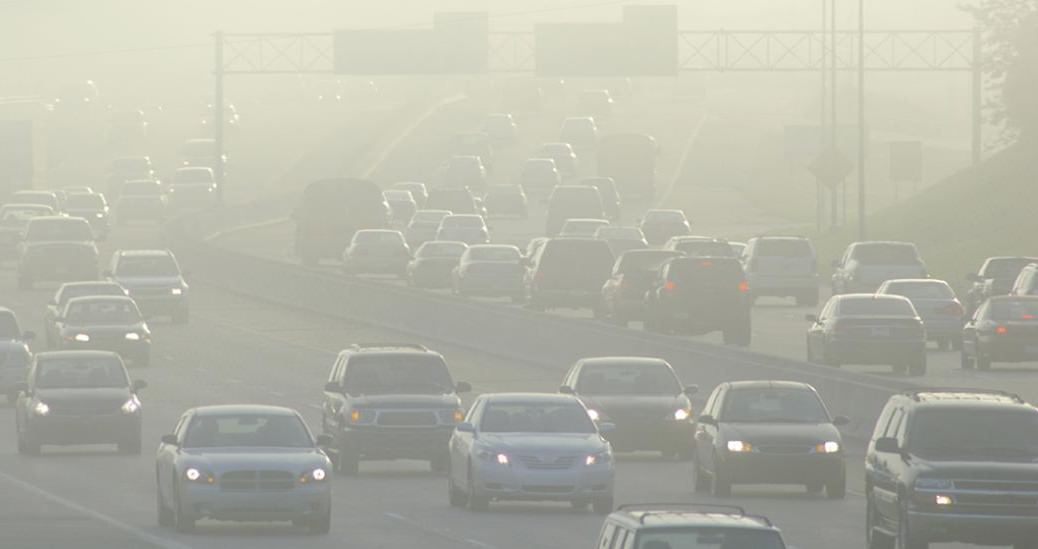
Vehicle emissions are one of the main sources of carbon dioxide today. Credit: ucsusa.org
In addition, while CC operations are capable of drastically reducing CO², they can add other pollutants to the air. The amounts of kind of pollutants depend on the technology, and range from ammonia and nitrogen oxides (NO and NO²) to sulfur oxides and disulfur oxides (SO, SO², SO³, S²O, S²O³. etc.). However, researchers are developing new techniques which they hope will reduce both costs and consumption and not generate additional pollutants.
Examples:
A good example of the Carbon Capture process is the Petro Nova project, a coal-fired power plant in Texas. This plant began being upgraded by the US Dept. of Energy (DOE) in 2014 to accommodate the largest post-combustion carbon-capture operation in the world.
Consisting of filters that would capture the emissions, and infrastructure that would place it back in the Earth, the DOE estimates that this operation will be capable of capturing 1.4 million tons of CO2 that previously would have been released into the air.
In the case of pre-combustion, CO² is trapped before the fossil fuel is even burned. Here, coal, oil or natural gas is heated in pure oxygen, resulting in a mix of carbon monoxide and hydrogen. This mix is then treated in a catalytic converter with steam, which then produces more hydrogen and carbon dioxide.
When complete, the US Department of Energy’s (DoE) Petro Nova will be the largest post-combustion carbon capture operation in the world. Credit: DOE
These gases are then fed into flasks where they are treated with amine (which binds with the CO² but not hydrogen); the mixture is then heated, causing the CO² to rise where it can be collected. In the final process (oxy-fuel combustion), fossil fuel is burned in oxygen, resulting in a gas mixture of steam and CO². The steam and carbon dioxide are separated by cooling and compressing the gas stream, and once separated, the CO² is removed.
Other efforts at carbon capture include building urban structures with special facilities to extract CO² from the air. Examples of this include the Torre de Especialidades in Mexico City – a hospital that is surrounded by a 2500 m² facade composed of Prosolve370e. Designed by Berlin-based firm Elegant Embellishments, this specially-shaped facade is able to channel air through its lattices and relies on chemical processes to filter out smog.
China’s Phoenix Towers – a planned-project for a series of towers in Wuhan, China (which will also be the world’s tallest) – is also expected to be equipped with a carbon capture operation. As part of the designers vision of creating a building that is both impressively tall and sustainable, these include special coatings on the outside of the structures that will draw CO² out of the local city air.
Then there’s the idea for “artificial trees“, which was put forward by Professor Klaus Lackner of the Department of Earth and Environmental Engineering at Columbia University. Consisting of plastic fronds that are coated with a resin that contains sodium carbonation – which when combined with carbon dioxide creates sodium bicarbonate (aka. baking soda) – these “trees” consume CO² in much the same way real trees do.
A cost-effective version of the same technology used to scrub CO² from air in submarines and space shuttles, the fronds are then cleaned using water which, when combined with the sodium bicarbonate, yields a solution that can easily be converted into biofuel.
In all cases, the process of Carbon Capture comes down to finding ways to remove harmful pollutants from the air to reduce humanity’s footprint. Storage and reuse also enter into the equation in the hopes of giving researchers more time to develop alternative energy sources.
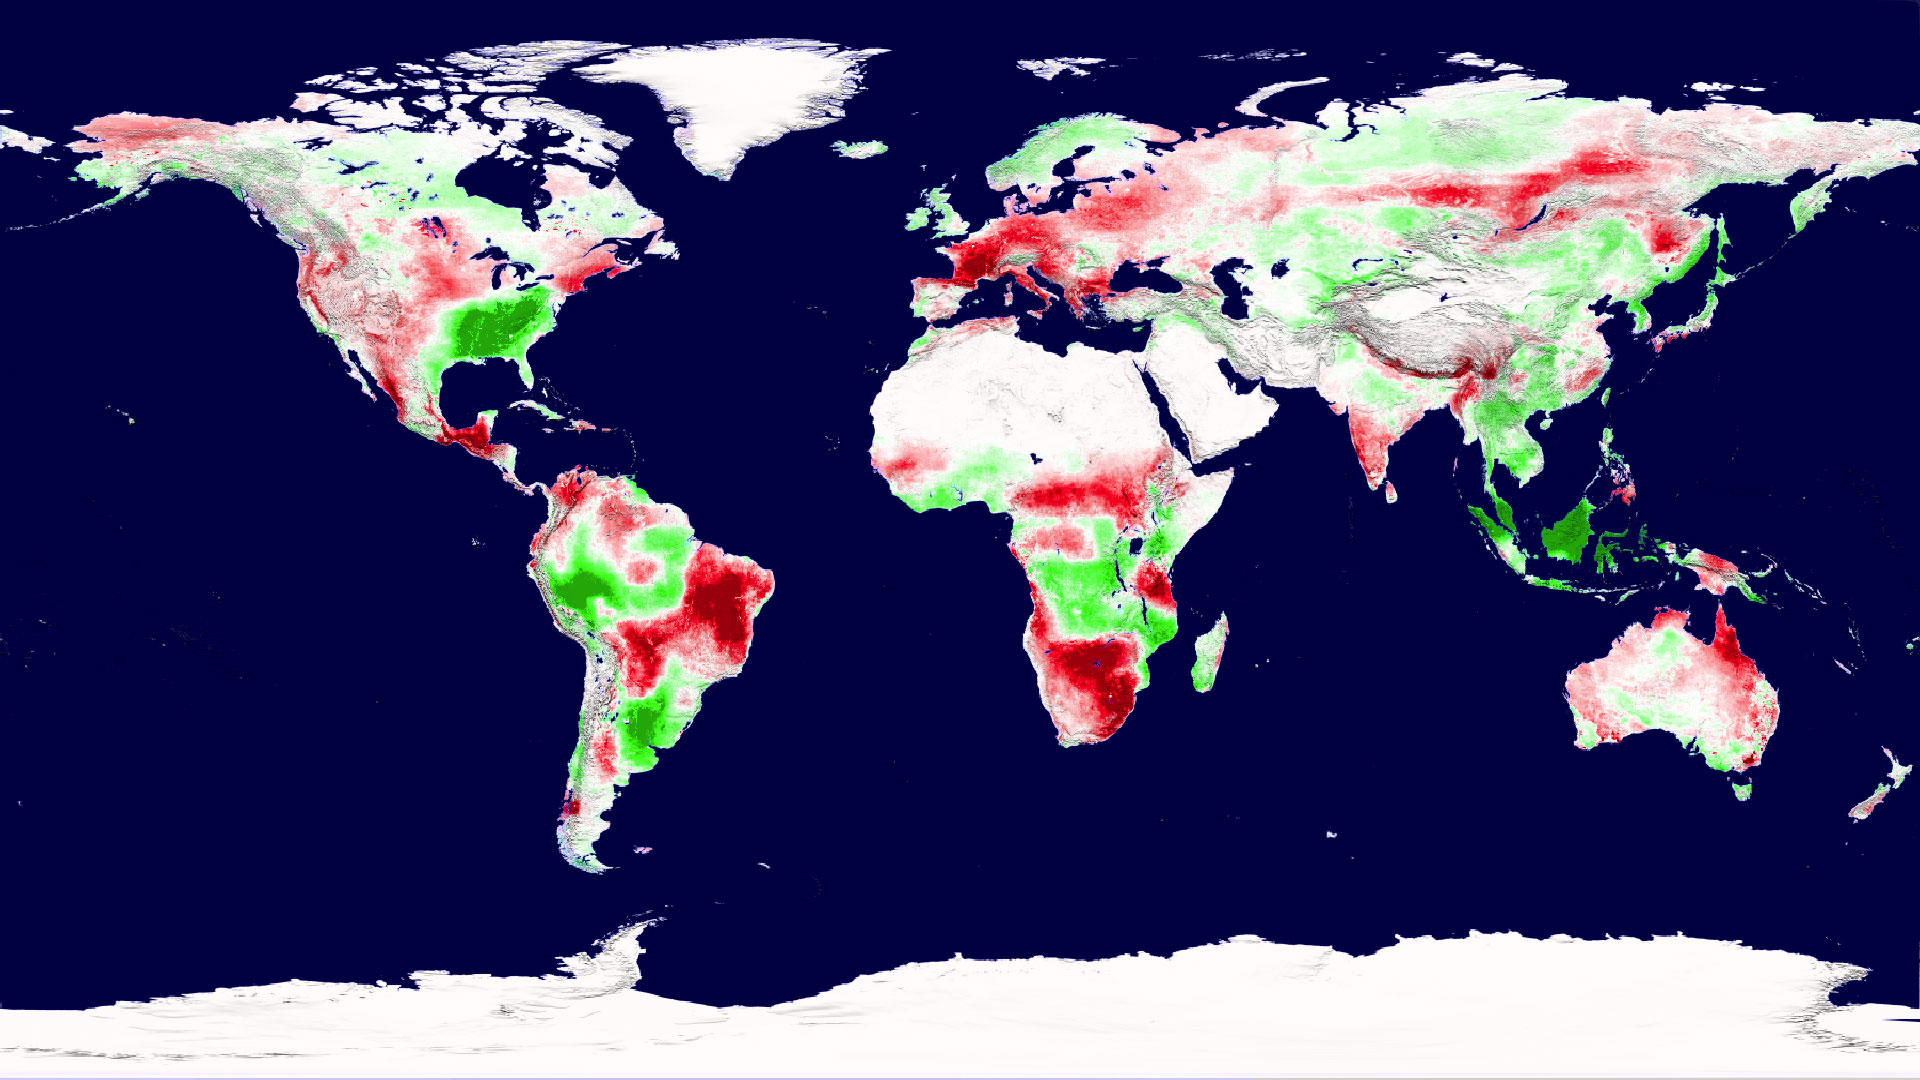
Caption: A snapshot of Earth's plant productivity in 2003 shows regions of increased productivity (green) and decreased productivity (red). Credit: NASA Goddard Space Flight Center Scientific Visualization Studio
[/caption]
One idea about climate change suggested that higher temperatures would boost plant growth and food production. That may have been a trend for awhile, where plant growth flourished with a longer growing season, but the latest analysis of satellite data shows that rising global temperatures has reached a tipping point where instead of being beneficial, higher temperatures are causing drought, which is now decreasing plant growth on a planetary scale. This could impact food security, biofuels, and the global carbon cycle. “This is a pretty serious warning that warmer temperatures are not going to endlessly improve plant growth,” said Steven Running from the University of Montana.
During the 1980s and 1990s global terrestrial plant productivity increased as much as six percent. Scientists say that happened because during that time, temperature, solar radiation and water availability — influenced by climate change — were favorable for growth.
During the past ten years, the decline in global plant growth is slight – just one percent. But it may signify a trend.
Interannual shifts in plant productivity (green line) fluctuated in step with shifts in atmospheric carbon dioxide (red line) between 2000 through 2009. Credit: Maosheng Zhao and Steven Running
“These results are extraordinarily significant because they show that the global net effect of climatic warming on the productivity of terrestrial vegetation need not be positive — as was documented for the 1980’s and 1990’s,” said Diane Wickland, of NASA Headquarters and manager of NASA’s Terrestrial Ecology research program.
A 2003 paper in Science led by then University of Montana scientist Ramakrishna Nemani (now at NASA Ames Research Center, Moffett Field, Calif.) showed that land plant productivity was on the rise.
Running and co-author Maosheng Zhao originally set out to update Nemani’s analysis, expecing to see similar results as global average temperatures have continued to climb. Instead, they found that the impact of regional drought overwhelmed the positive influence of a longer growing season, driving down global plant productivity between 2000 and 2009.
The discovery comes from an analysis of plant productivity data from the Moderate Resolution Imaging Spectroradiometer (MODIS) on NASA’s Terra satellite, combined with growing season climate variables including temperature, solar radiation and water. The plant and climate data are factored into an algorithm that describes constraints on plant growth at different geographical locations.
For example, growth is generally limited in high latitudes by temperature and in deserts by water. But regional limitations can vary in their degree of impact on growth throughout the growing season.
Zhao and Running’s analysis showed that since 2000, high-latitude northern hemisphere ecosystems have continued to benefit from warmer temperatures and a longer growing season. But that effect was offset by warming-associated drought that limited growth in the southern hemisphere, resulting in a net global loss of land productivity.
“This past decade’s net decline in terrestrial productivity illustrates that a complex interplay between temperature, rainfall, cloudiness, and carbon dioxide, probably in combination with other factors such as nutrients and land management, will determine future patterns and trends in productivity,” Wickland said.
The researchers plan on maintaining a record of the trends into the future. For one reason, plants act as a carbon dioxide “sink,” and shifting plant productivity is linked to shifting levels of the greenhouse gas in the atmosphere. Also, stresses on plant growth could challenge food production.
“The potential that future warming would cause additional declines does not bode well for the ability of the biosphere to support multiple societal demands for agricultural production, fiber needs, and increasingly, biofuel production,” Zhao said.
“Even if the declining trend of the past decade does not continue, managing forests and croplands for multiple benefits to include food production, biofuel harvest, and carbon storage may become exceedingly challenging in light of the possible impacts of such decadal-scale changes,” Wickland said.
The team published their findings Aug. 20 in Science.
We keep finding all these exoplanets. Our detection methods still only pick out the bigger ones, but we’re getting better at this all the time. One day in the not-too-distant future it is conceivable that we will find one with a surface gravity in the 1G range – orbiting its star in, what we anthropomorphically call, the Goldilocks zone where water can exist in liquid phase.
So let’s say we find such a planet and then direct all our SETI gear towards it. We start detecting faint morse-code like beeps – inscrutable, but clearly of artificial origin. Knowing us, we’ll send out a probe. Knowing us, there will be a letter campaign demanding that we adhere to the Prime Directive and consequently this deep space probe will include some newly developed cloaking technology, so that it will arrive at the Goldilocks planet invisible and undetectable.
The probe takes quite a while to get there and, in transit, receives indications that the alien civilization is steadily advancing its technology as black and white sitcoms start coming through – and as all that is relayed back to us we are able to begin translating their communications into a range of ‘dialects’.
By the time the probe has arrived and settles into an invisible orbit, it’s apparent a problem is emerging on the planet. Many of its inhabitants have begun expressing concern that their advancing technology is beginning to have planetary effects, with respect to land clearing and atmospheric carbon loading.
From our distant and detached viewpoint we are able to see that anyone on the planet who thinks they live in a stable and unchanging environment just isn’t paying attention. There was a volcano just the other week and their geologists keep finding ancient impact craters which have revised whole ecosystems in their planet’s past.
It becomes apparent that the planet’s inhabitants are too close the issues to be able to make a dispassionate assessment about what’s happening – or what to do about it. They are right that their technological advancement has bumped up the CO2 levels from 280ppm to over 380ppm within only 150 years – and to a level much higher than anything detectable in their ice core data, which goes back half a million years. But that’s about where the definitive data ends.
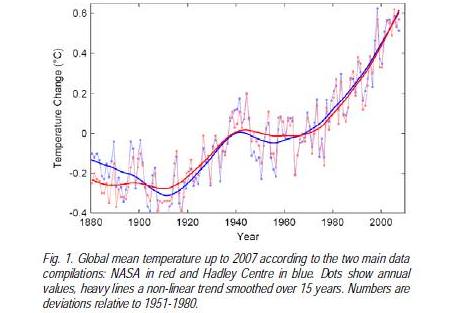
Credit: Rahstorf. NASA data is from the GISS Surface Temperature Analysis. Hadley Centre data is from the Met Office Hadley Centre, UK.
Advocates for change draw graphs showing temperatures are rising, while conservatives argue this is just cherry-picking data from narrow time periods. After all, a brief rise might be lost in the background noise of a longer monitoring period – and just how reliable is 150 year old data anyway? Other more pragmatic individuals point to the benefits gained from their advanced technology, noting that you have to break a few eggs to make an omelet (or at least the equivalent alien cuisine).
Back on Earth our future selves smile wryly, having seen it all before. As well as interstellar probes and cloaking devices, we have developed a reliable form of Asimovian psychohistory. With this, it’s easy enough to calculate that the statistical probability of a global population adopting a coordinated risk management strategy in the absence of definitive, face-slapping evidence of an approaching calamity is exactly (datum removed to prevent corrupting the timeline).
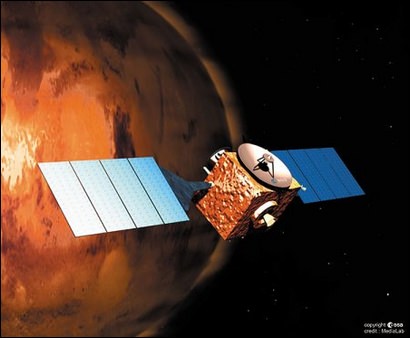
An illustration showing the ESA's Mars Express mission. Credit: ESA/Medialab)
Understanding the present-day Martian climate gives us insights into its past climate, which in turn provides a science-based context for answering questions about the possibility of life on ancient Mars.
Our understanding of Mars’ climate today is neatly packaged as climate models, which in turn provide powerful consistency checks – and sources of inspiration – for the climate models which describe anthropogenic global warming here on Earth.
But how can we work out what the climate on Mars is, today? A new, coordinated observation campaign to measure ozone in the Martian atmosphere gives us, the interested public, our own window into just how painstaking – yet exciting – the scientific grunt work can be.
[/caption]
The Martian atmosphere has played a key role in shaping the planet’s history and surface. Observations of the key atmospheric components are essential for the development of accurate models of the Martian climate. These in turn are needed to better understand if climate conditions in the past may have supported liquid water, and for optimizing the design of future surface-based assets at Mars.
Ozone is an important tracer of photochemical processes in the atmosphere of Mars. Its abundance, which can be derived from the molecule’s characteristic absorption spectroscopy features in spectra of the atmosphere, is intricately linked to that of other constituents and it is an important indicator of atmospheric chemistry. To test predictions by current models of photochemical processes and general atmospheric circulation patterns, observations of spatial and temporal ozone variations are required.
The Spectroscopy for Investigation of Characteristics of the Atmosphere of Mars (SPICAM) instrument on Mars Express has been measuring ozone abundances in the Martian atmosphere since 2003, gradually building up a global picture as the spacecraft orbits the planet.
These measurements can be complemented by ground-based observations taken at different times and probing different sites on Mars, thereby extending the spatial and temporal coverage of the SPICAM measurements. To quantitatively link the ground-based observations with those by Mars Express, coordinated campaigns are set up to obtain simultaneous measurements.
Infrared heterodyne spectroscopy, such as that provided by the Heterodyne Instrument for Planetary Wind and Composition (HIPWAC), provides the only direct access to ozone on Mars with ground-based telescopes; the very high spectral resolving power (greater than 1 million) allows Martian ozone spectral features to be resolved when they are Doppler shifted away from ozone lines of terrestrial origin.
A coordinated campaign to measure ozone in the atmosphere of Mars, using SPICAM and HIPWAC, has been ongoing since 2006. The most recent element of this campaign was a series of ground-based observations using HIPWAC on the NASA Infrared Telescope Facility (IRTF) on Mauna Kea in Hawai’i. These were obtained between 8 and 11 December 2009 by a team of astronomers led by Kelly Fast from the Planetary Systems Laboratory, at NASA’s Goddard Space Flight Center (GSFC), in the USA. Credit: Kelly Fast About the image: HIPWAC spectrum of Mars’ atmosphere over a location on Martian latitude 40°N; acquired on 11 December 2009 during an observation campaign with the IRTF 3 m telescope in Hawai’i. This unprocessed spectrum displays features of ozone and carbon dioxide from Mars, as well as ozone in the Earth’s atmosphere through which the observation was made. Processing techniques will model and remove the terrestrial contribution from the spectrum and determine the amount of ozone at this northern position on Mars.
The observations had been coordinated in advance with the Mars Express science operations team, to ensure overlap with ozone measurements made in this same period with SPICAM.
The main goal of the December 2009 campaign was to confirm that observations made with SPICAM (which measures the broad ozone absorption spectra feature centered at around 250 nm) and HIPWAC (which detects and measures ozone absorption features at 9.7 μm) retrieve the same total ozone abundances, despite being performed at two different parts of the electromagnetic spectrum and having different sensitivities to the ozone profile. A similar campaign in 2008, had largely validated the consistency of the ozone measurement results obtained with SPICAM and the HIPWAC instrument.
The weather conditions and the seeing were very good at the IRTF site during the December 2009 campaign, which allowed for good quality spectra to be obtained with the HIPWAC instrument.
Kelly and her colleagues gathered ozone measurements for a number of locations on Mars, both in the planet’s northern and southern hemisphere. During this four-day campaign the SPICAM observations were limited to the northern hemisphere. Several HIPWAC measurements were simultaneous with observations by SPICAM allowing a direct comparison. Other HIPWAC measurements were made close in time to SPICAM orbital passes that occurred outside of the ground-based telescope observations and will also be used for comparison.
The team also performed measurements of the ozone abundance over the Syrtis Major region, which will help to constrain photochemical models in this region.
Analysis of the data from this recent campaign is ongoing, with another follow-up campaign of coordinated HIPWAC and SPICAM observations already scheduled for March this year.
Putting the compatibility of the data from these two instruments on a firm base will support combining the ground-based infrared measurements with the SPICAM ultraviolet measurements in testing the photochemical models of the Martian atmosphere. The extended coverage obtained by combining these datasets helps to more accurately test predictions by atmospheric models.
It will also quantitatively link the SPICAM observations to longer-term measurements made with the HIPWAC instrument and its predecessor IRHS (the Infrared Heterodyne Spectrometer) that go back to 1988. This will support the study of the long-term behavior of ozone and associated chemistry in the atmosphere of Mars on a timescale longer than the current missions to Mars.
It happens every winter, and even more so during the recent cold snap here in the US: frequently people say, “Well, so much for global warming! Guess that’s not an issue anymore!” But there’s only one way to respond to that: “WRONG.”
I was going to write an article about the difference between climate and weather, but I came across a great video series on You Tube called Climate Denial Crock of the Week, put together by Peter Sinclair, a longtime advocate of environmental awareness and energy alternatives, and Sinclair says everything better than I could. This video takes the 10-second sound bites used by those who deny climate change is occurring, and intelligently breaks them down one by one. Continue reading “Climate Vs. Weather Video”
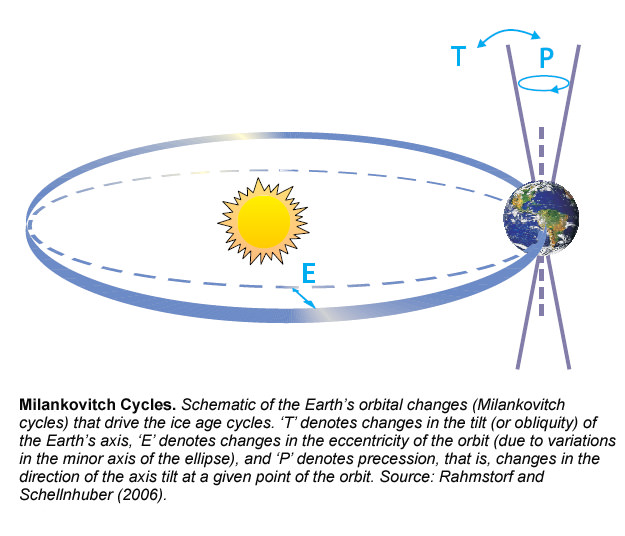
Ice cores and deep sea bed cores provide the best available record of changes in global temperature and CO2 content of the atmosphere going back 800,000 years. The data shows a clear periodicity in global temperatures which is thought to be linked to the Milankovitch cycle.
Back in 1920, Milutin Milankovitch, a Serbian mathematician, proposed that fine changes in Earth’s orbit around the Sun could explain an approximately 100,000 year cycle in glaciation seen from geological evidence. The tilt of the Earth’s axis swings slightly over a 41,000 year cycle – the eccentricity of Earth’s orbit moves from almost circular to more elliptical and back again over a 413,000 year cycle – and overlaying that you have not only the precession of the equinoxes, which is an inherent wobble in the Earth’s axial spin over a 26,000 year cycle, but also a precession of the whole of Earth’s orbit over a 23,000 year cycle.
Ice core data does show a rough concordance between glaciation and the synchronicity of these orbital cycles. Even though there’s no significant change in the mean amount of solar radiation reaching the Earth over the period of its annual orbit – the orbital changes can lead to increased polar shadowing and cooling.
Once ice does start advancing from the poles, a positive feedback loop can develop – since more ice increases the albedo of Earth’s surface and reflects more of the Sun’s heat back into space, thus reducing mean global temperatures.
It’s thought that what limits the ice advancing is increasing CO2 in the atmosphere – which can be measured from trapped bubbles of air in the ice cores. More ice formation leads to less exposed land area for photosynthesis and silicate rock weathering to remove CO2 from the atmosphere. So the more ice that’s formed, the more CO2 accumulates in the atmosphere – which causes mean global temperatures to rise, which limits ongoing ice formation.
Of course the opposite is true in an ice-melting phase. Ice melting also follows a positive feedback loop since less ice means less albedo, meaning less solar radiation is reflected back into space and mean global temperatures rise. But again, CO2 becomes the limiting factor. With more exposed land, more CO2 is drawn from the atmosphere by photosynthesizing forests and rock weathering. A consequent drop in atmospheric CO2 cools the planet and hence limits ongoing ice melting.
But there lies the rub. We are in an ice-melting phase of the Milankovitch cycle now, where the Earth’s orbit is closer to circular and the Earth’s tilt is closer to perpendicular. But CO2 levels aren’t declining – partly because we’ve chopped a lot of trees and forests down, but mostly because of anthropogenic CO2 production. Without the limiting factor of declining CO2 we’ve seen in previous Milankovitch cycles, presumably the ice is just going to keep on melting as the albedo of the Earth surface declines.
So you might want to rethink that next coastal real estate purchase – or hope for the best from Copenhagen.
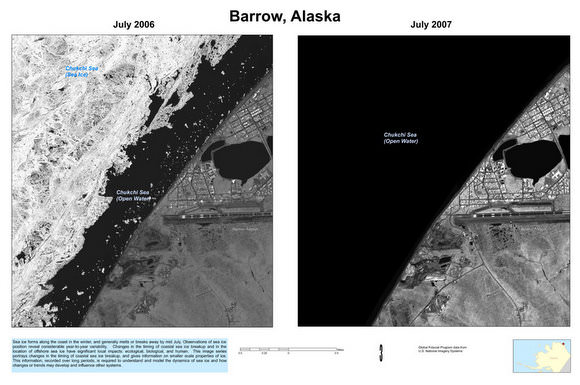
Ice loss in Barrow Alaska from 2006 to 2007. Credit: US Geological Survey
[/caption]
Last week the US government released more than a thousand intelligence images of Arctic ice that have been used to help scientists study the impact of climate change. The images were taken by spy satellites, as part of the Medea program, which lets scientists request spy pictures from environmentally sensitive locations around the world. After they were taken, the Bush Administration released the photographs to the scientists but deemed them “unsuitable for public release.” Earlier this month, the National Academy of Sciences recommended the Obama Administration declassify the photos, which they did within a few hours of the recommendation.
Various blogs are saying these dramatic images are faked, but since they are available through the US Geological Survey , that hardly seems likely. Over 700 images show changes of sea ice in various recent years from six sites around the Arctic Ocean, with an additional 500 images of 22 sites in the United States.
Ice loss in the Beaufort Sea. Credit: USGS
Scientists request ice pictures to be taken by intelligence satellites because the resolution is much greater, in some cases, than other available satellite images. According to Reuters, the newly declassified Arctic images have a resolution of about 1 yard (1 meter), a vast improvement on previously available pictures of sea ice which have a resolution between 15 and 30 meters. Ice loss at the Bering Glacier. Credit: USGS


 fluctuated in step with shifts in atmospheric carbon dioxide (red line) between 2000 through 2009. Credit: Maosheng Zhao and Steven Running")


 So you might want to rethink that next coastal real estate purchase – or hope for the best from