Image showing nearly 50,000 galaxies in the nearby universe detected by the Two Micron All Sky Survey (2MASS) in infrared light. Credit: 2MASS/ T. H. Jarrett/J. Carpenter/R. Hurt
Scientists have known for some time that the Milky Way Galaxy is not alone in the Universe. In addition to our galaxy being part of the Local Group – a collection of 54 galaxies and dwarf galaxies – we are also part of the larger formation known as the Virgo Supercluster. So you could say the Milky Way has a lot of neighbors.
Of these, most people consider the Andromeda Galaxy to be our closest galactic cohabitant. But in truth, Andromeda is the closest spiral galaxy, and not the closest galaxy by a long shot. This distinction falls to a formation that is actually within the Milky Way itself, a dwarf galaxy that we’ve only known about for a little over a decade.
Closest Galaxy:
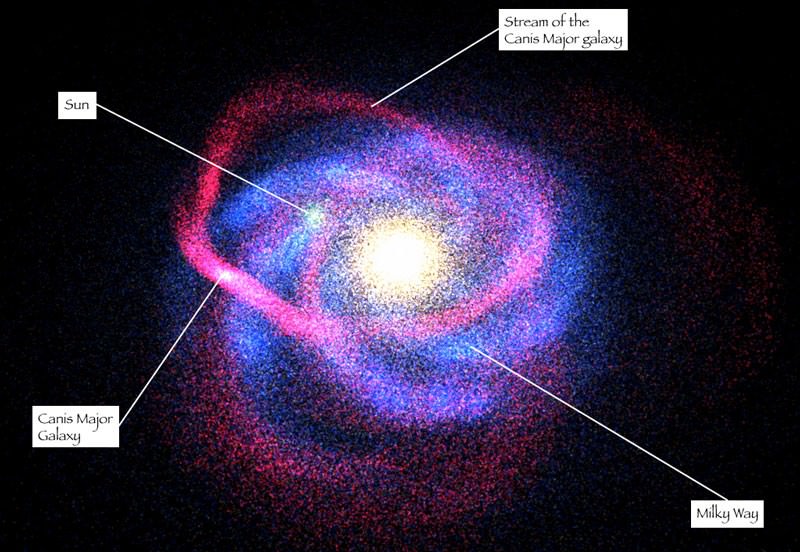
At present, the closet known galaxy to the Milky Way is the Canis Major Dwarf Galaxy – aka. the Canis Major Overdensity. This stellar formation is about 42,000 light years from the galactic center, and a mere 25,000 light years from our Solar System. This puts it closer to us than the center of our own galaxy, which is 30,000 light years away from the Solar System.
Illustration of the Canis Dwarf Galaxy and its associated tidal (shown in red) in relation to our Milky Way. Credit: R. Ibata (Strasbourg Observatory, ULP) et al./2MASS/NASA
Characteristics:
The Canis Major Dwarf Galaxy Dwarf Galaxy is believed to contain one billion stars in all, a relatively high-percentage of which are in the Red Giant Branch phase of their lifetimes. It has a roughly elliptical shape and is thought to contain as many stars as the Sagittarius Dwarf Elliptical Galaxy, the previous contender for closest galaxy to our location in the Milky Way.
In addition to the dwarf galaxy itself, a long filament of stars is visible trailing behind it. This complex, ringlike structure – which is sometimes referred to as the Monoceros Ring – wraps around the galaxy three times. The stream was first discovered in the early 21st century by astronomers conducting the Sloan Digital Sky Survey (SDSS).
It was in the course of investigating this ring of stars, and a closely spaced group of globular clusters similar to those associated with the Sagittarius Dwarf Elliptical Galaxy, that the Canis Major Dwarf Galaxy was first discovered. The current theory is that this galaxy was accreted (or swallowed up) by the Milky Way Galaxy.
Other globular clusters that orbit the center of our Milky Way as a satellite – i.e. NGC 1851, NGC 1904, NGC 2298 and NGC 2808 – are thought to have been part of the Canis Major Dwarf Galaxy before its accretion. It also has associated open clusters, which are thought to have formed as a result of the dwarf galaxy’s gravity perturbing material in the galactic disk and stimulating star formation.
Images of a few examples of merging galaxies taken by the Hubble Space Telescope. Credit: NASA/ESA/STScI/A. Evans/NRAO/Caltech
Discovery:
Prior to its discovery, astronomers believed that the Sagittarius Dwarf Galaxy was the closest galactic formation to our own. At 70,000 light years from Earth, this galaxy was determined in 1994 to be closer to us than the Large Magellanic Cloud (LMC), the irregular dwarf galaxy that is located 180,000 light years from Earth, and which previously held the title of the closest galaxy to the Milky Way.
All of that changed in 2003 when The Canis Major Dwarf Galaxy was discovered by the Two Micron All-Sky Survey (2MASS). This collaborative astronomical mission, which took place between 1997 and 2001, relied on data obtained by the Mt. Hopkins Observatory in Arizona (for the Northern Hemisphere) and the Cerro Tololo Inter-American Observatory in Chile (for the southern hemisphere).
From this data, astronomers were able to conduct a survey of 70% of the sky, detecting about 5,700 celestial sources of infrared radiation. Infrared astronomy takes advantage of advances in astronomy that see more of the Universe, since infrared light is not blocked by gas and dust to the same extent as visible light.
Because of this technique, the astronomers were able to detect a very significant over-density of class M giant stars in a part of the sky occupied by the Canis Major constellation, along with several other related structures composed of this type of star, two of which form broad, faint arcs (as seen in the image close to the top).
An artist depicts the incredibly powerful flare that erupted from the red dwarf star EV Lacertae. Credit: Casey Reed/NASA
The prevalence of M-class stars is what made the formation easy to detect. These cool, “Red Dwarfs” are not very luminous compared to other classes of stars, and cannot even be seen with the naked eye. However, they shine very brightly in the infrared, and appeared in great numbers.
The discovery of this galaxy, and subsequent analysis of the stars associated with it, has provided some support for the current theory that galaxies may grow in size by swallowing their smaller neighbors. The Milky Way became the size it is now by eating up other galaxies like Canis Major, and it continues to do so today. And since stars from the Canis Major Dwarf Galaxy are technically already part of the Milky Way, it is by definition the nearest galaxy to us.
As already noted, it was the Sagittarius Dwarf Elliptical Galaxy that held the position of closest galaxy to our own prior to 2003. At 75,000 light years away. This dwarf galaxy, which consists of four globular clusters that measure some 10,000 light-years in diameter, was discovered in 1994. Prior to that, the Large Magellanic Cloud was thought to be our closest neighbor.
The Andromeda Galaxy (M31) is the closest spiral galaxy to us, and though it’s gravitationally bound to the Milky Way, it’s not the closest galaxy by far – being 2 million light years away. Andromeda is currently approaching our galaxy at a speed of about 110 kilometers per second. In roughly 4 billion years, the Andromeda Galaxy is expected to merge with out own, forming a single, super-galaxy.
Future of the Canis Major Dwarf Galaxy:
Astronomers also believe that the Canis Major Dwarf Galaxy is in the process of being pulled apart by the gravitational field of the more massive Milky Way Galaxy. The main body of the galaxy is already extremely degraded, a process which will continue as it travels around and through our Galaxy.
In time, the accretion process will likely culminate with the Canis Major Dwarf Galaxy merging entirely with the Milky Way, thus depositing its 1 billion stars to the 200 t0 400 billion that are already part of our galaxy.
For more information, check out this article from the Spitzer Space Telescope‘s website about the galaxies that are closest to the Milky Way Galaxy. And here is a video by the same author on the subject.
Artist's impression of ice age Earth at glacial maximum. Credit: Wikipedia Commons/Ittiz
Scientists have known for some time that the Earth goes through cycles of climatic change. Owing to changes in Earth’s orbit, geological factors, and/or changes in Solar output, Earth occasionally experiences significant reductions in its surface and atmospheric temperatures. This results in long-term periods of glaciation, or what is more colloquially known as an “ice age”.
These periods are characterized by the growth and expansion of ice sheets across the Earth’s surface, which occurs every few million years. By definition we are still in the last great ice age – which began during the late Pliocene epoch (ca. 2.58 million years ago) – and are currently in an interglacial period, characterized by the retreat of glaciers.
Definition:
While the term “ice age” is sometime used liberally to refer to cold periods in Earth’s history, this tends to belie the complexity of glacial periods. The most accurate definition would be that ice ages are periods when ice sheets and glaciers expand across the planet, which correspond to significant drops in global temperatures and can last for millions of years.
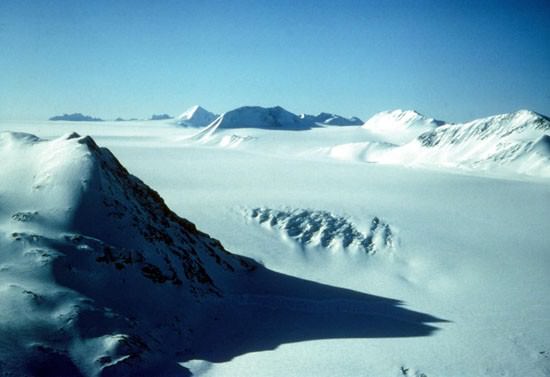
The Antarctic ice sheet, which expanded during the last ice age. Credit: Wikipedia Commons/Stephen Hudson
During an ice age, there are significant temperature differences between the equator and the poles, and temperatures at deep-sea levels have also been shown to drop. This allows for large glaciers (comparable to continents) to expand, covering much of the surface area of the planet. Since the Pre-Cambrian Era (ca. 600 million years ago), ice ages have occurred at widely space intervals about about 200 million years.
History of Study:
The first scientist to theorize about past glacial periods was the 18th century Swiss engineer and geographer Pierre Martel. In 1742, while visiting an Alpine valley, he wrote about the dispersal of large rocks in erratic formations, which the locals attributed to the glaciers having once extended much further. Similar explanations began to emerge in the ensuing decades for similar patterns of boulder distribution in other parts of he world.
From the middle of the 18th century onward, European scholars increasingly began to contemplate ice as a means of transporting rocky material. This included the presence of boulders in coastal areas in the Baltic states and the Scandinavian peninsula. However, it was Danish-Norwegian geologist Jens Esmark (1762–1839) who first argued the existence of a sequence of world wide ice ages.
This theory was detailed in a paper he published in 1824, in which he proposed that changes in Earth’s climate (which were due to changes in its orbit) were responsible. This was followed in 1832 by German geologist and forestry professor Albrecht Reinhard Bernhardi speculating about how the polar ice caps may have once reached as far as the temperate zones of the world.
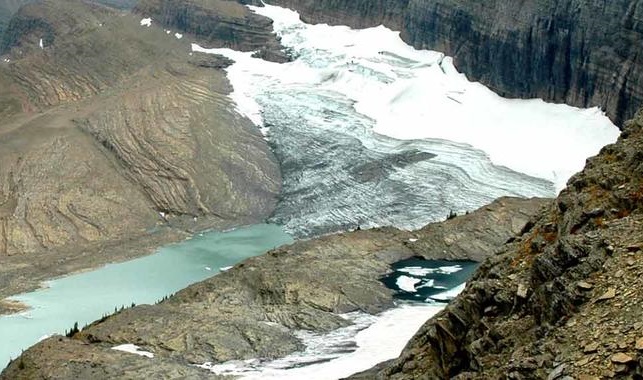
Overlook of the Grinnell Glacier in Glacier National Park, Montana. Credit: USGS
At this same time, German botanist Karl Friedrich Schimper and Swiss-American biologist Louis Agassiz began independently developing their own theory about global glaciation, which led toSchimper coining the term “ice age” in 1837. By the late 19th century, ice age theory gradually began to gain widespread acceptance over the notion that the Earth cooled gradually from its original, molten state.
By the 20th century, Serbian polymath Milutin Milankovic developed his concept of Milankovic cycles, which linked long-term climate changes to periodic changes in the Earth’s orbit around the Sun. This offered a demonstrable explanation for ice ages, and allowed scientists to make predictions about when significant changes in Earth’s climate might occur again.
Evidence for Ice Ages:
There are three forms of evidence for ice age theory, which range from the geological and the chemical to the paleontological (i.e. the fossil record). Each has its particular benefits and drawbacks, and has helped scientists to develop a general understanding of the effect ice ages have had on geological record for the past few billion years.
Geological: Geological evidence includes rock scouring and scratching, carved valleys, the formation of peculiar types of ridges, and the deposition of unconsolidated material (moraines) and large rocks in erratic formations. While this sort of evidence is what led to ice age theory in the first place, it remains temperamental.
For one, successive glaciation periods have different effects on a region, which tends to distort or erase geological evidence over time. In addition, geological evidence is difficult to date exactly, causing problems when it comes to getting an accurate assessment of how long glacial and interglacial periods have lasted.
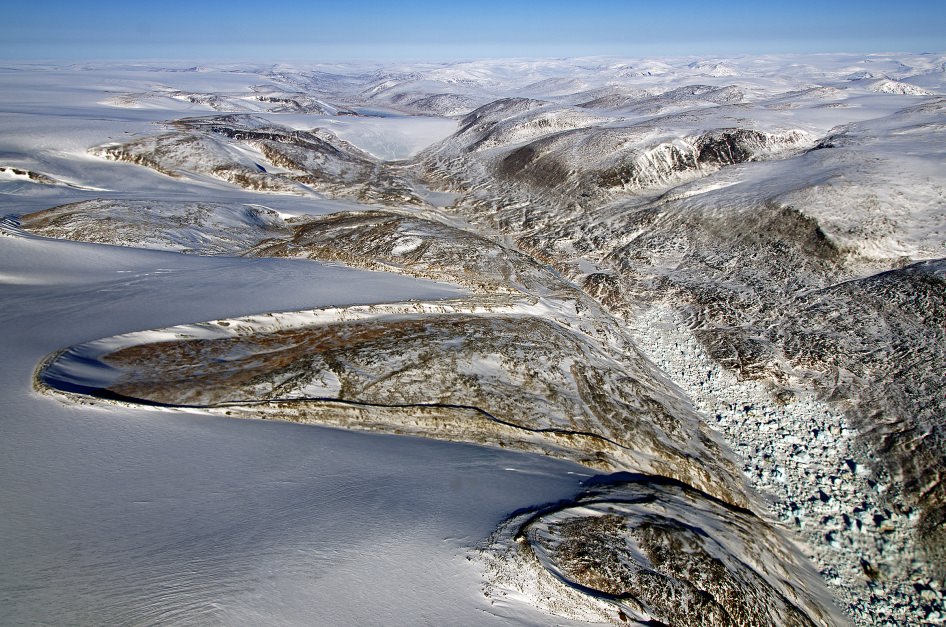
Horseshoe-shaped lateral moraines at the margin of the Penny Ice Cap on Baffin Island, Nunavut, Canada. Lateral moraines are accumulations of debris along the sides of a glacier formed by material falling from the valley wall. Credit: NASA/Michael Studinger
Chemical: This consists largely of variations in the ratios of isotopes in fossils discovered in sediment and rock samples. For more recent glacial periods, ice cores are used to construct a global temperature record, largely from the presence of heavier isotopes (which lead to higher evaporation temperatures). They often contain bubbles of air as well, which are examined to assess the composition of the atmosphere at the time.
Limitations arise from various factors, however. Foremost among these are isotope ratios, which can have a confounding effect on accurate dating. But as far as the most recent glacial and interglacial periods are concerned (i.e. during the past few million years), ice core and ocean sediment core samples remain the most trusted form of evidence.
Paleontological: This evidence consists of changes in the geographical distribution of fossils. Basically, organisms that thrive in warmer conditions become extinct during glacial periods (or become highly restricted in lower latitudes), while cold-adapted organisms thrive in these same latitudes. Ergo, reduced amounts of fossils in higher latitudes is an indication of the spread of glacial ice sheets.
This evidence can also be difficult to interpret because it requires that the fossils be relevant to the geological period under study. It also requires that sediments over wide ranges of latitudes and long periods of time show a distinct correlation (due to changes in the Earth’s crust over time). In addition, there are many ancient organisms that have shown the ability to survive changes in conditions for millions of years.
As a result, scientists rely on a combined approach and multiple lines of evidence wherever possible.
Ice ages are characterized by a drop in average global temperatures, resulting in the expansion of ice sheets globally. Credit: NASA
Causes of Ice Ages:
The scientific consensus is that several factors contribute to the onset of ice ages. These include changes in Earth’s orbit around the Sun, the motion of tectonic plates, variations in Solar output, changes in atmospheric composition, volcanic activity, and even the impact of large meteorites. Many of these are interrelated, and the exact role that each play is subject to debate.
Earth’s Orbit: Essentially, Earth’s orbit around the Sun is subject to cyclic variations over time, a phenomenon also known as Milankovic (or Milankovitch) cycles. These are characterized by changing distances from the Sun, the precession of the Earth’s axis, and the changing tilt of the Earth’s axis – all of which result in a redistribution of the sunlight received by the Earth.
The most compelling evidence for Milankovic orbital forcing corresponds closely to the most recent (and studied) period in Earth’s history (circa. during the last 400,000 years). During this period, the timing of glacial and interglacial periods are so close to changes in Milankovic orbital forcing periods that it is the most widely accepted explanation for the last ice age.
Tectonic Plates: The geological record shows an apparent correlation between the onset of ice ages and the positions of the Earth’s continents. During these periods, they were in positions which disrupted or blocked the flow of warm water to the poles, thus allowing ice sheets to form.
The Earth’s Tectonic Plates. Credit: msnucleus.org
This in turn increased the Earth’s albedo, which reduces the amount of solar energy absorbed by the Earth’s atmosphere and crust. This resulted in a positive feedback loop, where the advance of ice sheets further increased the Earth’s albedo and allowed for more cooling and more glaciation. This would continue until the onset of a greenhouse effect ended the period of glaciation.
Based on past ice-ages, three configurations have been identified that could lead to an ice age – a continent sitting atop the Earth’s pole (as Antarctica does today); a polar sea being land-locked (as the Arctic Ocean is today); and a super continent covering most of the equator (as Rodinia did during the Cryogenian period).
In addition, some scientists believe that the Himalayan mountain chain – which formed 70 million years ago – has played a major role in the most recent ice age. By increasing the Earth’s total rainfall, it has also increased the rate at which CO² has been removed from the atmosphere (thereby decreasing the greenhouse effect). Its existence has also paralleled the long-term decrease in Earth’s average temperature over the past 40 million years.
Atmospheric Composition: There is evidence that levels of greenhouse gases fall with the advance of ice sheets and rise with their retreat. According to the “Snowball Earth” hypothesis – in which ice completely or very nearly covered the planet at least once in the past – the ice age of the late Proterozoic was ended by an increase in CO² levels in the atmosphere, which was attributed to volcanic eruptions.
Image of the Harding Ice Field on Alaska’s Kenai Peninsula. Credit: US Fish and Wildlife Service
However, there are those who suggest that increased levels of carbon dioxide may have served as a feedback mechanism, rather than the cause. For example, in 2009, an international team of scientists produced a study – titled “The Last Glacial Maximum” – that indicated that an increase in solar irradiance (i.e. energy absorbed from the Sun) provided the initial change, whereas greenhouse gases accounted for the magnitude of change.
Major Ice Ages:
Scientists have determined that at least five major ice ages took place in Earth’s history. These include the Huronian, Cryogenian, Andean-Saharan, Karoo, and the Qauternary ice ages. The Huronian Ice Age is dated to the early Protzerozoic Eon, roughly 2.4 to 2.1 billion years ago, based on geological evidence observed to the north and north-east of Lake Huron (and correlated to deposits found in Michigan and Western Australia).
The Cryogenian Ice Age lasted from roughly 850 to 630 million years ago, and was perhaps the most severe in Earth’s history. It is believed that during this period, the glacial ice sheets reached the equator, thus leading to a “Snowball Earth” scenario. It is also believed that ended due to a sudden increase in volcanic activity that triggered a greenhouse effect, though (as noted) this is subject to debate.
The Andean-Saharan Ice Age occurred during the Late Ordovician and the Silurian period (roughly 460 to 420 million years ago). As the name suggests, the evidence here is based on geological samples take from the Tassili n’Ajjer mountain range in the western Sahara, and correlated by evidence obtained from the Andean mountain chain in South America (as well as the Arabian peninsula and the south Amazon basin).
Floating ice at the calving front of Greenland’s Kangerdlugssuaq glacier, photographed in 2011 during Operation IceBridge. Credit: NASA/Michael Studinger
The Karoo Ice Age is attributed to the evolution of land plants during the onset of the Devonian period (ca. 360 to 260 million years ago) which caused a long-term increase in planetary oxygen levels and a reduction in CO² levels – leading to global cooling. It is named after sedimentary deposits that were discovered in the Karoo region of South Africa, with correlating evidence found in Argentina.
The current ice age, known as the Pliocene-Quaternary glaciation, started about 2.58 million years ago during the late Pliocene, when the spread of ice sheets in the Northern Hemisphere began. Since then, the world has experienced several glacial and interglacial periods, where ice sheets advance and retreat on time scales of 40,000 to 100,000 years.
The Earth is currently in an interglacial period, and the last glacial period ended about 10,000 years ago. What remains of the continental ice sheets that once stretched across the globe are now restricted to Greenland and Antarctic, as well as smaller glaciers – like the one that covers Baffin Island.
Anthropogenic Climate Change:
The exact role played by all the mechanisms that ice ages are attributed to – i.e. orbital forcing, solar forcing, geological and volcanic activity – are not yet entirely understood. However, given the role of carbon dioxide and other greenhouse gas emissions, there has been a great deal of concern in recent decades what long-term effects human activity will have on the planet.
For instance, in at least two major ice ages, the Cryogenian and Karoo Ice Ages, increases and decreases in atmospheric greenhouse gases are believed to have played a major role. In all other cases, where orbital forcing is believed to be the primary cause of an ice age ending, increased greenhouse gas emissions were still responsible for the negative feedback that led to even greater increases in temperature.
The addition of CO2 by human activity has also played a direct role in climatic changes taking place around the world. Currently, the burning of fossil fuels by humans constitutes the largest source of emissions of carbon dioxide (about 90%) worldwide, which is one of the main greenhouse gases that allows radiative forcing (aka. the Greenhouse Effect) to take place.
In 2013, the National Oceanic and Atmospheric Administration announced that CO² levels in the upper atmosphere reached 400 parts per million (ppm) for the first time since measurements began in the 19th century. Based on the current rate at which emissions are growing, NASA estimates that carbon levels could reach between 550 to 800 ppm in the coming century.
If the former scenario is the case, NASA anticipates a rise of 2.5 °C (4.5 °F) in average global temperatures, which would be sustainable. However, should the latter scenario prove to be the case, global temperatures will rise by an average of 4.5 °C (8 °F), which would make life untenable for many parts of the planet. For this reason, alternatives are being sought out for development and widespread commercial adoption.
What’s more, according to a 2012 research study published in Nature Geoscience – titled “Determining the natural length of the current interglacial” – human emissions of CO² are also expected to defer the next ice age. Using data on Earth’s orbit to calculate the length of interglacial periods, the research team concluded that the next ice (expected in 1500 years) would require atmospheric CO² levels to remain beneath around 240?ppm.
Learning more about the longer ice ages as well the shorter glacial periods that have taken place in Earth’s past is important step towards understanding how Earth’s climate changes over time. This is especially important as scientists seek to determine how much of modern climate change is man-made, and what possible counter-measures can be developed.
Once again, science fiction television and movies has let you down. They try to recreate what it might be like on an alien world, but surprise surprise, they mostly get it wrong. That’s because a truly alien world would be different in so many ways, it would blow your mind. Today we’ll help you figure out if you’re on a movie set, or you’ve actually crashlanded on an alien planet.
Visit the Astronomy Cast Page to subscribe to the audio podcast!
We usually record Astronomy Cast as a live Google+ Hangout on Air every Friday at 1:30 pm Pacific / 4:30 pm Eastern. You can watch here on Universe Today or from the Astronomy Cast Google+ page.
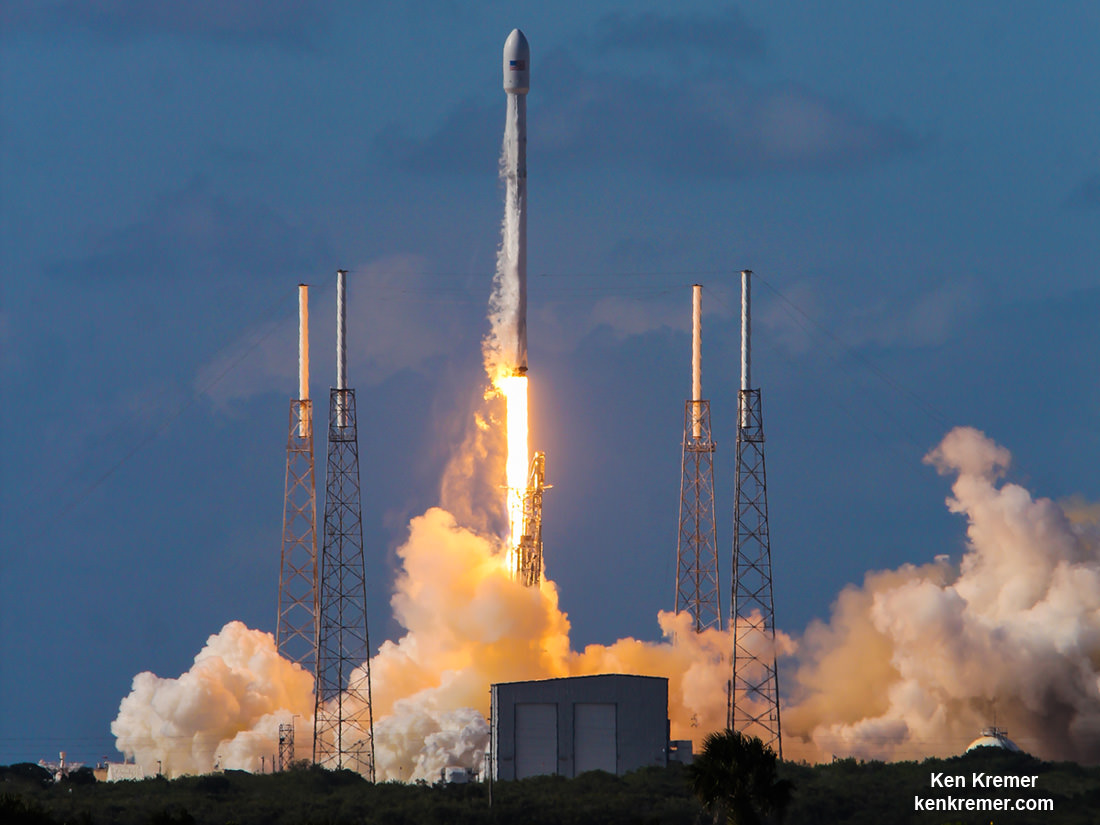
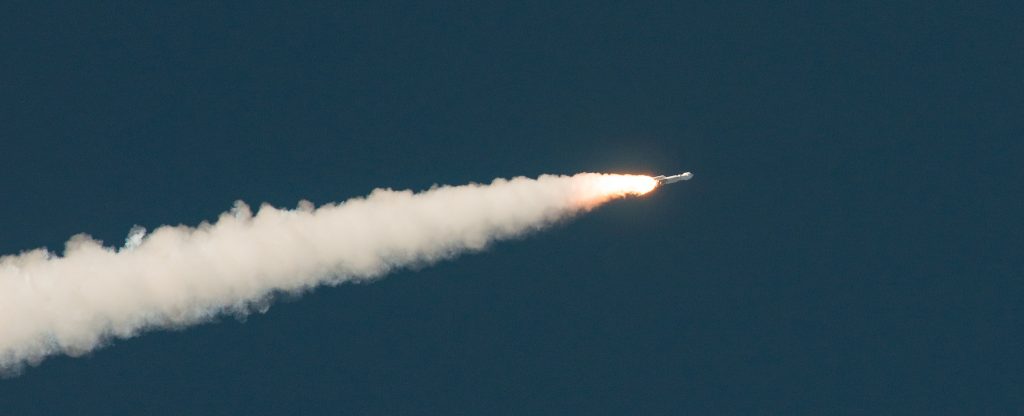
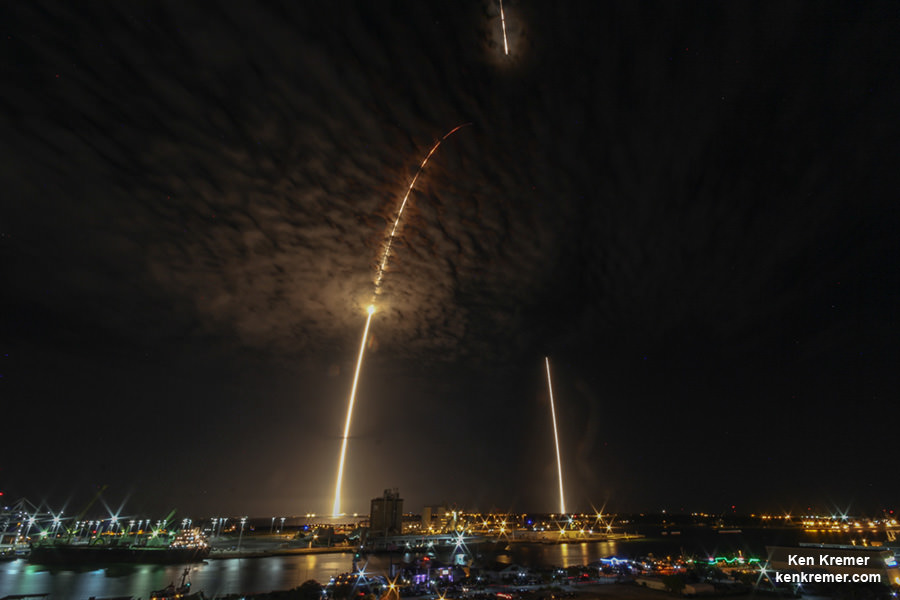
Upgraded SpaceX Falcon 9 blasts off with Thaicom-8 communications satellite on May 27, 2016 from Space Launch Complex 40 at Cape Canaveral Air Force Station, FL. 1st stage booster landed safely at sea minutes later. Credit: Ken Kremer/kenkremer.com
Upgraded SpaceX Falcon 9 blasts off with Thaicom-8 communications satellite on May 27, 2016 from Space Launch Complex 40 at Cape Canaveral Air Force Station, FL. 1st stage booster landed safely at sea minutes later. Credit: Ken Kremer/kenkremer.com
“Targeting return to flight from Vandenberg with the @IridiumComm NEXT launch on January 8,” SpaceX announced on their website today, Monday, Jan. 2., 2017.
“Our date is now public. Next Sunday morning, Jan 8 at 10:28:07 pst. Iridium NEXT launch #1 flies!” Iridium Communications CEO Matt Desch quickly confirmed by tweet today, Jan 2.
SpaceX has been dealing with the far reaching and world famous fallout from the catastrophic launch pad explosion that eviscerated a Falcon 9 and its expensive $200 million Israeli Amos-6 commercial payload in Florida without warning, during a routine preflight fueling test on Sept. 1, 2016, at pad 40 on Cape Canaveral Air Force Station.
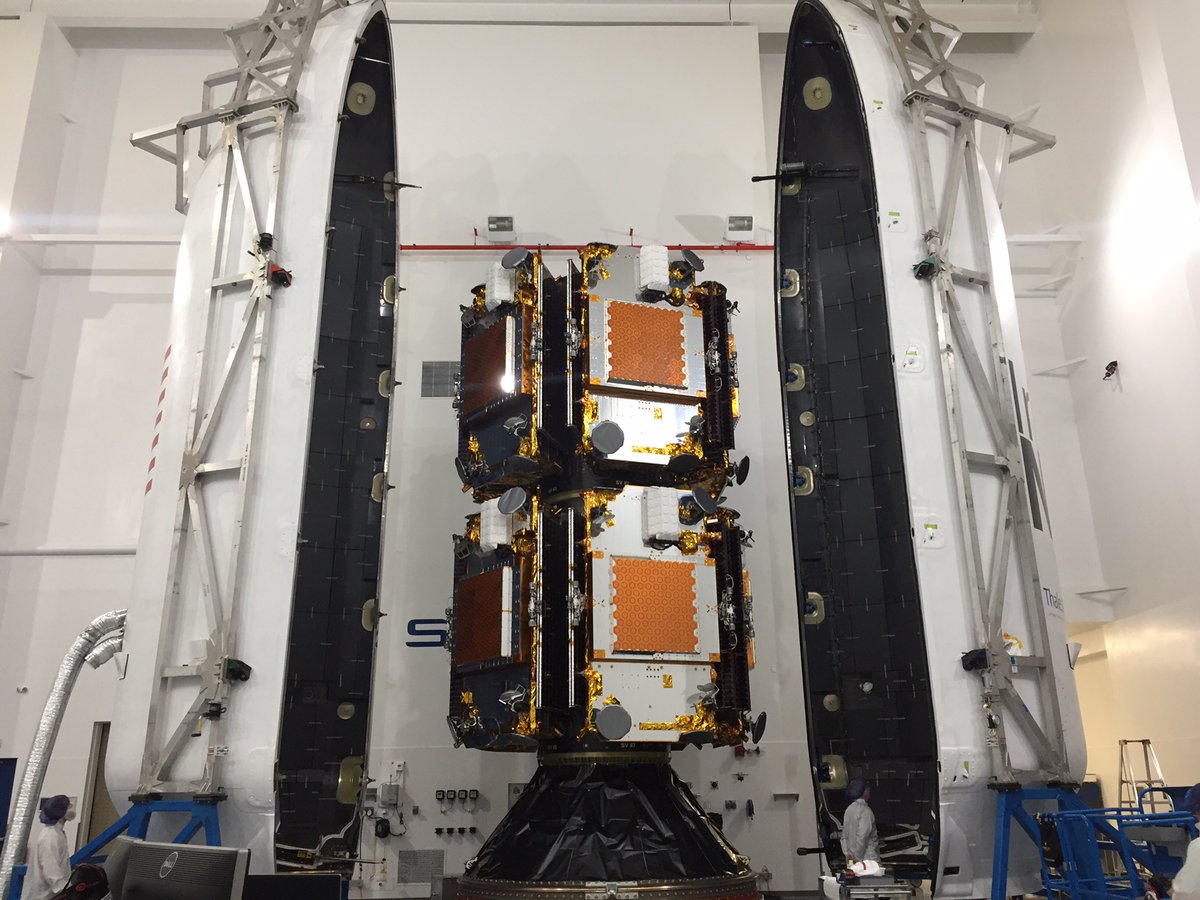
The first ten IridiumNEXT satellites are stacked and encapsulated in the Falcon 9 fairing for launch from Vandenberg Air Force Base, Ca., in early 2017. Credit: Iridium
After the Sept. 1 accident at pad 40, SpaceX initiated a joint investigation to determine the root cause with the FAA, NASA, the US Air Force and industry experts who have been “working methodically through an extensive fault tree to investigate all plausible causes.”
“We have been working closely with NASA, and the FAA [Federal Aviation Administration] and our commercial customers to understand it,” said SpaceX CEO Elon Musk.
Via the “fault tree analysis” the Sept. 1 anomaly has been traced to a failure in one of three gaseous helium storage tanks located inside the second stage liquid oxygen (LOX) tank of the Falcon 9 rocket, according to a statement released by SpaceX today which provided some but not many technical details.
The failure apparently originated at a point where the helium tank “buckles” and accumulates oxygen – “leading to ignition” of the highly flammable liquid oxygen propellant in the second stage.
SpaceX Falcon 9 rocket moments after catastrophic explosion destroys the rocket and Amos-6 Israeli satellite payload at launch pad 40 at Cape Canaveral Air Force Station, FL, on Sept. 1, 2016. A static hot fire test was planned ahead of scheduled launch on Sept. 3, 2016. Credit: USLaunchReport
The helium tanks – also known as composite overwrapped pressure vessels (COPVs) – are used in both stages of the Falcon 9 to store cold helium which is used to maintain tank pressure.
“The accident investigation team worked systematically through an extensive fault tree analysis and concluded that one of the three composite overwrapped pressure vessels (COPVs) inside the second stage liquid oxygen (LOX) tank failed.”
“Each COPV consists of an aluminum inner liner with a carbon overwrap.”
“Specifically, the investigation team concluded the failure was likely due to the accumulation of oxygen between the COPV liner and overwrap in a void or a buckle in the liner, leading to ignition and the subsequent failure of the COPV.”
SpaceX says investigators identified “an accumulation of super chilled LOX or SOX in buckles under the overwrap” as “credible causes for the COPV failure.”
Apparently the super chilled LOX or SOX can pool in the buckles and react with carbon fibers in the overwrap – which act as an ignition source.
As part of the most recent upgrade to the Falcon 9, SpaceX changed their fueling procedure to include the use of densified oxygen – or super chilled oxygen – in order to load more propellant into the same volume, at a lower temperature of about minus 340 degrees Fahrenheit for SOX vs. about minus 298 degrees Fahrenheit for LOX.
In essence SpaceX gets more gallons of super chilled oxygen into the same tank volume because of the higher density – and they don’t have to change the rocket’s dimensions.
This temperature change enables the Falcon 9 to launch heavier payloads.
However the side effect of the superchilling process is that the oxygen is now very close to its freezing point – with the potential to partially solidify , rather than being a completely free flowing liquid. Then the resulting friction with carbon fibers can ignite the pooled oxygen resulting in an instantaneous fireball and destruction of the rocket – as happened to Falcon 9 and Amos-6 at pad 40 on Sept. 1, 2016.
“Investigators concluded that super chilled LOX can pool in these buckles under the overwrap. When pressurized, oxygen pooled in this buckle can become trapped; in turn, breaking fibers or friction can ignite the oxygen in the overwrap, causing the COPV to fail.”
Very concerning to this author is the fact that the helium loading conditions are confirmed to be so low that they can actually freeze the liquid oxygen into solid form. Thus it cannot flow freely and significantly increases the chances of a “friction ignition.”
This same Falcon 9 rocket will be used to launch our astronauts to the ISS in 2018 – seated inside a Crew Dragon atop the helium tank bathed in super chilled LOX.
“Investigators determined that the loading temperature of the helium was cold enough to create solid oxygen (SOX), which exacerbates the possibility of oxygen becoming trapped as well as the likelihood of friction ignition.”
SpaceX says they will address the causes of the mishap through a mix of both short term and long term “corrective actions.”
“The corrective actions address all credible causes and focus on changes which avoid the conditions that led to these credible causes.”
The short term fixes involve simpler changes to the COPV configuration and modifying the helium loading conditions.
“In the short term, this entails changing the COPV configuration to allow warmer temperature helium to be loaded, as well as returning helium loading operations to a prior flight proven configuration based on operations used in over 700 successful COPV loads.”
So it remains to be seen if SpaceX continues the use of densified oxygen or not in the near term.
The long term fixes involve changing the COPV hardware itself and will take longer to implement. They are also likely to be more effective – but only time will tell.
“In the long term, SpaceX will implement design changes to the COPVs to prevent buckles altogether, which will allow for faster loading operations.”
Liftoff of the SpaceX Falcon 9 with the payload of 10 identical next generation IridiumNEXT communications satellites will take place from Space Launch Complex 4E on Vandenberg Air Force Base in California – assuming the required approval is first granted by the Federal Aviation Administration (FAA).
No Falcon 9 launch will occur until the FAA gives the ‘GO.’
Furthermore, in anticipation of announcing the targeted ‘Return to Flight’ launch date, technicians have already processed the Falcon 9 rocket for the ‘Return to Flight’ blastoff with the vanguard of a fleet of IridiumNEXT mobile voice and data relay satellites for Iridium Communications – as I reported last week in my story here – and subsequently tweeted by Iridium CEO Matt Desch saying “Nice recap.”
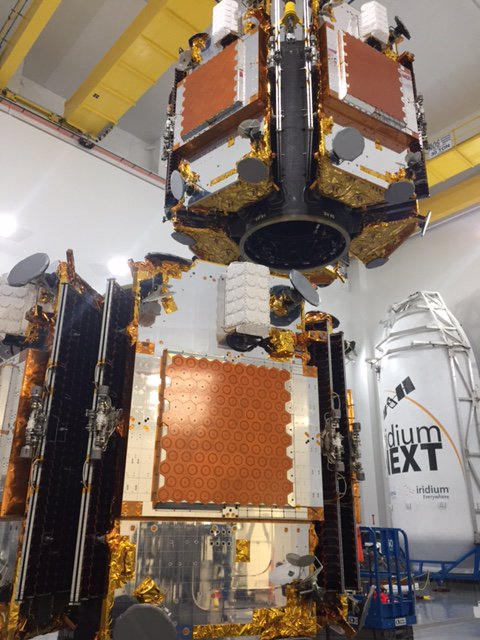
IridiumNEXT satellites being fueled, pressurized & stacked on dispenser tiers at Vandenberg AFB for Falcon 9 launch. Credit: Iridium
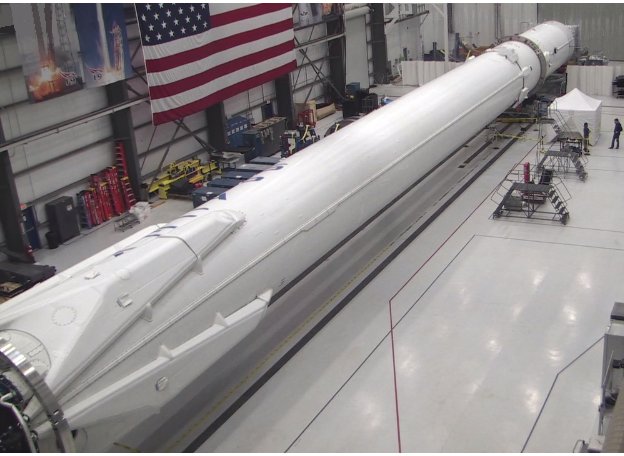
Last week, the first ten IridiumNEXT mobile voice and data relay satellites were fueled, stacked and tucked inside the nose cone of the Falcon 9 rocket designated as SpaceX’s ‘Return to Flight’ launcher in order to enable a blastoff as soon as possible after an approval is received from the FAA.
“Iridium is pleased with SpaceX’s announcement on the results of the September 1 anomaly as identified by their accident investigation team, and their plans to target a return to flight on January 8 with the first Iridium NEXT launch” Iridium Communications said on their website today, Jan. 2.
Another milestone to watch for is the first stage engine static fire test that SpaceX routinely conducts several days prior to the launch. Thats exactly the same type test where the Falcon 9 blew up in Florida some five minutes before the short Merlin 1D engine ignition to confirm readiness for the real launch that had been planned for 2 days later.
Iridium’s SpaceX Falcon9 rocket in processing at Vandenberg Air Force Base, getting ready for launch in early Jan. 2017. Credit: Iridium
The Iridium 1 mission is the first of seven planned Falcon 9 launches – totaling 70 satellites.
“Iridium is replacing its existing constellation by sending 70 Iridium NEXT satellites into space on a SpaceX Falcon 9 rocket over 7 different launches,” says Iridium.
The goal of this privately contracted mission is to deliver the first 10 Iridium NEXT satellites into low-earth orbit to inaugurate what will be a new constellation of satellites dedicated to mobile voice and data communications.
Iridium eventually plans to launch a constellation of 81 Iridium NEXT satellites into low-earth orbit.
“At least 70 of which will be launched by SpaceX,” per Iridium’s contract with SpaceX.
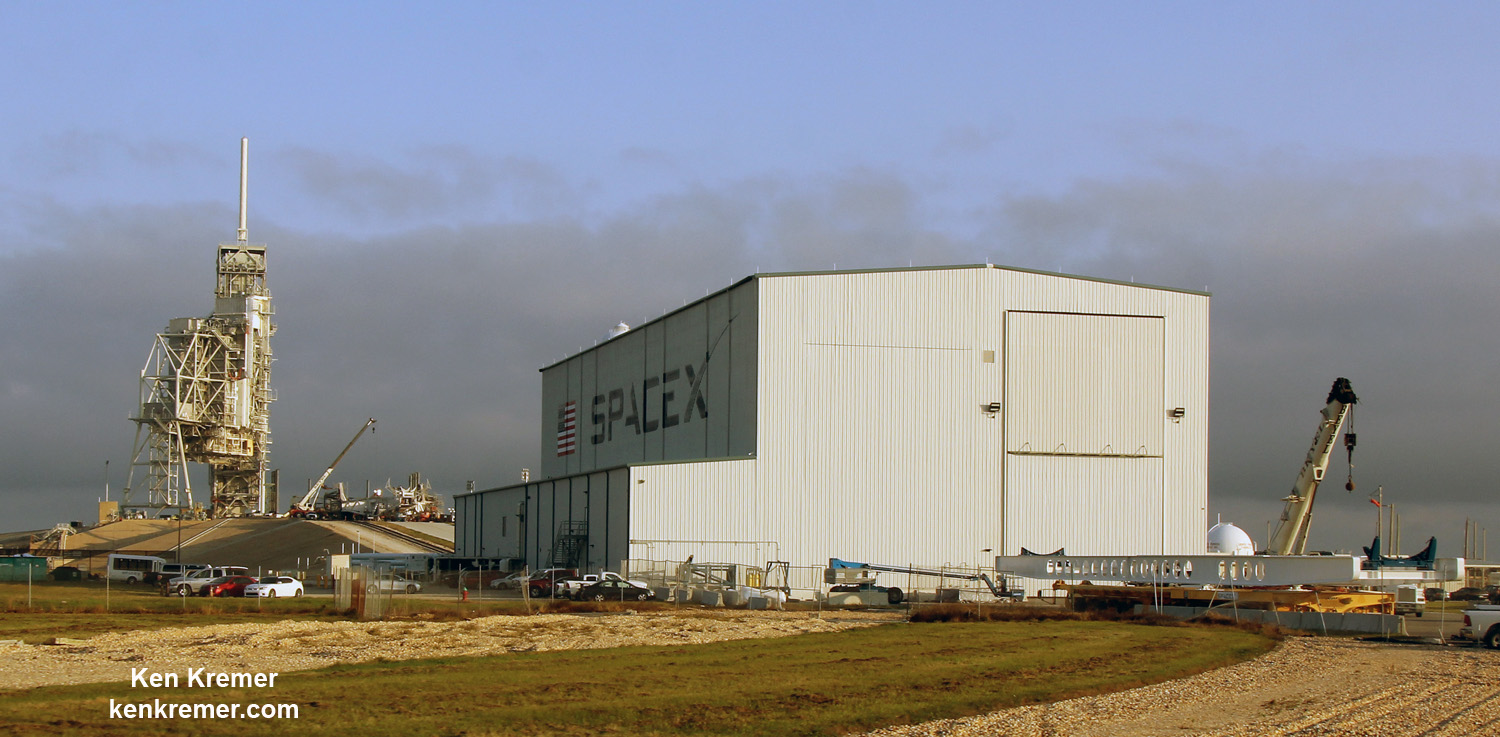
SpaceX is renovating Launch Complex 39A at the Kennedy Space Center for launches of commercial and human rated Falcon 9 rockets as well as the Falcon Heavy, as seen here during Dec 2016 with construction of a dedicated new transporter/erector. Credit: Ken Kremer/kenkremer.com
Meanwhile pad 40, which was heavily damaged during the Sept. 1 explosion, is undergoing extensive repairs and refurbishments to bring it back online.
It is not known when pad 40 will be fit to resume Falcon 9 launches.
In the interim, SpaceX plans to initially resume launches from the Florida Space Coast at the Kennedy Space Center (KSC) from pad 39A, the former shuttle pad that SpaceX has leased from NASA.
Commercial SpaceX launches at KSC could start from pad 39A sometime in early 2017 – after modifications for the Falcon 9 are completed.
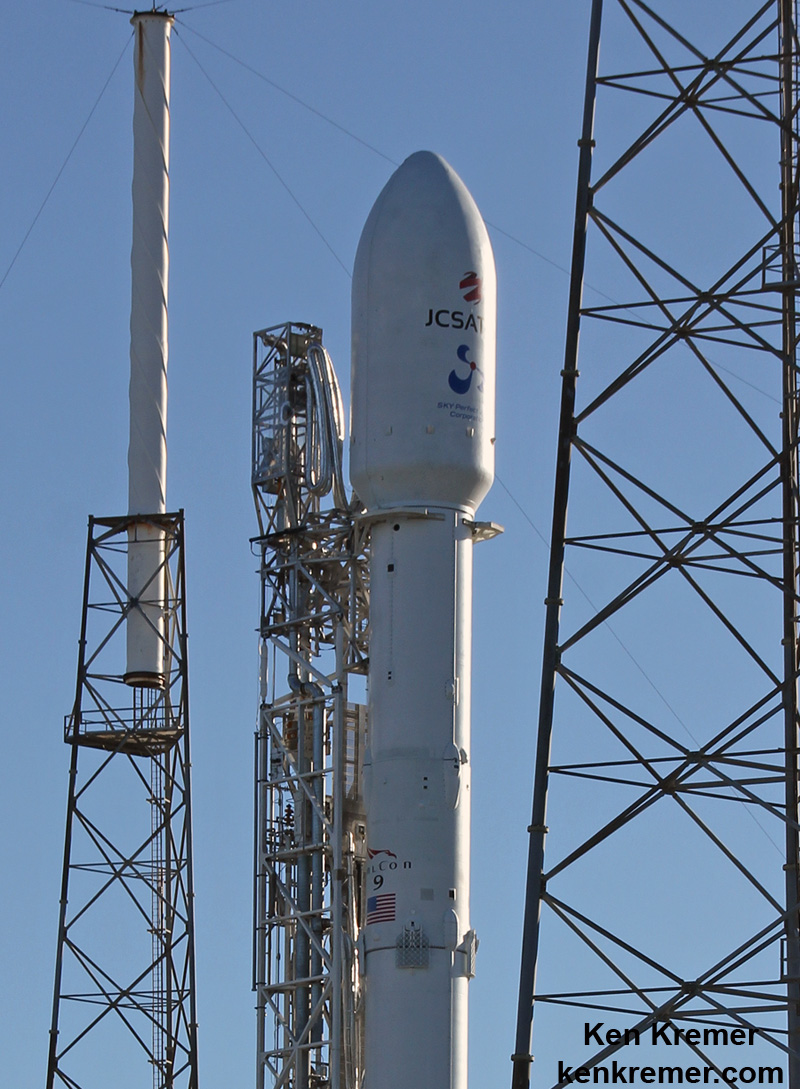
Up close look at a SpaceX Falcon 9 second stage and payload fairing from the JCSAT-16 launch from pad 40 at Cape Canaveral Air Force Station, FL. Both Falcon 9 rocket failures took place inside the second stage. Credit: Ken Kremer/kenkremer.com
The Sept. 1 calamity was the second Falcon 9 failure within 15 months time and called into question the rockets overall reliability. Both incidents involved the second stage helium system, but SpaceX maintains that they are unrelated.
The first Falcon 9 failure involved a catastrophic mid air explosion in the second stage about two and a half minutes after liftoff, during the Dragon CRS-7 cargo resupply launch for NASA to the International Space Station on June 28, 2015 – and witnessed by this author. The accident was traced to a failed strut holding the helium tank inside the liquid oxygen tank. The helium tank dislodged and ultimately ruptured the second stage as the first stage was still firing resulting in a total loss of the rocket and payload.
Stay tuned here for Ken’s continuing Earth and Planetary science and human spaceflight news.
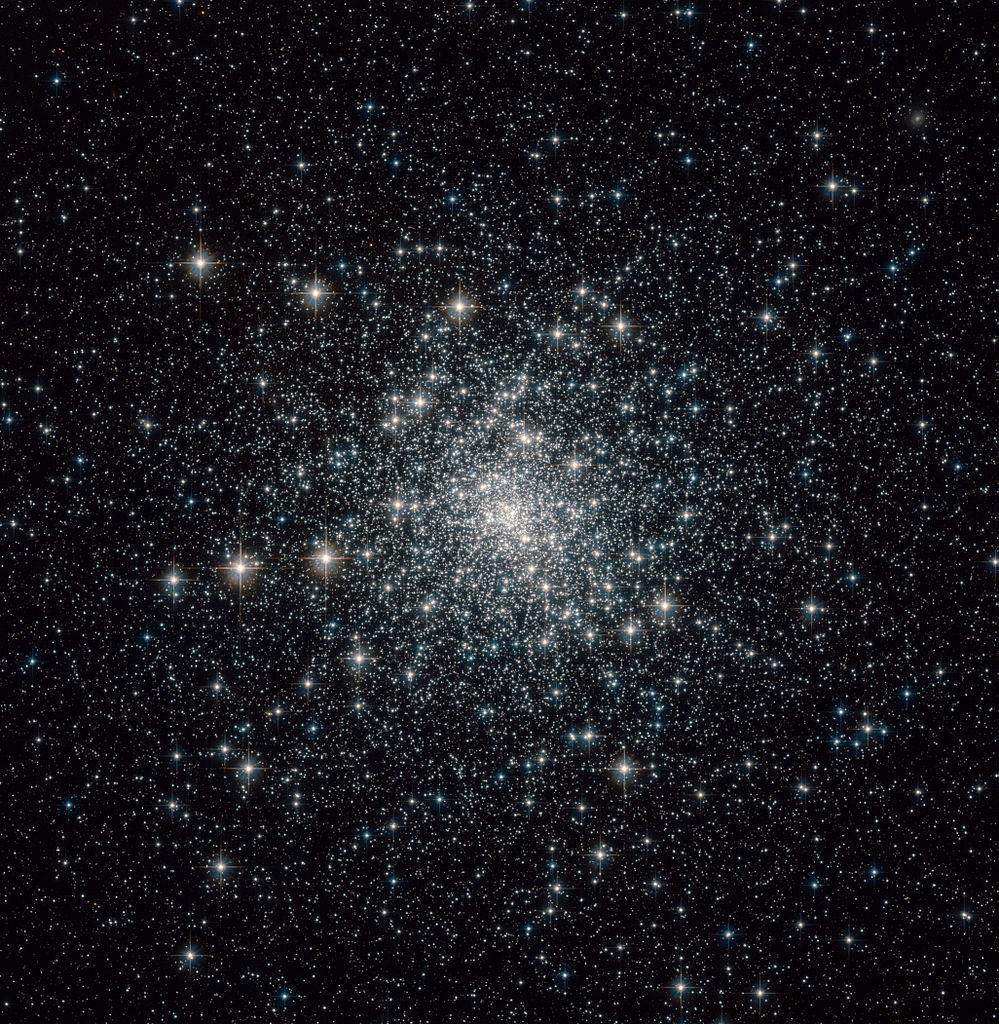
The Messier 30 globular cluster, in proximigy to other deep sky objects in the direction of the Capricornus constellation. Credit: Wikisky
Welcome back to Messier Monday! In our ongoing tribute to the great Tammy Plotner, we take a look at the globular cluster known as Messier 30. Enjoy!
During the 18th century, famed French astronomer Charles Messier noted the presence of several “nebulous objects” in the night sky. Having originally mistaken them for comets, he began compiling a list of them so that others would not make the same mistake he did. In time, this list (known as the Messier Catalog) would come to include 100 of the most fabulous objects in the night sky.
One of these objects is Messier 30, a globular cluster located in the southern constellation of Capricornus. Owing to its retrograde orbit through the inner galactic halo, it is believed that this cluster was acquired from a satellite galaxy in the past. Though it is invisible to the naked eye, this cluster can be viewed using little more than binoculars, and is most visible during the summer months.
Description:
Messier measures about 93 light years across and lies at a distance of about 26,000 light years from Earth, and approaching us at a speed of about 182 kilometers per second. While it looks harmless enough, its tidal influence covers an enormous 139 light years – far greater than its apparent size.
Half of its mass is so concentrated that literally thousands of stars could be compressed in an area that spans no further than the distance between our solar system and Sirius! However, inside this density only 12 variable stars have been found and very little evidence of any stellar collisions, although a dwarf nova has been recorded!
So what’s so special about this little globular? Try a collapsed core – and one that’s even been resolved by Earth-bound telescopes. According to Bruce Jones Sams III, an astrophysicists at Harvard University:
“The globular cluster NGC 7099 is a prototypical collapsed core cluster. Through a series of instrumental, observational, and theoretical observations, I have resolved its core structure using a ground based telescope. The core has a radius of 2.15 arcsec when imaged with a V band spatial resolution of 0.35 arcsec. Initial attempts at speckle imaging produced images of inadequate signal to noise and resolution. To explain these results, a new, fully general signal-to-noise model has been developed. It properly accounts for all sources of noise in a speckle observation, including aliasing of high spatial frequencies by inadequate sampling of the image plane. The model, called Full Speckle Noise (FSN), can be used to predict the outcome of any speckle imaging experiment. A new high resolution imaging technique called ACT (Atmospheric Correlation with a Template) was developed to create sharper astronomical images. ACT compensates for image motion due to atmospheric turbulence.”
Photography is an important tool for astronomers to work with – both land and space-based. By combining results, we can learn far more than just from the results of one telescope observation alone. As Justin H. Howell wrote in a 1999 study:
“It has long been known that the post-core-collapse globular cluster M30 (NGC 7099) has a bluer-inward color gradient, and recent work suggests that the central deficiency of bright red giant stars does not fully account for this gradient. This study uses Hubble Space Telescope Wide Field Planetary Camera 2 images in the F439W and F555W bands, along with ground-based CCD images with a wider field of view for normalization of the noncluster background contribution. The quoted uncertainty accounts for Poisson fluctuations in the small number of bright evolved stars that dominate the cluster light. We explore various algorithms for artificially redistributing the light of bright red giants and horizontal-branch stars uniformly across the cluster. The traditional method of redistribution in proportion to the cluster brightness profile is shown to be inaccurate. There is no significant residual color gradient in M30 after proper uniform redistribution of all bright evolved stars; thus, the color gradient in M30’s central region appears to be caused entirely by post-main-sequence stars.”
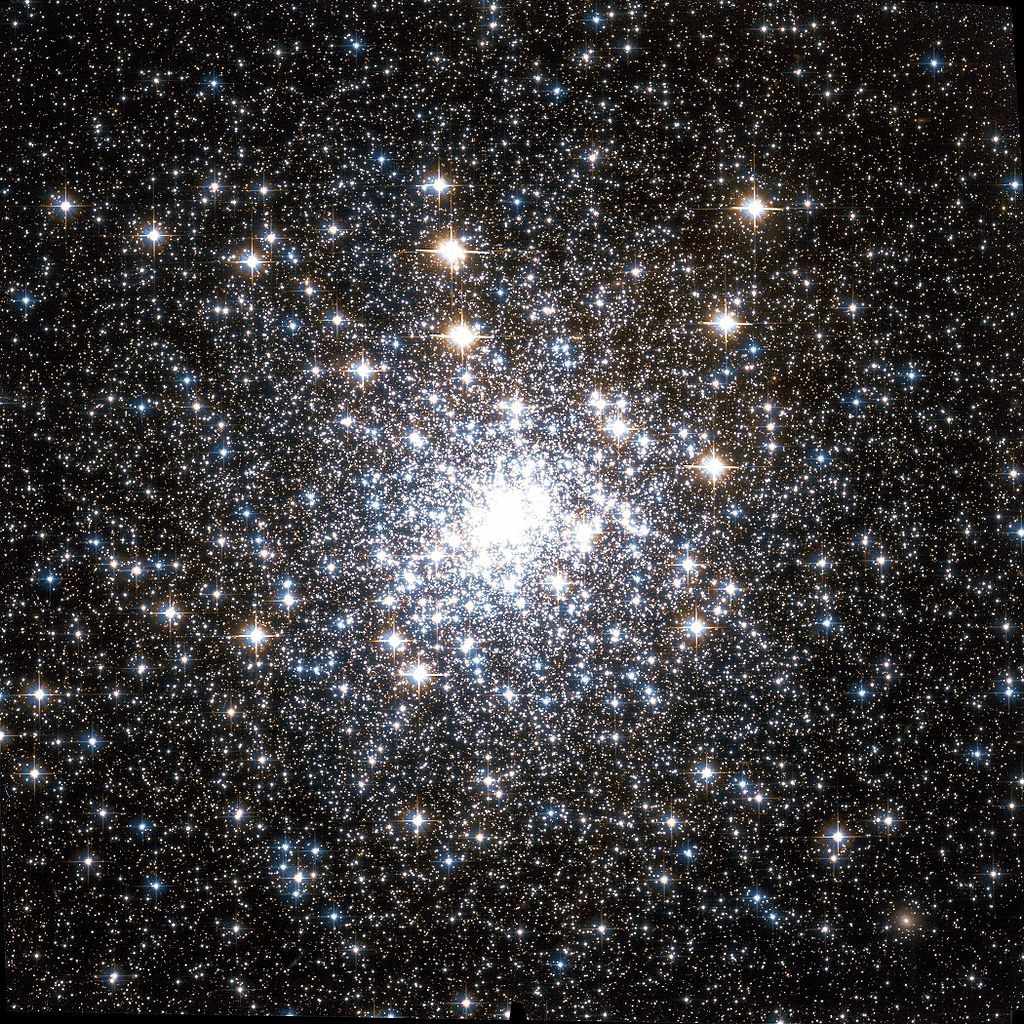
Image of Messier 30 (M 30, NGC 7099) was taken by Hubble’s Advanced Camera for Surveys (ACS). Credit: NASA/ESA
“We report the detection of six discrete, low-luminosity X-ray sources, located within 12” of the center of the collapsed-core globular cluster M30 (NGC 7099), and a total of 13 sources within the half-mass radius, from a 50 ks Chandra ACIS-S exposure. Three sources lie within the very small upper limit of 1.9” on the core radius. The brightest of the three core sources has a blackbody-like soft X-ray spectrum, which is consistent with it being a quiescent low-mass X-ray binary (qLMXB). We have identified optical counterparts to four of the six central sources and a number of the outlying sources, using deep Hubble Space Telescope and ground-based imaging. While the two proposed counterparts that lie within the core may represent chance superpositions, the two identified central sources that lie outside of the core have X-ray and optical properties consistent with being cataclysmic variables (CVs). Two additional sources outside of the core have possible active binary counterparts.”
History of Observation:
When Charles Messier first encountered this globular cluster in 1764, he was unable to resolve individual stars, and mistakenly believed it to be a nebula. As he wrote in his notes at the time:
“In the night of August 3 to 4, 1764, I have discovered a nebula below the great tail of Capricornus, and very near the star of sixth magnitude, the 41st of that constellation, according to Flamsteed: one sees that nebula with difficulty in an ordinary [non-achromatic] refractor of 3 feet; it is round, and I have not seen any star: having examined it with a good Gregorian telescope which magnifies 104 times, it could have a diameter of 2 minutes of arc. I have compared the center with the star Zeta Capricorni, and I have determined its position in right ascension as 321d 46′ 18″, and its declination as 24d 19′ 4″ south. This nebula is marked in the chart of the famous Comet of Halley which I observed at its return in 1759.”
Image of the core region of Messier 30 by the Hubble Space Telescope. Credit: NASA
However, we cannot fault Messier, for his job was to hunt comets and we thank him for logging this object for further study. Perhaps the first clue to M30’s underlying potential came from Sir William Herschel, who often studied Messier’s objects, but did not report his findings formally. In his personal notes he wrote:
“A brilliant cluster, the stars of which are gradually more compressed in the middle. It is insulated, that is, none of the stars in the neighborhood are likely to be connected with it. Its diameter is from 2’40” to 3’30”. The figure is irregularly round. The stars about the centre are so much compressed as to appear to run together. Towards the north, are two rows of bright stars 4 or 5 in a line. In this accumulation of stars, we plainly see the exertion of a central clustering power, which may reside in a central mass, or, what is more probable, in the compound energy of the stars about the centre. The lines of bright stars, although by a drawing made at the time of observation, one of them seems to pass through the cluster, are probably not connected with it.”
So, as telescopes progressed and resolution improved, so did our way of thinking about what we were seeing… By Admiral Smyth’s time, things had improved even more and so had the art of understanding more:
“A fine pale white cluster, under the creature’s caudal fin, and about 20 deg west-north-west of Fomalhaut, where it precedes 41 Capricorni, a star of 5th magnitude, within a degree. This object is bright, and from the straggling streams of stars on its northern verge, has an elliptical aspect, with a central blaze; and there are but few other stars, or outliers, in the field.
“When Messier discovered this, in 1764, he remarked that it was easily seen with a 3 1/2-foot telescope, that it was a nebula, unaccompanied by any star, and that its form was circular. But in 1783 it was attacked by WH [William Herschel] with both his 20-foot Newtonians, and forthwith resolved into a brilliant cluster, with two rows pf stars, four or five in a line, which probably belong to it; and therefore he deemed it insulated. Independently of this opinion, it is situated in a blankish space, one of those chasmata which Lalande termed d’espaces vuides, wherein he could not perceive a star of the 9th magnitude in the achromatic telescope of sixty-seven millimetres aperture. By a modification of his very ingenious gauging process, Sir William considered the profundity of this cluster to be of the 344th order.
“Here are materials for thinking! What an immensity of space is indicated! Can such an arrangement be intended, as a bungling spouter of the hour insists, for a mere appendage to the speck of a world on which we dwell, to soften the darkness of its petty midnight? This is impeaching the intelligence of Infinite Wisdom and Power, in adapting such grand means to so disproportionate an end. No imagination can fill up the picture of which the visual organs afford the dim outline; and he who confidently probes the Eternal Design cannot be many removes from lunacy. It was such a consideration that made the inspired writer claim, “How unsearchable are His operations, and His ways past finding out!”
Throughout all historic observing notes, you’ll find notations like “remarkable” and even Dreyer’s famous exclamation points. Even though M30 may not be the easiest to find, nor the brightest of the Messier objects, it is still quite worthy of your time and attention!
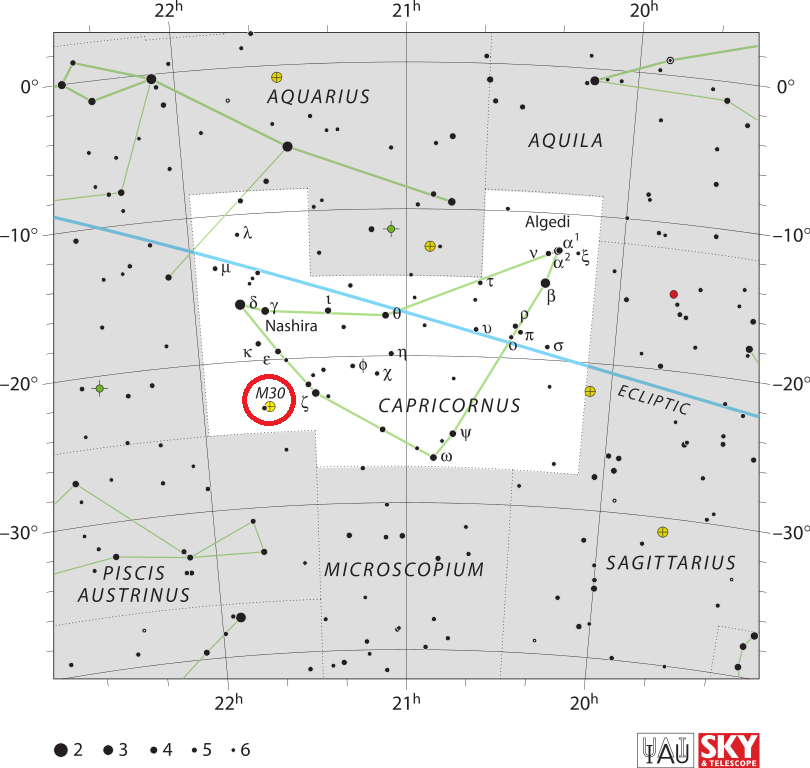
The location of Messier 30, in the direction of the Scorpius constellation. Credit: IAU/Sky & Telescope magazine (Roger Sinnott & Rick Fienberg)
Locating Messier 30:
Finding M30 is not an easy task, unless you’re using a GoTo telescope. In any other case, it’s a starhop process, which must begin with identifying the the big grin-shape of the constellation of Capricornus. Once you’ve separated out this constellation, you’ll begin to notice that many of its primary asterism stars are paired – which is a good thing! The northeastern most pair are Gamma and Delta, which is where binocular-users should start.
As you move slowly south and slightly west, you’ll encounter your next wide pair – Chi and Epsilon. The next southwestern set is 36 Cap and Zeta. Now, from here you have two options! You can find Messier 30 a little more than a finger width east(ish) of Zeta (about half a binocular field)… or, you can return to Epsilon and look about one binocular field south (about 3 degrees) for star 41 which will appear just east of Messier 30 in the same field of view.
For the finderscope, star 41 is a critical giveaway to the globular cluster’s position! It won’t be visible to the unaided eye, but even a little magnification will reveal its presence. Using binoculars or a very small telescope, Messier 30 will appear as only a small, faded gray ball of light with a small star beside it. However, with telescope apertures as small as 4″ you’ll begin some resolution on this overlooked globular cluster and larger apertures will resolve it nicely.
And here are the quick facts on Messier 30 to help you get started:
Object Name: Messier 30 Alternative Designations: M30, NGC 7099 Object Type: Class V Globular Cluster Constellation: Capricornus Right Ascension: 21 : 40.4 (h:m) Declination: -23 : 11 (deg:m Distance: 26.1 (kly) Visual Brightness: 7.2 (mag) Apparent Dimension: 12.0 (arc min)
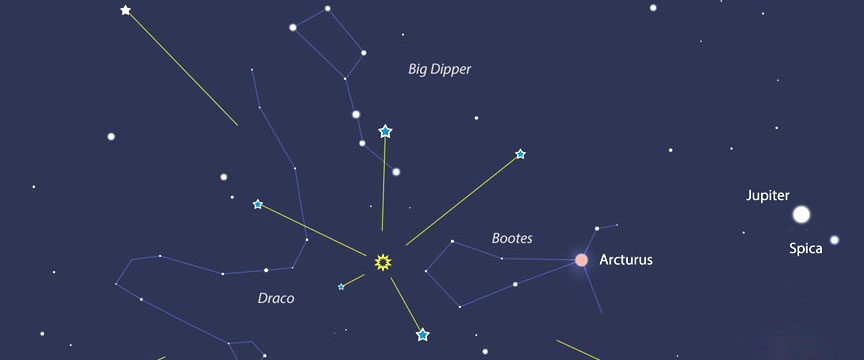
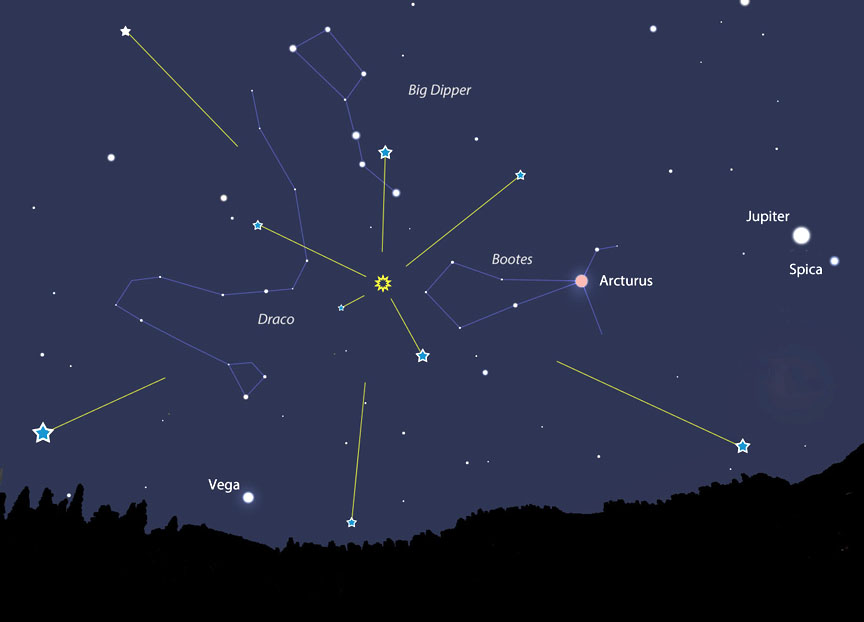
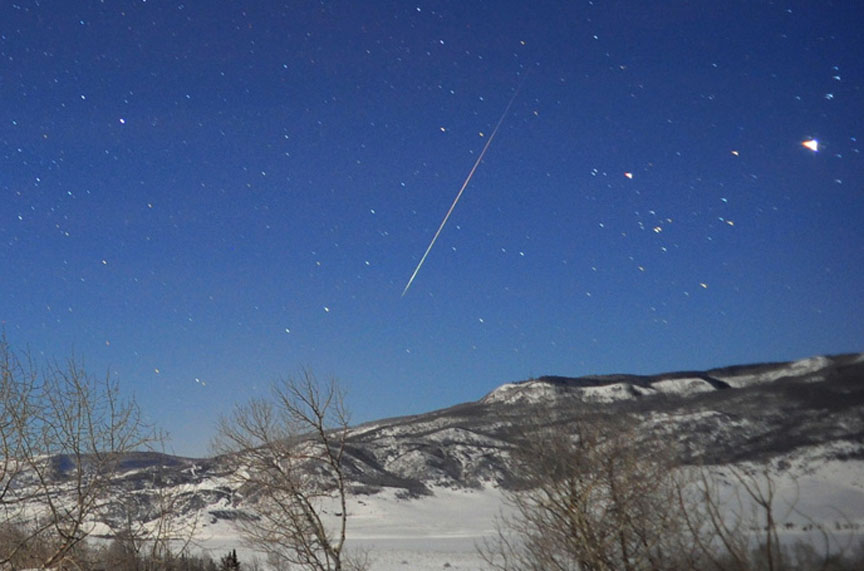
The Quadrantid meteor shower, named for the obsolete constellation Quadran Muralis, will appear to stream from a point in the sky called the radiant (yellow star), located below the end of the Big Dipper’s handle and across from the bright, orange-red star Arcturus. The map shows the sky around 4 a.m. local time Tuesday, Jan. 3. The shower will be best between 4 a.m. and 6 a.m., the start of dawn. Map: Bob King, Source: Stellarium
If one of your New Year’s resolutions is to spend more time under the stars in 2017, you’ll have motivation to do so as soon as Tuesday. That morning, the Quadrantid (kwah-DRAN-tid) meteor shower will peak between 4 to about 6 a.m. local time just before the start of dawn. This annual shower can be a rich one with up to 120 meteors flying by an hour — under perfect conditions.
Those include no moon, a light-pollution free sky and most importantly, for the time of maximum meteor activity to coincide with the time the radiant is highest in the pre-dawn sky. Timing is everything with the “Quads” because the shower is so brief. Meteor showers occur when Earth passes through either a stream of dusty debris left by a comet or asteroid. With the Quads, asteroid 2003 EH1 provides the raw material — bits of crumbled rock flaked off the 2-mile-wide (~3-4 km) object during its 5.5 year orbit around the sun.
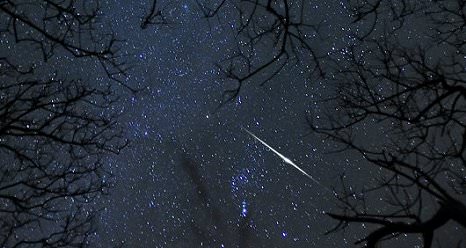
A Quadrantid fireball flares to the left of the Hyades star cluster and Jupiter in 2013. As Earth travels across the debris stream, bits and pieces of asteroid 2003 EH1 strike the atmosphere at nearly 100,000 mph (43 km/second) and vaporize while creating a glowing dash of light called a meteor. Credit: Jimmy Westlake via NASA
Only thing is, the debris path is narrow and Earth tears through it perpendicularly, so we’re in and out in a hurry. Just a few hours, tops. This year’s peak happens around 14 hours UT or 8 a.m. Central time (9 a.m. Eastern, 7 a.m. Mountain and 6 a.m. Pacific), not bad for the U.S. and Canada. The timing is rather good for West Coast skywatchers and ideal if you live in Alaska. Alaska gets an additional boost because the radiant, located in the northeastern sky, is considerably higher up and better placed than it is from the southern U.S. states.
Another Quadrantid fireball. Credit: NASA
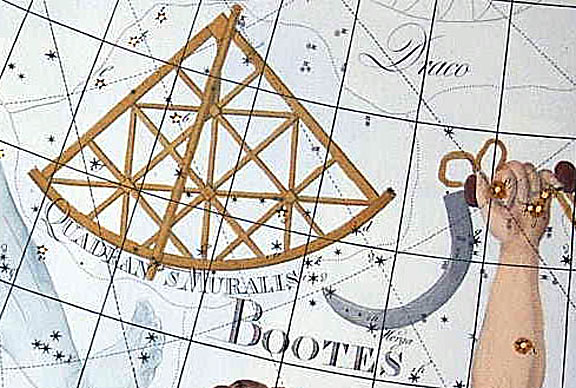
The Quads will appear to radiate from a point in the sky below the Big Dipper’s handle, which stands high in the northeastern sky at the time. This area was once home to the now defunct constellation Quadrans Muralis (mural quadrant), the origin of the shower’s name. As with all meteor showers, you’ll see meteors all over the sky, but all will appear to point back to the radiant. Meteors that point back to other directions don’t belong to the Quads are called sporadic or random meteors.
The long-obsolete constellation Quadrans Muralis represents the wall quadrant, a instrument once used to measure star positions. It was created by French astronomer Jerome Lalande in 1795. Credit: Johann Bode atlas
Off-peak observers can expect at least a decent shower with up to 25 meteors an hour visible from a reasonably dark sky. Peak observers could see at least 60 per hour. Tropical latitude skywatchers will miss most of the the show because the radiant is located at or below the horizon, but they should be on the lookout for Earthgrazers, meteors that climb up from below the horizon and make long trails as they skirt through the upper atmosphere.
Set your clock for 4 or 5 a.m. Tuesday, put on a few layers of clothing, tuck hand warmers in your boots and gloves, face east and have at it! The Quads are known for their fireballs, brilliant meteors famous for taking one’s breath away. Each time you see one chalk its way across the sky, you’re witnessing the fiery end of an asteroid shard. As the crumble burns out, you might be fulfilling another resolution: burning away those calories while huddling outside to see the show.
Let’s forget all about 2016, and instead look forward to the amazing 2017 we all know we’re going to have. And to help you celebrate this amazing year in space, we’re pleased to publish an entire book on what you can observe in the upcoming year: 101 Astronomical Events in 2017.
This totally free ebook was written by our own David Dickinson and contains all the predictable events coming up: the occultations, the eclipses, the meteor showers, the equinoxes, the super-moons and mini-moons. Every significant event coming up in 2017.
Once again, this book is totally free. There’s no cost to purchase it, there are no advertisements in it. All we ask is that you get out there, enjoy the night sky with your friends and family, and take amazing pictures to share with us and the rest of astronomy community.
Well, it would also really help if you shared the book with your friends, family, astronomy club, and forums.
This is an experiment. Will you download and actually use it? If so, then expect us to release a new edition every year. If not, then, we’ll go back to the regular blog post version.
Thanks again to David for putting in an enormous amount of work 6 months ago to think through an entire year of observing, and to the readers and photographers who helped doublecheck the math to make sure it’s accurate.
Click here to download a copy in PDF format, or click here to download a copy in EPUB format.
Also, here’s a great Google Calendar link to all 101 events courtesy of Christopher Becke (@BeckePhysics)… thanks Chris!
The Soyuz MS-01 spacecraft launches from the Baikonur Cosmodrome on July 7, 2016 bringing a new crew to the International Space Station. Credit: (NASA/Bill Ingalls)
There are a group of unsung heroes at NASA, the people who travel the world to capture key events in our exploration of space. They share their images with all of us, but most of the time, it’s not just the pictures of launches, landings, and crucial mission events that they capture. They also show us behind-the-scenes events that otherwise might go unnoticed, and they also capture the true personalities of the people behind the missions and events.
From exciting beginnings of rocket launches and rocket tests to the sad losses of space exploration icons, these photographers are there take these images that will forever remind us of the glories and perils of spaceflight and the joys and sadness of human life.
NASA photographers Bill Ingalls, Aubrey Gemignani, Joel Kowsky, Connie Moore, and Gwen Pitman chose some of their favorites images from 2016, and below are just a few. As Ingalls told us, “These are the favorite images created by our HQ photo team, not from the entire agency. There are many more talented photographers at the NASA centers producing some amazing work as well.”
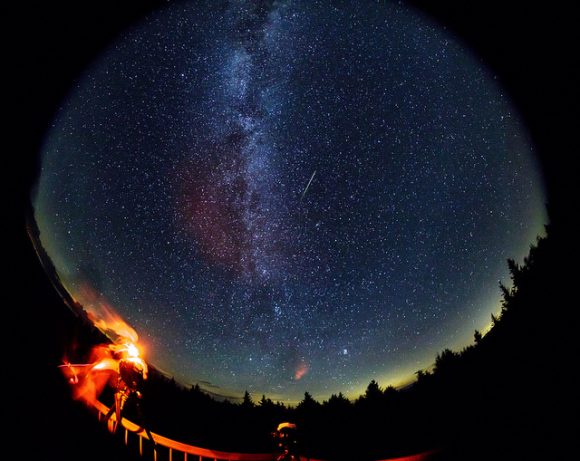
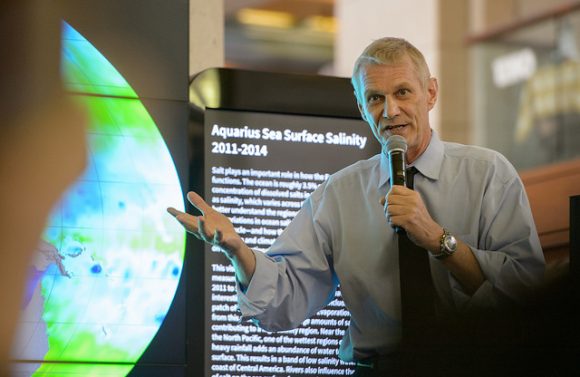
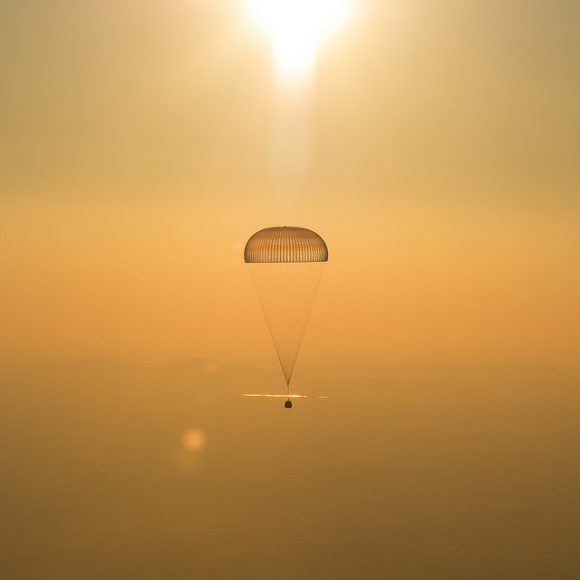
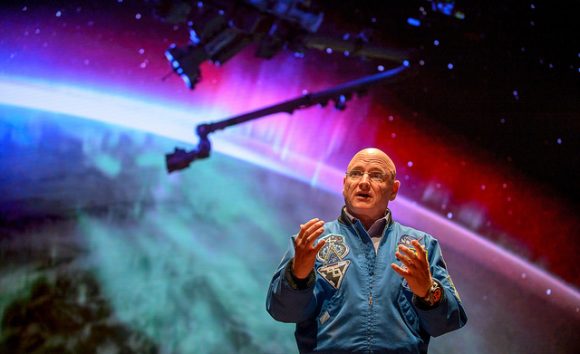
In this 30 second exposure taken with a circular fish-eye lens, a meteor streaks across the sky during the annual Perseid meteor shower as a photographer wipes moisture from the camera lenses Friday, August 12, 2016 in Spruce Knob, West Virginia. Photo Credit: (NASA/Bill Ingalls)The team from the Juno mission celebrate after they received confirmation from the spacecraft that it had successfully completed the engine burn and entered orbit of Jupiter on July 4, 2016 in mission control of the Space Flight Operations Facility at the Jet Propulsion Laboratory in Pasadena, CA. Juno will orbit the planet for 20 months to collect data on the planetary core, map the magnetic field, and measure the amount of water and ammonia in the atmosphere. Credit: (NASA/Aubrey Gemignani)The United Launch Alliance Atlas V rocket carrying NASA’s Origins, Spectral Interpretation, Resource Identification, Security-Regolith Explorer (OSIRIS-REx) spacecraft lifts off on from Space Launch Complex 41 on Sept. 8, 2016 at Cape Canaveral Air Force Station in Florida. OSIRIS-REx will be the first U.S. mission to sample an asteroid, retrieve at least two ounces of surface material and return it to Earth for study. The asteroid, Bennu, may hold clues to the origin of the solar system and the source of water and organic molecules found on Earth. Photo Credit: (NASA/Joel Kowsky)Annie Glenn, Widow of former astronaut and Senator John Glenn, pays her respects to her late husband as he lies in repose, under a United States Marine honor guard, in the Rotunda of the Ohio Statehouse in Columbus, Friday, Dec. 16, 2016. Credit: (NASA/Bill Ingalls)Piers Sellers, former astronaut and deputy director of the Sciences and Exploration Directorate at NASA’s Goddard Space Flight Center, speaks at NASA’s Earth Day event, Friday, April 22, 2016 at Union Station in Washington, DC. Sadly, Sellers passed away on Dec. 23, after battling cancer. Credit: (NASA/Joel Kowsky)The Soyuz TMA-20M spacecraft is seen as it lands with Expedition 48 crew members NASA astronaut Jeff Williams, Russian cosmonauts Alexey Ovchinin, and Oleg Skripochka of Roscosmos near the town of Zhezkazgan, Kazakhstan on Wednesday, Sept. 7, 2016. Credit: (NASA/Bill Ingalls)Following his year in space on board the International Space Station, astronaut Scott Kelly spoke during an event at the United States Capitol Visitor Center, on May 25, 2016, in Washington. Credit: (NASA/Bill Ingalls)The second and final qualification motor (QM-2) test for the Space Launch System’s booster is seen, Tuesday, June 28, 2016, at Orbital ATK Propulsion Systems test facilities in Promontory, Utah. During the Space Launch System flight the boosters will provide more than 75 percent of the thrust needed to escape the gravitational pull of the Earth, the first step on NASA’s Journey to Mars. Credit: (NASA/Bill Ingalls)NASA astronaut Peggy Whitson gets her hair cut on Nov. 14, 2016 at the Cosmonaut Hotel in Baikonur, Kazakhstan, a few days before launching to spend about six months on the International Space Station. Credit: (NASA/Bill Ingalls)
Click on each of the images to see larger versions on Flickr. You can see the entire selection of these favorite photos from 2016 on the NASA HQ Flickr page.
In Denmark, wind power accounts for 28% of electrical production and is cheaper than coal power. Credit: denmark.dk
Perhaps you’ve seen them while driving through the countryside. Or maybe you saw them just off the coast, looming large on the horizon with their spinning blades. Then again, you may have seen them on someone’s roof, or as part of a small-scale urban operation. Regardless of the location, wind turbines and wind power are becoming an increasingly common feature in the modern world.
Much of this has to do with the threat of Climate Change, air pollution, and the desire to wean humanity off its dependence on fossil fuels. And when it comes to alternative and renewable energy, wind power is expected to occupy the second-largest share of the market in the future (after solar). But just how exactly do wind turbines work?
Description:
Air turbines are devices that turn the kinetic energy of wind and changes in air flow into electrical energy. In general, they consist of the following components: a rotor, a generator, and a structural support component (which can take the form of either a tower, a rotor yaw mechanism, or both).
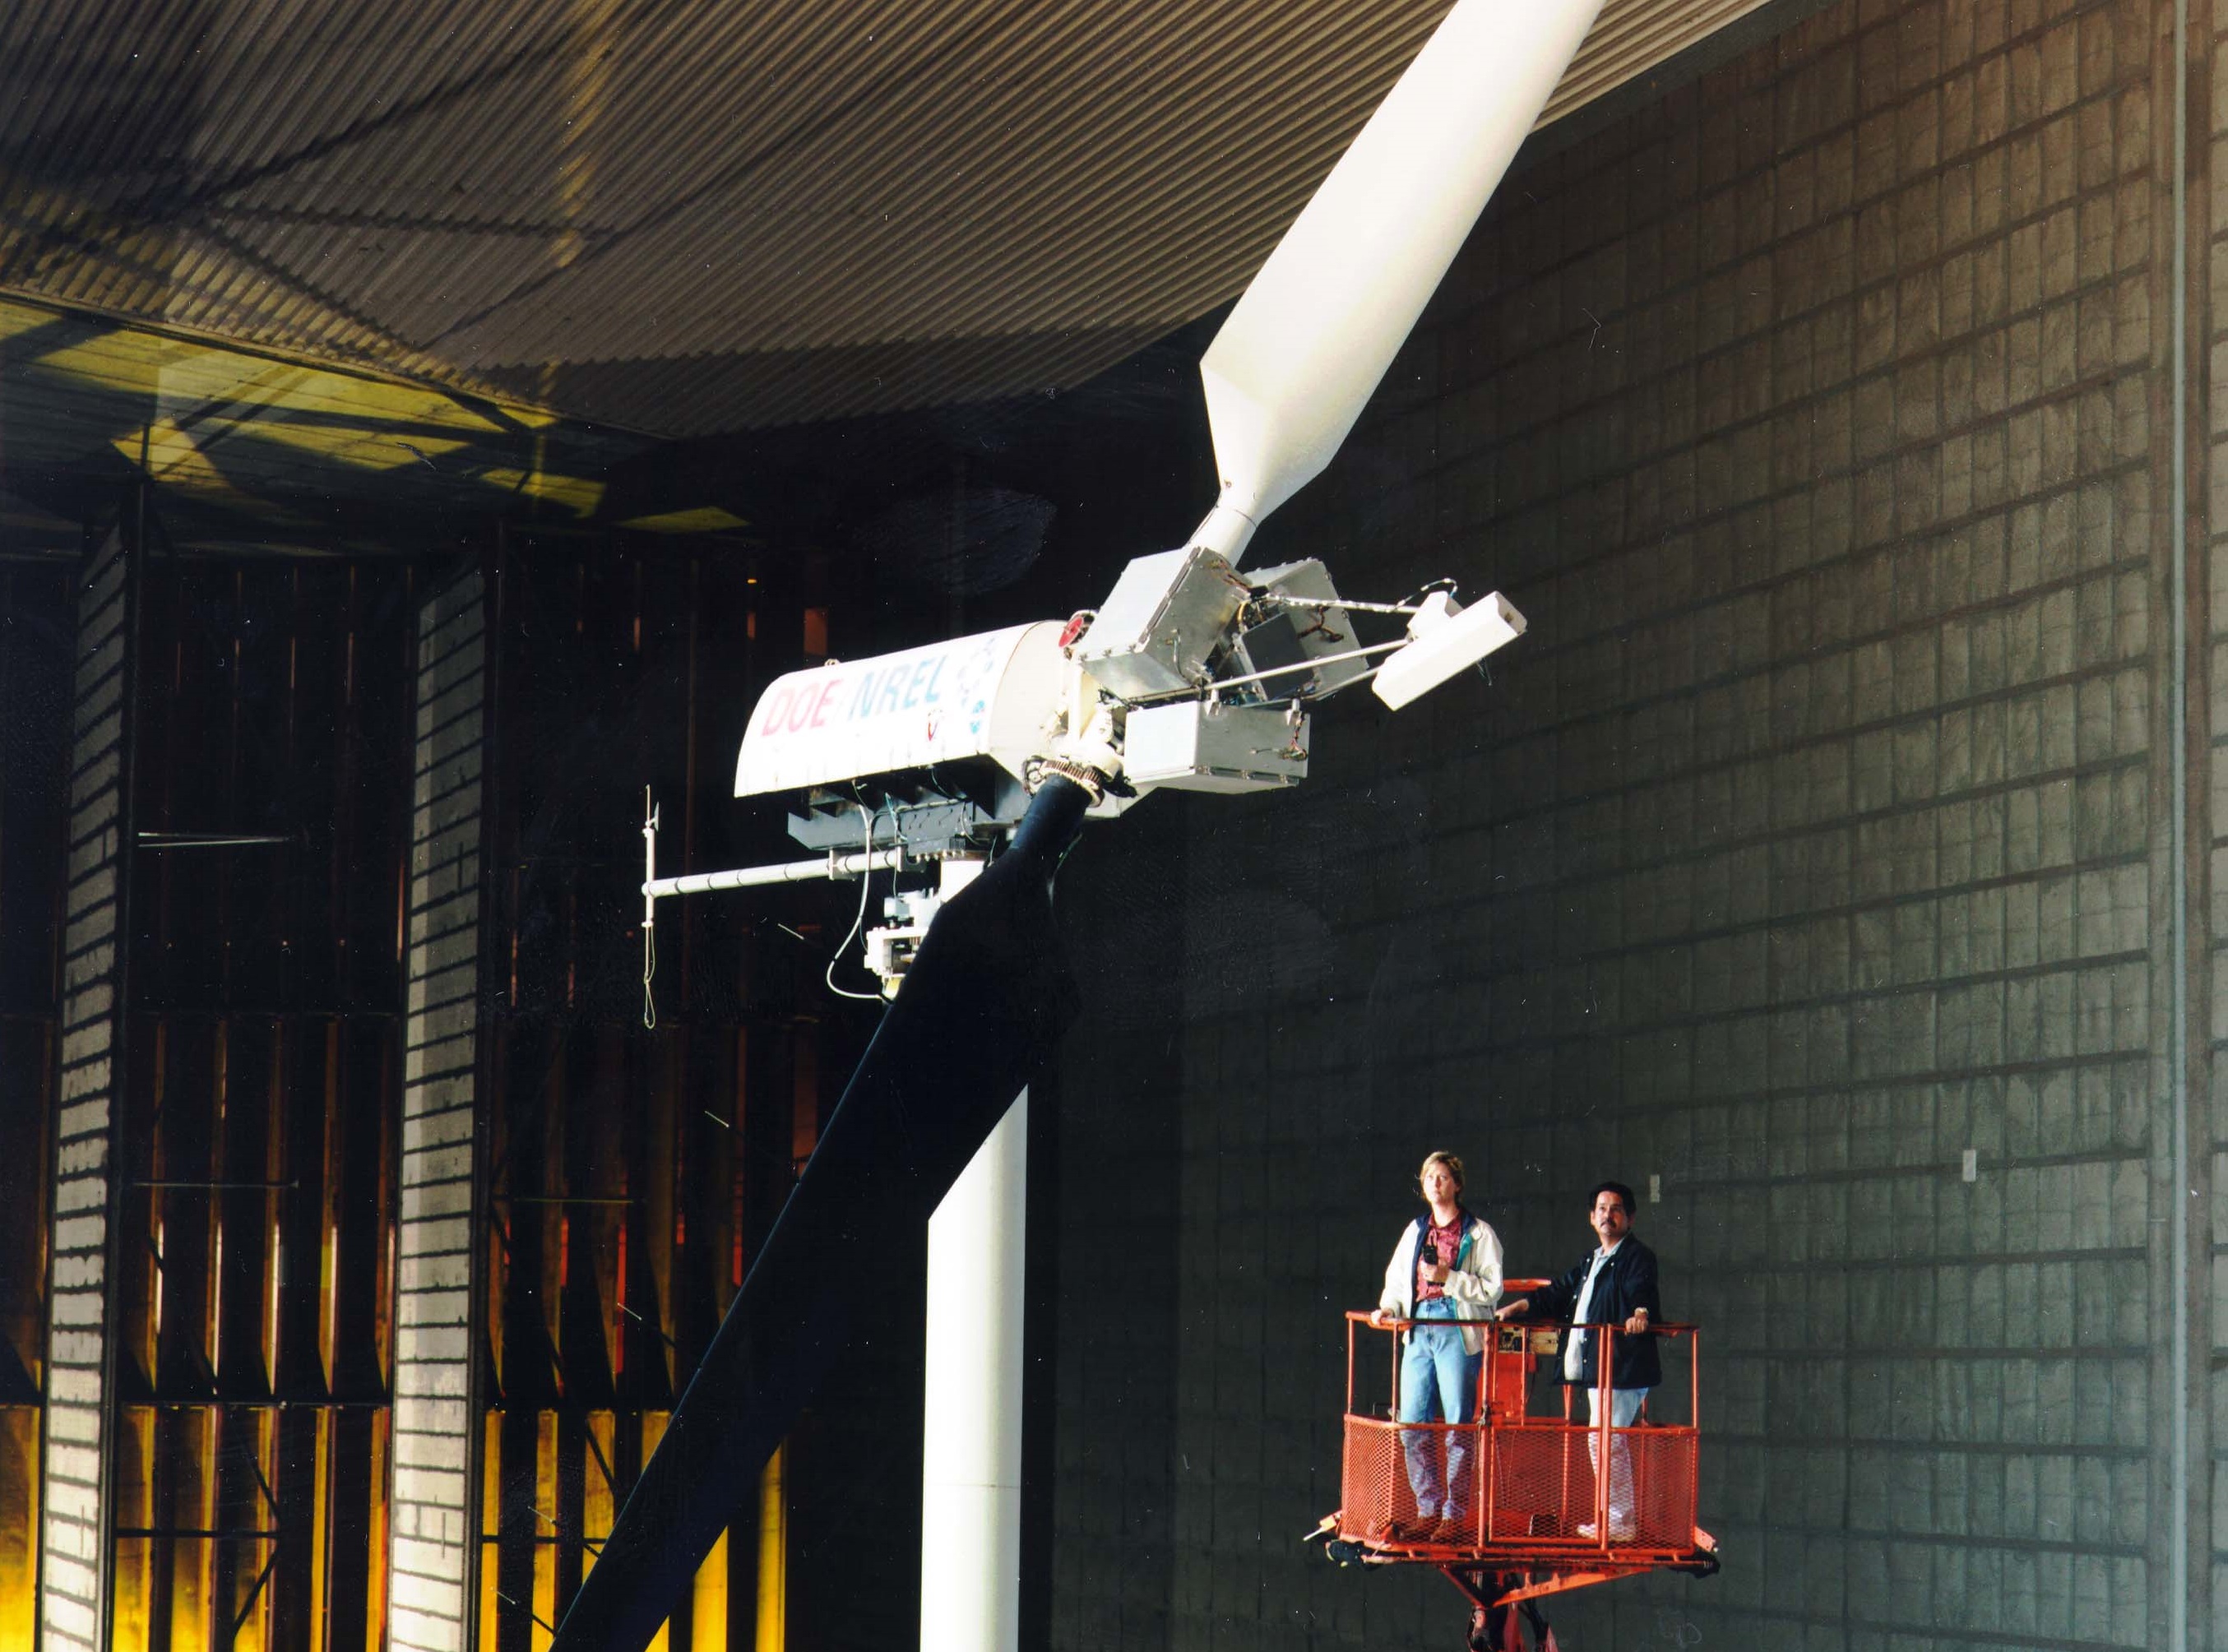
NASA’s Ames Research Center and the U.S. Department of Energy’s National Renewable Energy Laboratory (NREL) testing a research wind turbine in the world’s largest wind tunnel in April of 2000. Credit: NASA
A rotor consists of the blades that capture the wind’s energy and a shaft, which converts the wind energy to low-speed rotational energy. The generator – which is connected to the shaft – converts the slow rotation to high into electrical energy using a series of magnets and a conductor (which usually consists of coiled copper wire).
When the magnets rotate around with the copper wire, its produces a difference in electrical potential, creating voltage and an electric current. Lastly, there is the structural support component, which ensures that the turbine either stands at a high enough altitudes to optimally capture changes in wind pressure, and/or face in the direction of wind flow.
Types of Wind Turbines:
At present, there are two main types of wind turbines – Horizontal Axis Wind Turbines (HAWT) and Vertical Axis Wind Turbines (VAWT). As the name would imply, horizontal wind turbines have a main rotor shaft and electrical generator at the top of a tower, with the blades pointed into the wind. The turbine is usually positioned upwind of its supporting tower, since the tower is likely to produce turbulence behind it.
Vertical axis turbines (once again, as the name implies) have the main rotor shaft arranged vertically. Typically, these are smaller in nature, and do not need to be pointed in the direction of the wind in order to rotate. They are thereby being able to take advantage of wind that is variable in terms of direction.
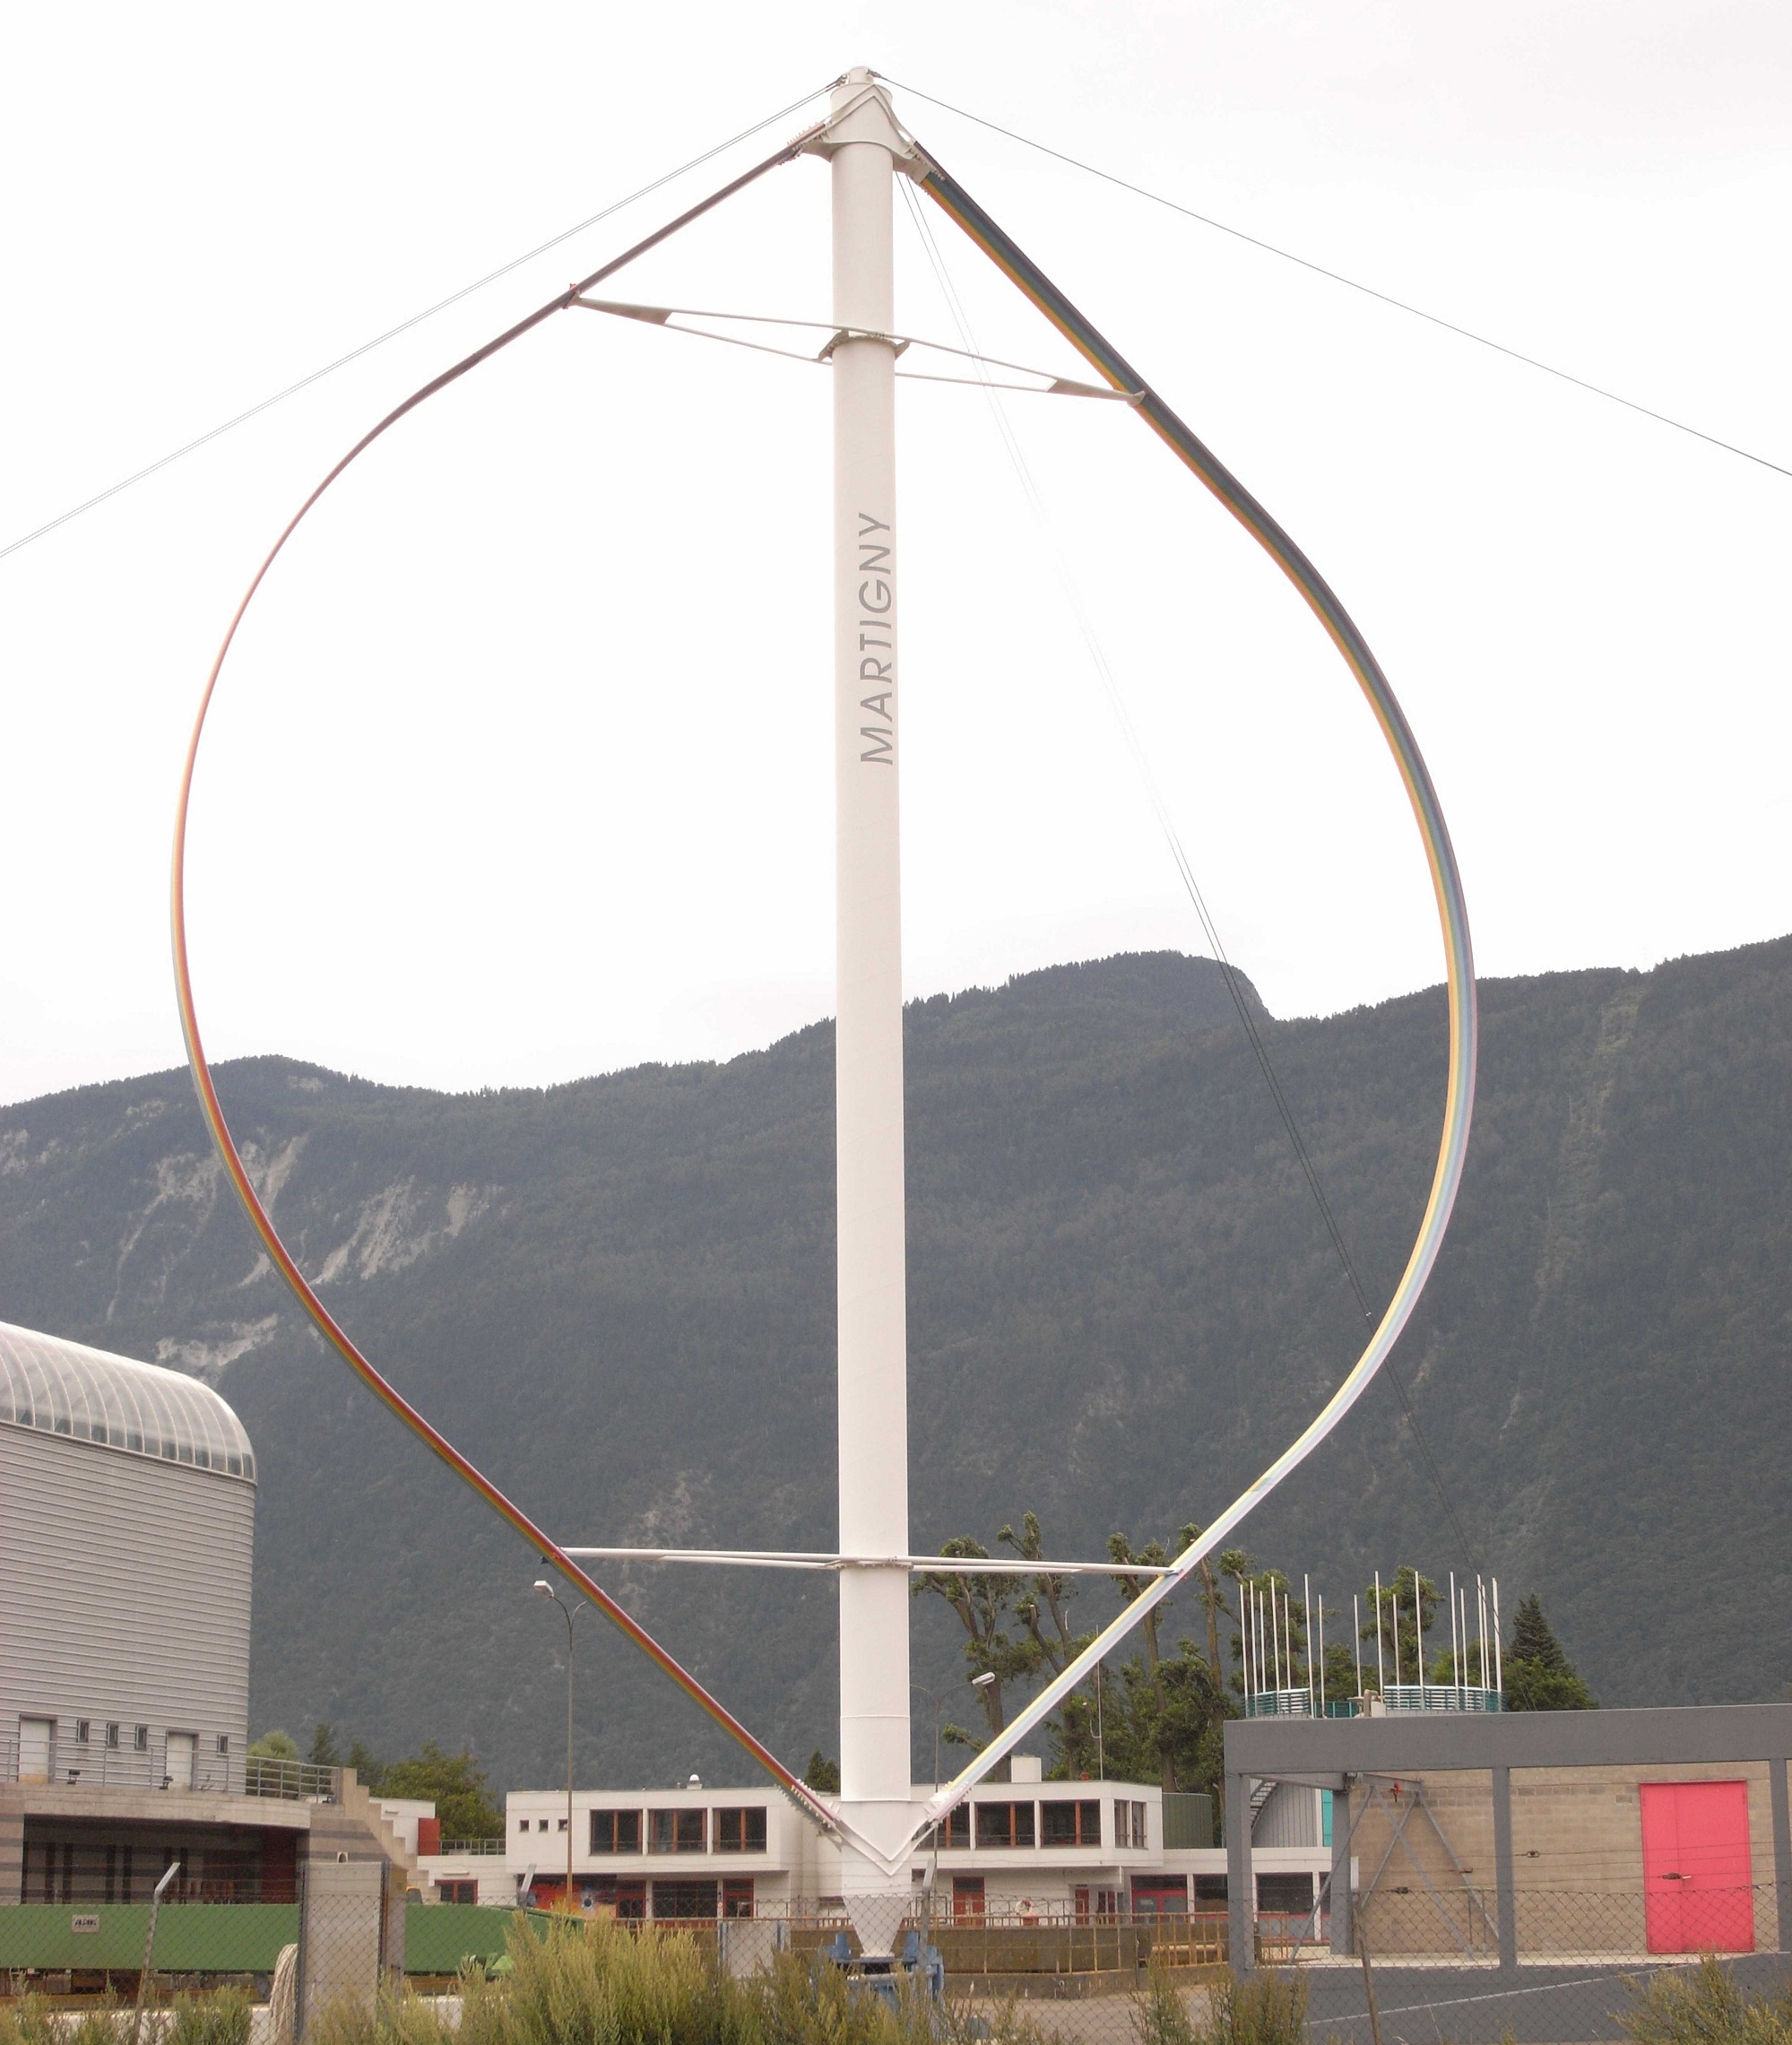
A Darrieus wind turbine, located in Martigny, Switzerland. Credit: Wikipedia Commons/Lysippos
In general, horizontal axis wind turbines are considered more efficient and can produce more power. While the vertical model generates less electricity it can be placed at lower elevations and needs less in the way of components (particularly a yaw mechanism). Wind turbines can also be divided into three general groups based on their design, which includes the Towered,Savonius, and Darrieus models.
The towered model is the most conventional form of HAWT, consisting of a tower (as the name would suggest) and a series of long blades that sit ahead of (and parallel to) the tower. The Savonis is a VAWT model that relies on contoured blades (scoops) to capture wind and spin. They are generally low-efficiency, but have the benefit of being self-starting. These sorts of turbines are often part of rooftop wind operations or mounted on sea vessels.
The Darrieus model, also known as an “Eggbeater” turbine, is named after the French inventor who pioneered the design – Georges Darrieus. This VAWT model employs a series of vertical blades that sit parallel to the vertical support. They are generally low efficiency, require an additional rotor to start turning, produce high-torque, and place high stress on the tower. Hence, they are considered unreliable as designs go.
History of Development:
Wind power has been used for thousands of years to push sails, power windmills, or to generate pressure for water pumps. The earliest known examples come from Central Asia, where windmills used in ancient Persia (Iran) have been dated to between 500 – 900 CE. The technology began to appear in Europe during the Middle Ages, and became a common feature by the 16th century.
The first automatically operated wind turbine, built in Cleveland in 1887 by Charles F. Brush. Credit: Wikipedia Commons
By the 19th century, with the development of electrical power, the first wind turbines capable of generating electricity were built. The first was installed in 1887 by Scottish academic James Blyth to light his holiday home in Marykirk, Scotland. In 1888, American inventor Charles F. Brush built the first automated wind turbine to power his home in Cleveland, Ohio.
By the early 20th century, wind turbines began to become a common means of powering homes in remote areas (such as farmsteads). In 1941, the first megawatt-class wind turbine was installed in Vermont and attached to the local utility grid. In 1951, the UK installed its first utility-grid connected wind turbine in the Orkney Islands.
By the 1970s, research and development into wind turbine technology advanced considerably thanks to the OPEC crisis and protests against nuclear power. In the ensuing decades, associations and lobbyists dedicated to alternative energy began to emerge in western European nations and the United States. By the final decade of the 20th century, similar efforts emerged in India and China due to growing air pollution and rising demand for clean energy.
Wind Power:
Compared to other forms of renewable energy, wind power is considered very reliable and steady, as wind is consistent from year to year and does not diminish during peak hours of demand. Initially, the construction of wind farms was a costly venture. But thanks to recent improvements, wind power has begun to set peak prices in wholesale energy markets worldwide and cut into the revenues and profits of the fossil fuel industry.
Cross-section of a vertical wind turbine. Credit: energy.gov
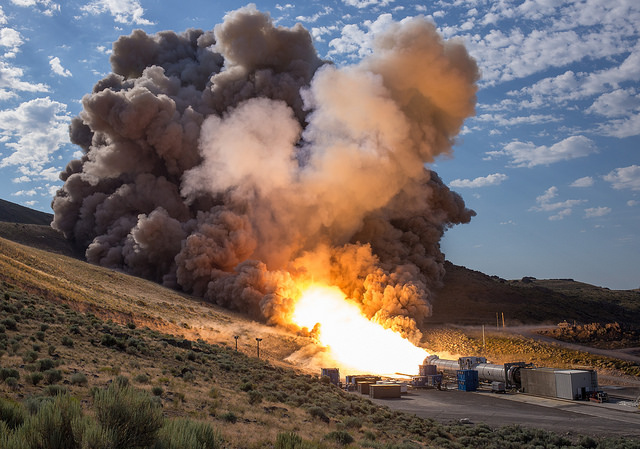
According to a report issued by the Department of Energy in March of 2015, the growth of wind power in the United States could lead to even more highly skilled jobs in many categories. Titled “Wind Vision: A New Era for Wind Power in the United States”, the document indicates that by 2050, the industry could account for as much as 35% of the US’ electrical production.
In addition, in 2014, the Global Wind Energy Council and Greenpeace International came together to publish a report titled “Global Wind Energy Outlook 2014”. This report stated that worldwide, wind power could provide as much as 25 to 30% of global electricity by 2050. At the time of the report’s writing, commercial installations in more than 90 countries had a total capacity of 318 gigawatts (GW), providing about 3.1% of global supply.
This represents a nearly sixteen-fold increase in the rate of adoption since the year 2000, when wind power accounted for less than 0.2%. Another way to look at it would be to say that the market share of wind power has doubled four times in less than 15 years. This places it second only to solar power, which doubled seven times over in the same period, but still trails wind in terms of its overall market share (at about 1% by 2014).
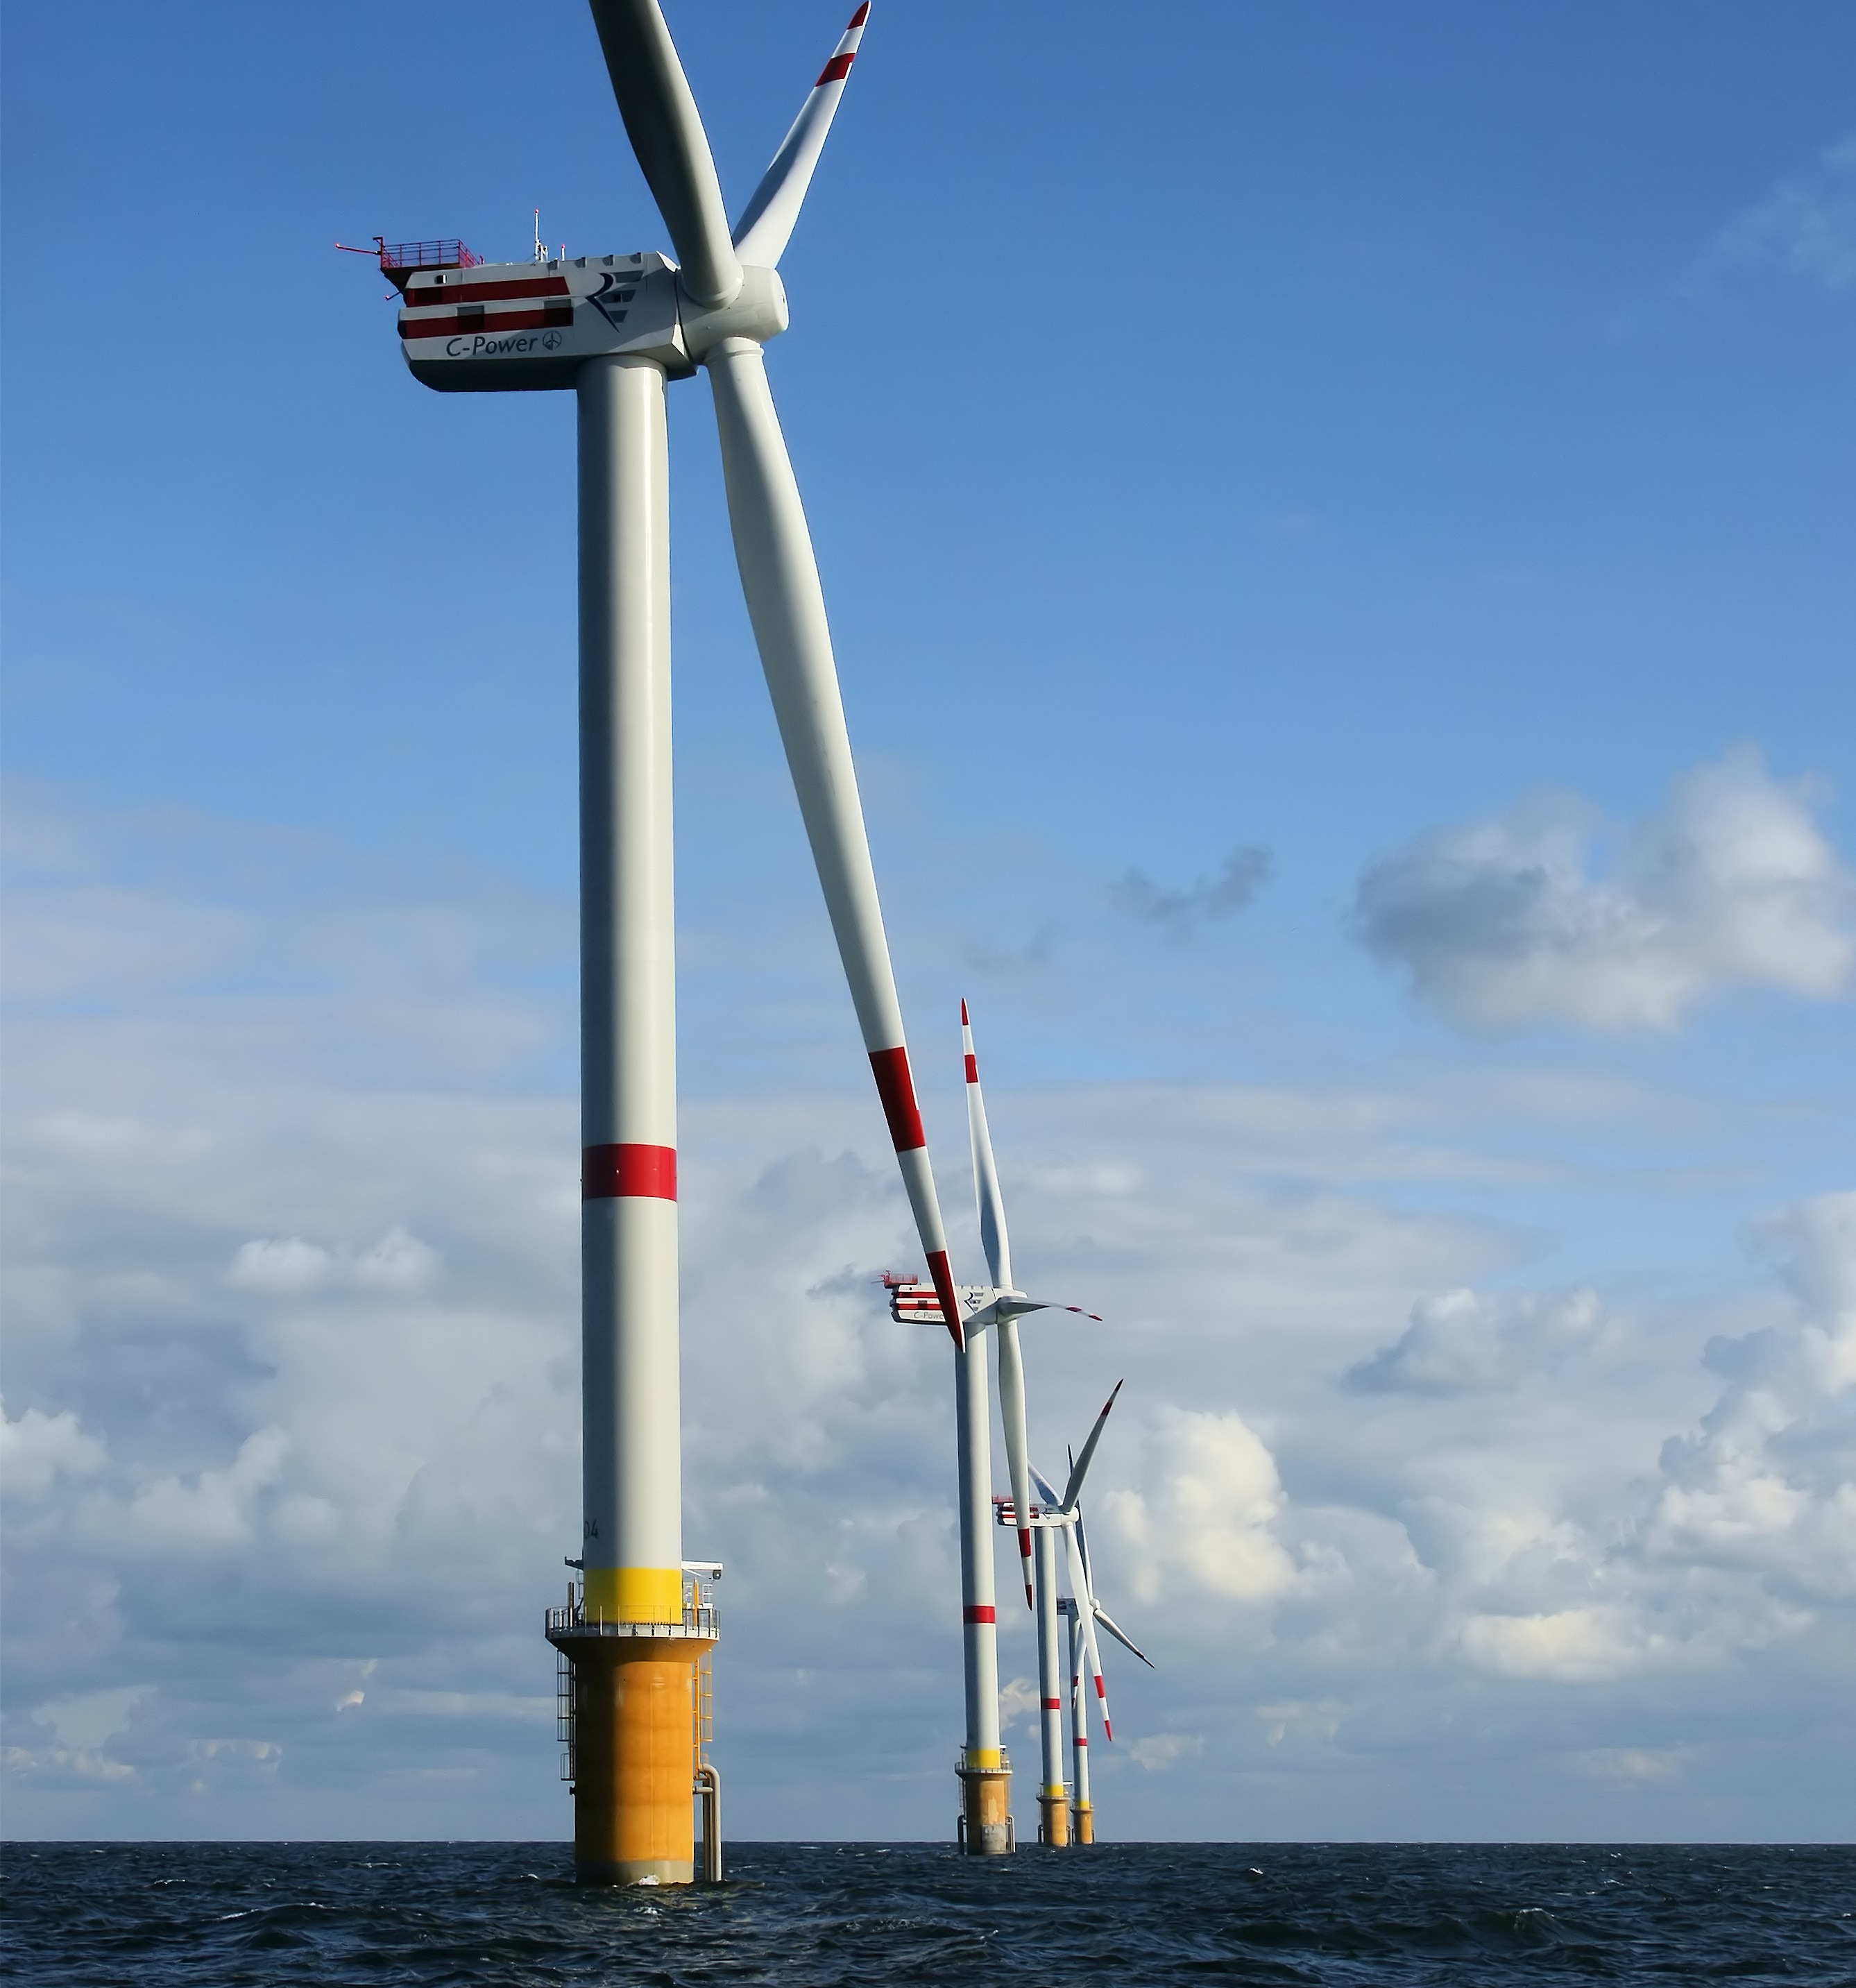
An offshore wind farm located off the coast of Belgium. Credit: Wikipedia Commons/Hans Hillewaert
In terms of its disadvantages, one consistently raised issue is the effect wind turbines have on local wildlife, and the disturbance their presence has on the local landscape. However, these concerns have often been shown to be inflated by special interest groups and lobbyists seeking to discredit wind power and other renewable energy sources.
For instance, a 2009 study released by the National Renewable Energy Laboratory determined that less than 1 acre per megawatt is disturbed permanently by the construction of large-scale wind farms, and less than 3.5 acres per megawatt are disturbed temporarily. The same study concluded that the impacts are relatively low on bird and bat wildlife, and that the same conclusions hold true for offshore platforms.
All over the world, governments and local communities are looking to wind power in order to meet their energy needs. In an age of rising fuel prices, growing concerns over Climate Change, and improving technology, this is hardly surprising. At its current rate of adoption, it is likely to be one of the largest sources of energy by mid-century.
And be sure to enjoy this video about wind turbines, courtesy of NASA’s Lewis Research Center:
The first ten IridiumNEXT satellites are stacked and encapsulated in the Falcon 9 fairing for launch from Vandenberg Air Force Base, Ca., in early 2017. Credit: Iridium
The first ten IridiumNEXT satellites are stacked and encapsulated in the Falcon 9 fairing for launch from Vandenberg Air Force Base, Ca., in early 2017. Credit: Iridium
“Milestone Alert: The first ten #IridiumNEXT satellites are stacked and encapsulated in the Falcon 9 fairing,” Iridium Communications announced on the company website on Thursday, Dec. 29.
The excitement of a possibly imminent liftoff is clearly building – at least for Iridium Communications and their CEO Matt Desch.
“Our first 10 #IridiumNEXT satellites are all fueled now, tucked in and dreaming of flying in space. Very. Soon. Happy Holidays!” Iridium Communications CEO Matt Desch tweeted on Christmas Day, Dec. 25, 2016.
But SpaceX is still dealing with the fallout from the catastrophic launch pad explosion that eviscerated a Falcon 9 and its expensive commercial payload in Florida without warning, during a routine fueling test on Sept. 1, 2016.
Liftoff of the SpaceX Falcon 9 with the payload of 10 identical next generation IridiumNEXT communications satellites from Vandenberg’s Space Launch Complex 4-East could come as soon as next week – in early January 2017 perhaps as soon as Jan. 7.
IridiumNEXT satellites being fueled, pressurized & stacked on dispenser tiers at Vandenberg AFB for Falcon 9 launch. Credit: Iridium
SpaceX CEO Elon Musk had said he hoped to resume Falcon 9 launches before the end of this year 2016 – while investigating the root cause of the devastating mishap.
But the launch has been repeatedly postponed and pushed off into 2017 while investigators plumb the data for clues and fix whatever flaws are uncovered.
“Iridium’s @Falcon9_rocket in processing at @VandenbergAFB, getting ready for our launch in early Jan. Progress! #Thistimeitsforreal!” Desch elaborated.
Nevertheless, there has been no official statement issued by either SpaceX or Iridium Communications announcing a specific target launch date.
And the liftoff is completely dependent on achieving FAA approval for the Falcon 9 launch.
“This launch is contingent upon the FAA’s approval of SpaceX’s return to flight following the anomaly that occurred on September 1, 2016 at Cape Canaveral Air Force Station, Florida,” Iridium said in a prior statement, reported here.
All SpaceX Falcon 9 launches immediately ground to a halt following the colossal eruption of a fireball from the Falcon 9 at the launch pad that suddenly destroyed the rocket and completely consumed its $200 million Israeli Amos-6 commercial payload on Sept. 1 during a routine fueling and planned static fire engine test at Cape Canaveral Air Force Station in Florida.
The explosive anomaly resulted from a “large breach” in the cryogenic helium system of the second stage liquid oxygen tank and subsequent ignition of the highly flammable oxygen propellant.
Meanwhile, SpaceX and Iridium are preparing the payload and rocket for launch as soon as possible after FAA approval is granted.
“Satellites have been fueled, pressurized & dispenser tiers are being stacked as we move closer to first launch #IridiumNEXT #NEXTevolution,” Iridium elaborated with photos showing the recent processing in progress.
The Iridium mission is the first of seven planned Falcon 9 launches – totaling 70 satellites.
“Iridium is replacing its existing constellation by sending 70 Iridium NEXT satellites into space on a SpaceX Falcon 9 rocket over 7 different launches,” says Iridium.
“There were many challenges on the program, from orbit determination knowledge design, to encryption design, to integration and verification test planning, to planning for on orbit acceptance activities, but the team made it all come together and the satellites are ready for deployment to enhance the future of mobile satellite communications — I could not be more proud,” Joel Rademacher, Ph.D, Director, Systems Engineering for Iridium Next, said in a statement.
The goal of this privately contracted mission is to deliver the first 10 Iridium NEXT satellites into low-earth orbit to inaugurate what will be a new constellation of satellites dedicated to mobile voice and data communications.
Iridium eventually plans to launch a constellation of 81 Iridium NEXT satellites into low-earth orbit.
“At least 70 of which will be launched by SpaceX,” per Iridium’s contract with SpaceX.
Iridium’s SpaceX Falcon9 rocket in processing at Vandenberg Air Force Base, getting ready for launch in early Jan. 2017. Credit: Iridium
Besides the launch, SpaceX plans to continue its secondary objective of recovering the Falcon 9 first stage via a propulsive soft landing – as done several times previously and witnessed by this author.
The goal is to eventually recycle and reuse the first stage – and thereby dramatically slash launch costs per Musk’s vision.
This Falcon 9 has been outfitted with four landing lags and grid fins for a controlled landing on a tiny barge prepositioned in the Pacific Ocean several hundred miles off the west coast of California.
SpaceX Falcon 9 launches and lands over Port Canaveral in this streak shot showing rockets midnight liftoff from Space Launch Complex 40 at Cape Canaveral Air Force Station in Florida at 12:45 a.m. EDT on July 18, 2016 carrying Dragon CRS-9 craft to the International Space Station (ISS) with almost 5,000 pounds of cargo and docking port. View from atop Exploration Tower in Port Canaveral. Credit: Ken Kremer/kenkremer.com
Desch says that all seven of his Falcon’s will be new – not resued.
“All our seven F9s are new,” Desch tweeted.
Incredible sight of pleasure craft zooming past SpaceX Falcon 9 booster from Thaicom-8 launch on May 27, 2016 as it arrives at the mouth of Port Canaveral, FL, atop droneship platform on June 2, 2016. Credit: Ken Kremer/kenkremer.com
On the Florida Space Coast, SpaceX plans to initially resume launches at the Kennedy Space Center (KSC) from pad 39A, the former shuttle pad that SpaceX has leased from NASA.
Commercial SpaceX launches at KSC could start from pad 39A sometime in early 2017 – after modifications for the Falcon 9 are completed.
Meanwhile pad 40, which was heavily damaged during the Sept. 1 explosion, is undergoing extensive repairs and refurbishments to bring it back online.
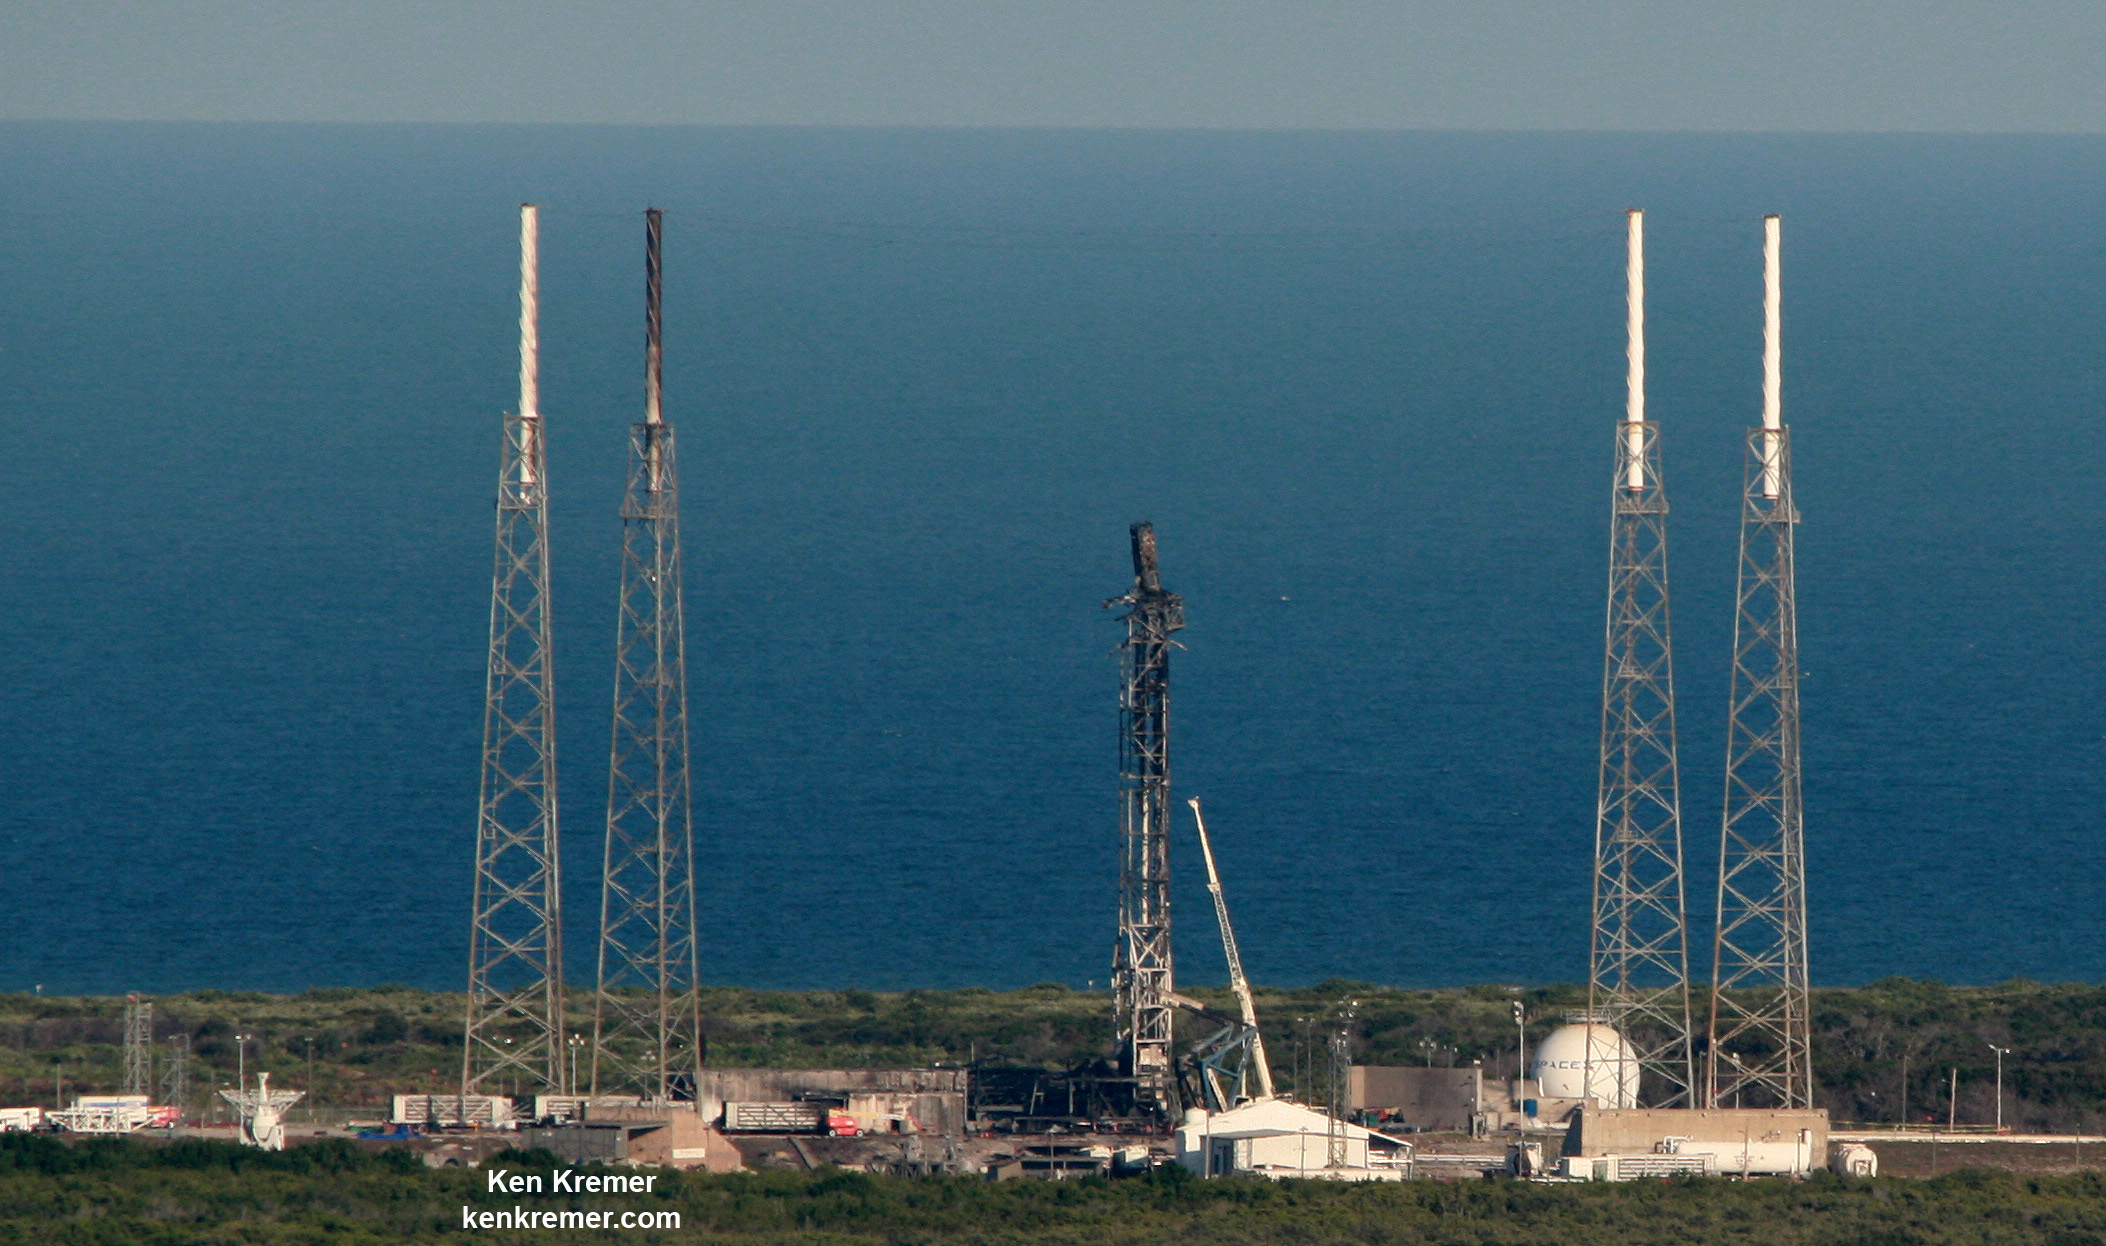
Aerial view of pad and strongback damage at SpaceX Launch Complex-40 as seen from the VAB roof on Sept. 8, 2016 after fueling test explosion destroyed the Falcon 9 rocket and AMOS-6 payload at Cape Canaveral Air Force Station, FL on Sept. 1, 2016. Credit: Ken Kremer/kenkremer.com
It is not known when pad 40 will be fit to resume Falcon 9 launches.
Stay tuned here for Ken’s continuing Earth and Planetary science and human spaceflight news.
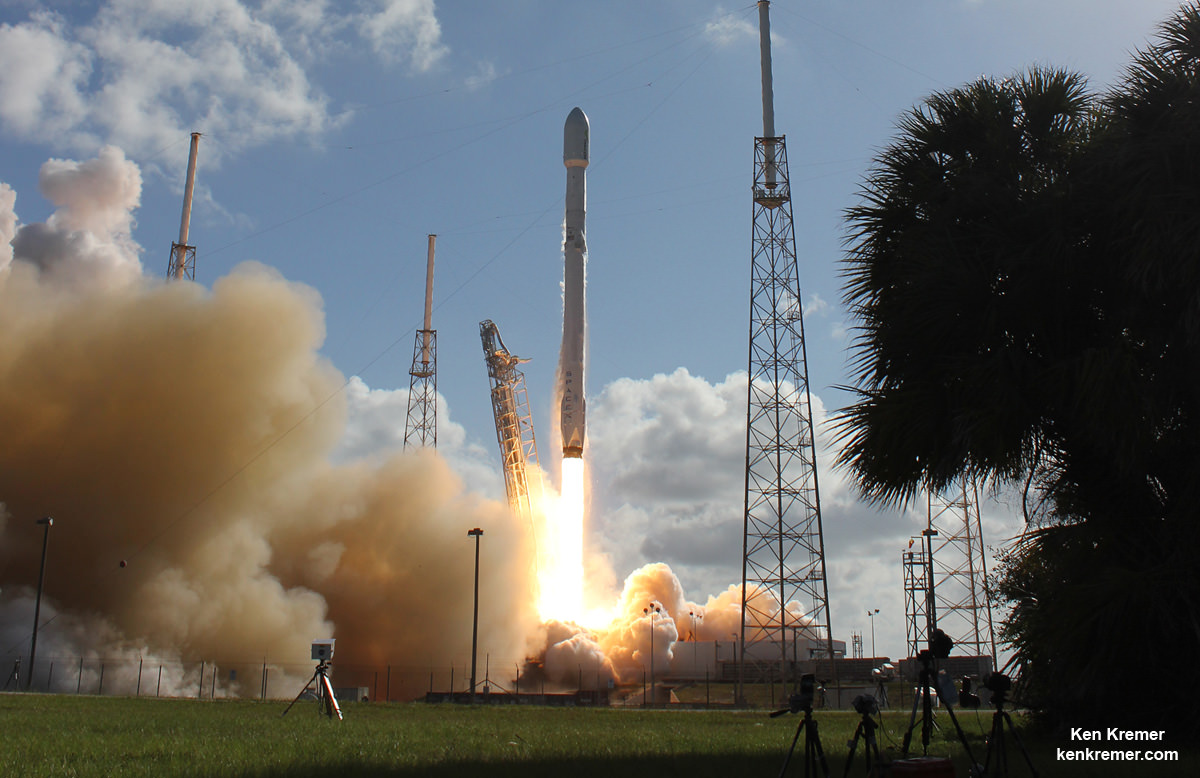
Upgraded SpaceX Falcon 9 blasts off with Thaicom-8 communications satellite on May 27, 2016 from Space Launch Complex 40 at Cape Canaveral Air Force Station, FL. 1st stage booster landed safely at sea minutes later. Credit: Ken Kremer/kenkremer.com