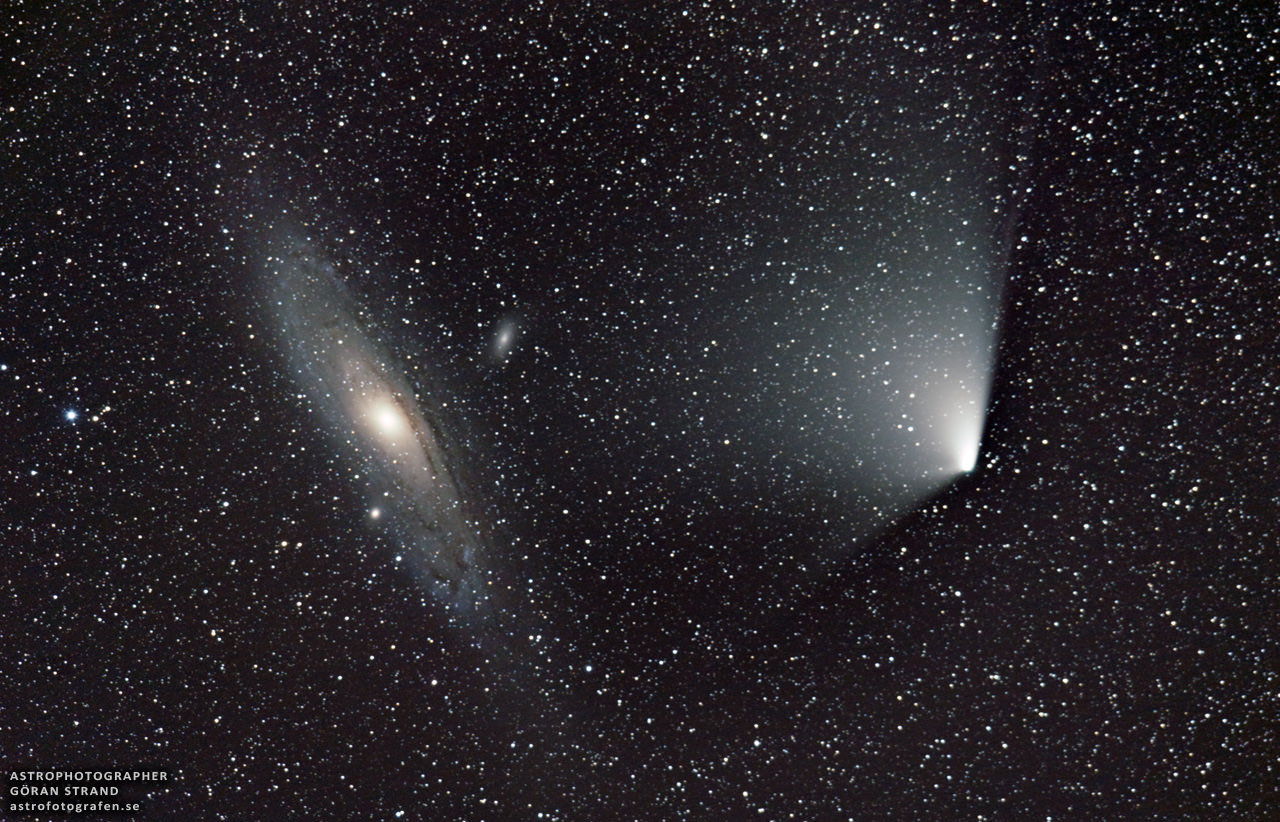
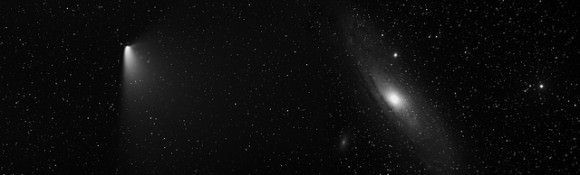
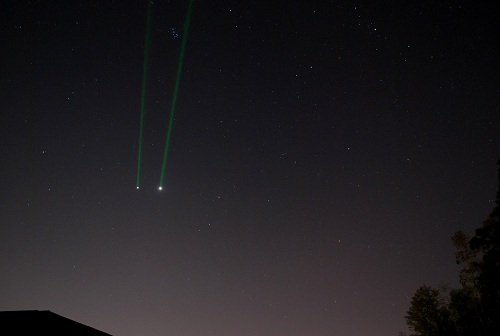
Comet PANSTARRS and M31 on April 4, 2013, as seen from Sweden. Credit and copyright: Göran Strand.
More of our readers had success in capturing the awesomeness of seeing Comet PANSTARRS encounter the Andromeda Galaxy (M31) in the night sky. Göran Strand sent us this absolutely gorgeous image, taken from 70 km north of Östersund, Sweden — a really dark site with no light pollution. “This photo is a 30 minute exposure through my 300mm/f2.8 lens using my full format Nikon D3s camera,” Göran said. “Besides seeing the comet and the galaxy, I also got to see 4 elks, 2 meteors, 1 bolide and 1 aurora. So all in all, it was a good night!”
That’s for sure!
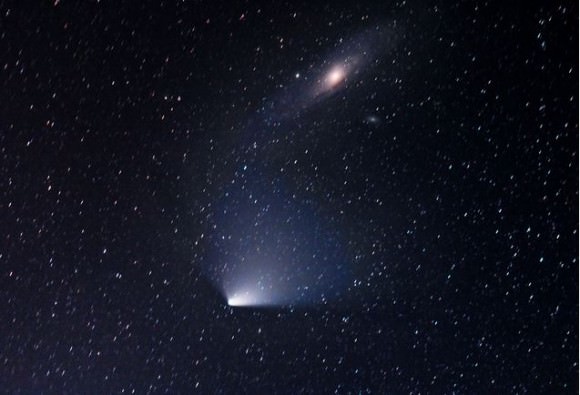
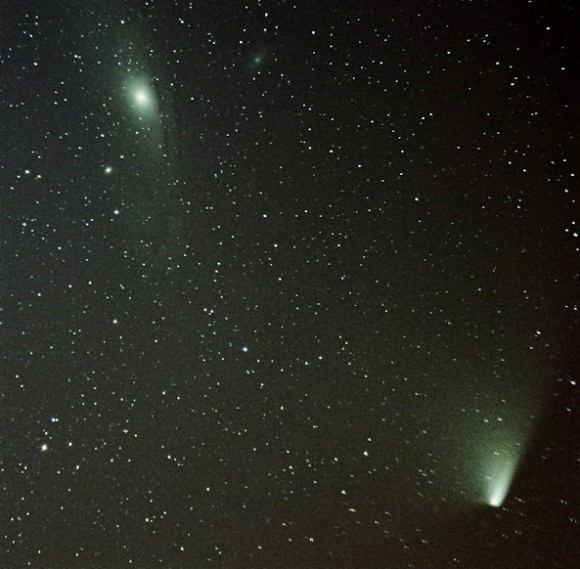
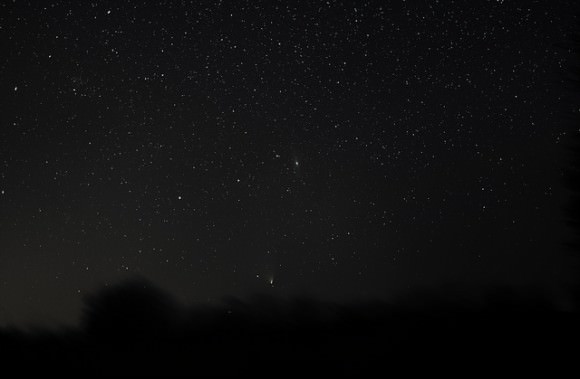
See more images below of this great meet-up in the skies, and see our earlier post of our readers’ images here.
Comet C/2011 L4 Panstarrs and the Andromeda Galaxy: Two Frame Mosaic from New Mexico Skies, April 4, 2013. Taken from New Mexico Skies at 23:22 UT using an FSQ 10.6-cm and STL11K camera. Credit and copyright: Joseph Brimacombe.The encounter between Comet PANSTARRS and the Andromeda Galaxy, as seen from Ireland. ‘A difficult image to capture due to low cloud, the low altitude of the target and tracking Issue.’ Image details: Date: 03 Apr 2013, 22:30-23:30 Exposure: 9 x 5min, ISO 1600, F5, 6 x dark frames, 6 x flats frames. Equipment: Canon 1000D, CG5 Mount, Sigma 70-300mm set at 200mm. Credit and copyright: Brendan Alexander.Comet PANSTARRS and M31 taken from the Scottish Dark Sky Observatory on April 3, 2013. Credit and copyright: Dave Hancox via Google+.Comet C/2011 L4 (PANSTARRS) and M31 (Andromeda Galaxy) taken from just outside St Clears, Carmarthenshire, Wales on 29th March 2013 around 9pm. Credit and copyright: Pete Newman.
Want to get your astrophoto featured on Universe Today? Join our Flickr group or send us your images by email (this means you’re giving us permission to post them). Please explain what’s in the picture, when you took it, the equipment you used, etc.
Gemini 8 was in trouble. The spacecraft was spinning rapidly, the astronauts were fighting to stay conscious, and worst of all — they were out of the reach of NASA’s Mission Control.
The astronauts eventually did make contact during that 1966 mission, and splashed down safely. Still, the incident illustrated a weakness of having scattered ground stations staying in touch with orbiting spacecraft. NASA had a large network of stations, including ships and remote satellite dishes, but there were large gaps in coverage.
Today, NASA and Roscosmos (the Russian space agency) have virtually 100% communications contact with orbiting astronauts and cosmonauts in the International Space Station, including video. That’s due to a network of satellites called the Tracking and Data Relay Satellite system. The first of these satellites launched 30 years ago today (April 5) in 1983.
A United Launch Alliance Atlas V 401 rocket streaks away from Space Launch Complex 41 into the night sky over Cape Canaveral Air Force Station in Florida, carrying NASA’s Tracking and Data Relay Satellite-K, TDRS-K, to orbit. Credit: NASA/Glenn Benson
TDRS includes seven operational satellites that are in geosynchronous orbit (essentially, in an orbit that keeps them above a fixed location on Earth.) The satellites are designed to serve spacecraft that are orbiting in low Earth orbit, above 45 miles (73 kilometers) in altitude. They’re spaced out to make sure that customers receive coverage throughout the orbit. Operations on the ground consist of two ground terminals located near Las Cruces, New Mexico.
Launching these satellites took years. Although the first satellite was deployed successfully, the second one was destroyed in the Challenger shuttle explosion of 1986. The rest of the first generation of TDRS satellites went into space between 1988 and 1995. Three more advanced satellites then launched between 2000 and 2002.
This means the TDRS fleet is getting pretty old, but luckily, there are fresh replacements on the way. TDRS-K launched in January and is still being tested before assuming operational status. TDRS-L will launch in 2014, and TDRS-M in 2015.
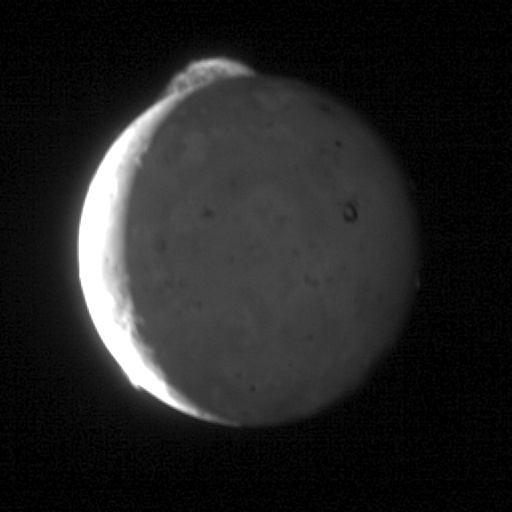
This five-frame sequence of images from NASA's New Horizons mission captures the giant plume from Io's Tvashtar volcano in March, 2007. Credit: NASA/Johns Hopkins University Applied Physics Laboratory/Southwest Research Institute.
Jupiter’s moon Io features at least 400 active volcanoes, making it the most volcanically active world in our Solar System. However, the location of the volcanoes on Io just doesn’t match up with scientific models that predict how the moon’s interior is heated.
“Rigorous statistical analysis of the distribution of volcanoes in the new global geologic map of Io,” said Christopher Hamilton of the University of Maryland, College Park and the Goddard Spaceflight Center. “We found a systematic eastward offset between observed and predicted volcano locations that can’t be reconciled with any existing solid body tidal heating models.”
Io’s internal heat is created by the tidal forces inflicted from the giant planet Jupiter on one side and from two neighboring moons that orbit further from Jupiter – Europa and Ganymede on the other.
Researchers say there are questions about how this tidal heating affects the moon’s interior. Some propose it heats up the deep interior, but the prevailing view is that most of the heating occurs within a relatively shallow layer under the crust, called the asthenosphere. The asthenosphere is where rock behaves like putty, slowly deforming under heat and pressure.
“Our analysis supports the prevailing view that most of the heat is generated in the asthenosphere, but we found that volcanic activity is located 30 to 60 degrees East from where we expect it to be,” said Hamilton.
On Earth, a simple explanation how volcanoes are created is that when tectonic plates shift in such a way, the subsurface magma is able to flow onto the surface. On Io, the tidal forces from Jupiter actually force Io’s surface to bulge up and down by as much as 100 m, causing magma to flow continuously.
The scientists explained the tug-of-war between Jupiter’s massive gravity and the smaller but precisely timed pulls from two neighboring moons like this:
Io orbits faster than these other moons, completing two orbits every time Europa finishes one, and four orbits for each one Ganymede makes. This regular timing means that Io feels the strongest gravitational pull from its neighboring moons in the same orbital location, which distorts Io’s orbit into an oval shape. This in turn causes Io to flex as it moves around Jupiter.
For example, as Io gets closer to Jupiter, the giant planet’s powerful gravity deforms the moon toward it and then, as Io moves farther away, the gravitational pull decreases and the moon relaxes. The flexing from gravity causes tidal heating — in the same way that you can heat up a spot on a wire coat hanger by repeatedly bending it, the flexing creates friction in Io’s interior, which generates the tremendous heat that powers the moon’s extreme volcanism.
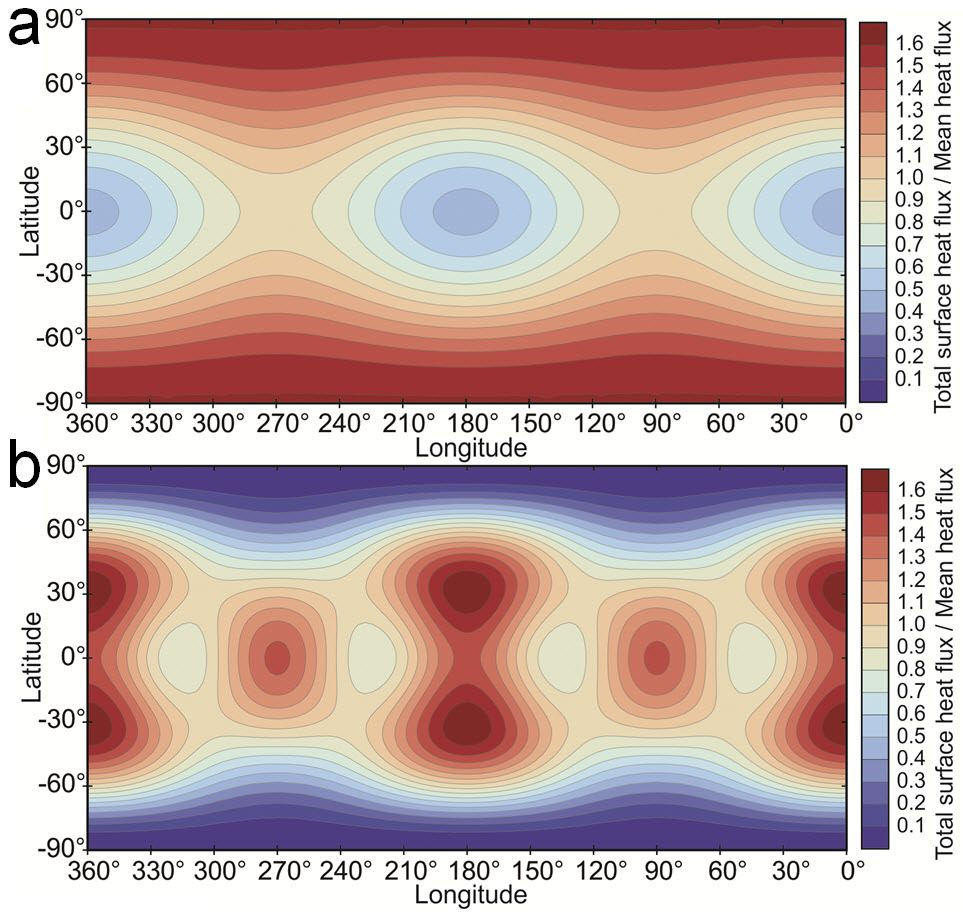
This is a map of the predicted heat flow at the surface of Io from different tidal heating models. Red areas are where more heat is expected at the surface while blue areas are where less heat is expected. Figure A shows the expected distribution of heat on Io’s surface if tidal heating occurred primarily within the deep mantle, and figure B is the surface heat flow pattern expected if heating occurs primarily within the asthenosphere. In the deep mantle scenario, surface heat flow concentrates primarily at the poles, whereas in the asthenospheric heating scenario, surface heat flow concentrates near the equator. Credit: NASA/Christopher Hamilton.
But a new geologic map of Io showed the offset of the volcanoes from where the model predicted them to be.
Possibilities to explain the offset include a faster than expected rotation for Io, an interior structure that permits magma to travel significant distances from where the most heating occurs to the points where it is able erupt on the surface, or a missing component in existing tidal heating models, like fluid tides from an underground magma ocean, according to the team.
The magnetometer instrument on NASA’s Galileo mission detected a magnetic field around Io, suggesting the presence of a global subsurface magma ocean. As Io orbits Jupiter, it moves inside the planet’s vast magnetic field. Researchers think this could induce a magnetic field in Io if it had a global ocean of electrically conducting magma.
“Our analysis supports a global subsurface magma ocean scenario as one possible explanation for the offset between predicted and observed volcano locations on Io,” says Hamilton. “However, Io’s magma ocean would not be like the oceans on Earth. Instead of being a completely fluid layer, Io’s magma ocean would probably be more like a sponge with at least 20 percent silicate melt within a matrix of slowly deformable rock.”
Tidal heating is also thought to be responsible for oceans of liquid water likely to exist beneath the icy crusts of Europa and Saturn’s moon Enceladus. Since liquid water is a necessary ingredient for life, some researchers propose that life might exist in these subsurface seas if a useable energy source and a supply of raw materials are present as well. These worlds are far too cold to support liquid water on their surfaces, so a better understanding of how tidal heating works may reveal how it could sustain life in otherwise inhospitable places throughout the Universe.
“The unexpected eastward offset of the volcano locations is a clue that something is missing in our understanding of Io,” says Hamilton. “In a way, that’s our most important result. Our understanding of tidal heat production and its relationship to surface volcanism is incomplete. The interpretation for why we have the offset and other statistical patterns we observed is open, but I think we’ve enabled a lot of new questions, which is good.”
Io’s volcanism is so extensive that it gets completely resurfaced about once every million years or so, actually quite fast compared to the 4.5-billion-year age of the solar system. So in order to know more about Io’s past, we have to understand its interior structure better, because its surface is too young to record its full history, according to Hamilton.
An appropriate use of a laser during last year's Jupiter-Venus conjunction. (Photo by Author).
Those handheld green lasers pointers may not be as harmless as you thought.
A recent study released by researchers at the National Institute of Standards and Technology (NIST) has revealed an alarming trend. Of 122 hand-held laser pointers tested, 44% of red lasers and 90% of green lasers tested failed federal safety regulations.
The primary culprit was overpowered units. The Code of Federal Regulations in the United States limits commercial class IIIa lasers to 5 milliwatts (mW). And yes, lasers above 5 mW are commercially available in the United States, but it is illegal to market them as Class IIIa devices. Some units in the NIST study tested as high as 13 times over the legal limit at 66.5 mW. For context, many military grade rifle mounted lasers are rated at 50 mW.
A diagram of a typical diode-pumped solid-state laser. (Credit: NASA/Langley).
“Our results raise numerous safety questions regarding laser pointers and their use,” stated NIST laser safety officer in the recent paper presented at the Laser Safety Conference in Orlando, Florida.
Why should backyard astronomers care? Well, since hand-held lasers first became commercially available they’ve become a familiar staple at many public star parties. Reflecting back off of the dust and suspended particles in the atmosphere, a green laser provides a pointer beam allowing the user to trace out constellations and faint objects. Lasers can also be mounted on the optical tube assemblies of a telescope for pointing in lieu of a finder scope.
A typical 5mW green laser pointer. (Photo by Author).
An amateur astronomy club based near San Antonio, Texas even coordinated signaling the International Space Station with a pair of powerful searchlights and a 1 watt blue laser in 2012, just to prove that it was possible.
But such devices are not toys. Even a 5 mW laser can temporarily blind someone at short range. Further eye damage can often linger for days or even permanently and can go unnoticed. This is why researchers working around lasers in research facilities such as LIGO (the Laser Interferometer Gravitational Wave Observatory) must submit to routine eye exams.
Its not the Death Star… LIGO engineers practicing proper safety around the gravity wave observatory’s 35 watt Nd YAG laser. Credit: NSF/LIGO).
The trouble with green lasers is that, well, they look too much like light sabers.
It’s for this reason I keep mine on a very “short leash” at star parties and NEVER hand it off to anyone, no matter how well meaning, child or adult. I also NEVER point it below the local horizon, (there’s wildlife in them trees). A laser reflected inadvertently off of an optical surface such as a car window or primary mirror can also do just as much damage as a direct aiming.
And also, NEVER aim one at an aircraft. In fact, it’s a federal violation to do so. The Federal Aviation Administration has reported a 13-fold trend in reported aircraft/laser incidents from 2005 to 2011. There has also been an upward trend in individuals being tracked down and prosecuted for such offenses. If it blinks, assume it’s an aircraft and steer clear!
In a post-9/11 era, the Department of Homeland Security has been concerned with the potential threat posed by laser pointers as well. It’s not yet illegal to fly in the US with a 5mW laser pointer in your carry-on luggage, but and several countries now outlaw them all together, a note for traveling astronomers. Note that the de facto policy often comes down to the particular TSA officer you’re dealing with.
With this sort of news, we wonder if laser pointers might become outlawed entirely in the coming years. 5mW range lasers are generally classed IIIa or 3R systems. By the American National Standards Institute (ANSI) guidelines, such devices under the recent NIST study would fall into the much more hazardous IIIb range for 5-500 mW lasers. Such lasers can cause permanent eye damage with direct exposure for periods of as little as 1/100th of a second.
Safety distances for a 5mW green laser. (Wikimedia Commons graphic under a Creative Commons Attribution-ShareAlike 3.0 License).
It’s also worth noting that actual reported cases of laser injuries are fairly rare. A 2004 paper from the Archives of Ophthalmology cites 15 injuries worldwide each year, while a recent 2012 paper in PLoS ONE estimates “220 confirmed laser eye injuries have occurred between 1964 and 1996,” for an average of 6.9 laser injuries per year.
The Code of Federal Regulations limits output for green laser pointers to 5mW in the visible range and 2mW in the infrared. 75% of the tested devices exceed this standard for infrared emission as well. Note that there have been anecdotal reports that even the point source generated by a laser (say, by shining it against a wall) can be excessively bright. This recent NIST study was the first time we’d seen a back up argument for this. Many of the cheaper handheld lasers sold online (think in the 20$ USD range) may forgo the infrared filtering component all together.
So in lieu of an outright ban on laser pointers, what can be done? Joshua Hadler cites the need for a better accountability for laser manufacturers. “By relying on manufacturers’ traceability to a national measurement institute such as NIST, someone could use this design to accurately measure power from a laser pointer.” Mr. Hadler also notes that a simple test bed for laser pointers can be built using off the shelf parts for less than $2,000 USD. We’re surprised there’s not “an App/Kickstarter for that…” already. (Would-be designers take note!)
In the end, we’d hate to see these crucial tools for astronomy outreach banned just because a very few individuals were irresponsible with them. Through accountability from production to application, we can assure that laser pointers remain a vital part of the amateur astronomer’s tool kit.
“No scientific discovery is named after its discoverer,” – Stigler/Merton.
Edwin Hubble’s contributions to astronomy earned him the honor of having his name bestowed upon arguably the most famous space telescope (the Hubble Space Telescope, HST). Contributions that are often attributed to him include the discovery of the extragalactic scale (there exist countless other galaxies beyond the Milky Way), the expanding Universe (the Hubble constant), and a galaxy classification system (the Hubble Tuning Fork). However, certain astronomers are questioning Hubble’s pre-eminence in those topics, and if all the credit is warranted.
“[The above mentioned] discoveries … are well-known … and most astronomers would associate them solely with Edwin Hubble; yet this is a gross oversimplification. Astronomers and historians are beginning to revise that standard story and bring a more nuanced version to the public’s attention,” said NASA scientist Michael J. Way, who just published a new study entitled “Dismantling Hubble’s Legacy?”
Has history clouded our view of Hubble the man? Or are his contributions seminal to where we are today in astronomy?
Assigning credit for a discovery is not always straightforward, and Way 2013 notes, “How credit is awarded for a discovery is often a complex issue and should not be oversimplified – yet this happens time and again. Another well-known example in this field is the discovery of the Cosmic Microwave Background.” Indeed, controversy surrounds the discovery of the Universe’s accelerated expansion, which merely occurred in the late 1990s. Conversely, the discoveries attributed to Hubble transpired during the ~1920s.
The Hubble Space Telescope (image credit: NASA, tweaked by D. Majaess).
Prior to commencing this discussion, it’s emphasized that Hubble cannot defend his contribution since he died long ago (1889-1953). Moreover, we can certainly highlight the efforts of other individuals whose seminal contributions were overlooked without mitigating Hubble’s pertinence. The first topic discussed here is the discovery of the extragalactic scale. Prior to the 1920s it was unclear whether the Milky Way galaxy and the Universe were synonymous. In other words, was the Milky Way merely one among countless other galaxies?
Astronomers H. Shapley and H. Curtis argued the topic in the famed Island Universe debate (1920). Curtis believed in the extragalactic Universe, whereas Shapley took the opposing view (see also Trimble 1995 for a review). In the present author’s opinion, Hubble’s contributions helped end that debate a few years later and changed the course of astronomy, namely since he provided evidence of an extragalactic Universe using a distance indicator that was acknowledged as being reliable. Hubble used stars called Cepheid variables to help ascertain that M31 and NGC 6822 were more distant than the estimated size of the Milky Way, which in concert with their deduced size, implied they were galaxies. Incidentally, Hubble’s distances, and those of others, were not as reliable as believed (e.g., Fernie 1969, Peacock 2013). Peacock 2013 provides an interesting comparison between distance estimates cited by Hubble and Lundmark with present values, which reveals that both authors published distances that were flawed in some manner. Having said that, present-day estimates are themselves debated.
Hubble’s evidence helped convince even certain staunch opponents of the extragalactic interpretation such as Shapley, who upon receiving news from Hubble concerning his new findings remarked (1924), “Here is the letter that has destroyed my universe.” Way 2013 likewise notes that, “The issue [concerning the extragalactic scale] was effectively settled by two papers from Hubble in 1925 in which he derived distances from Cepheid variables found in M31 and M33 (Hubble 1925a) of 930,000 light years and in NGC 6822 (Hubble 1925c) of 700,000 light years.”
However, as table 1 from Way 2013 indicates (shown below), there were numerous astronomers who published distances that implied there were galaxies beyond the Milky Way. Astronomer Ian Steer, who helps maintain the NASA/IPAC Extragalactic Database of Redshift-Independent Distances (NED-D), has also compiled a list of 290 distances to galaxies published before 1930. Way 2013 added that, “Many important contributions to this story have been forgotten and most textbooks in astronomy today, if they discuss the “Island Universe” confirmation at all, bestow 100% of the credit on Hubble with scant attention to the earlier observations that clearly supported his measurements.”
Thus Hubble did not discover the extragalactic scale, but his work helped convince a broad array of astronomers of the Universe’s enormity. However, by comparison to present-day estimates, Hubble’s distances are too short owing partly to the existing Cepheid calibration he utilized (Fernie 1969, Peacock 2013 also notes that Hubble’s distances were flawed for other reasons). That offset permeated into certain determinations of the expansion rate of the Universe (the Hubble constant), making the estimate nearly an order of magnitude too large, and the implied age for the Universe too small.
Way 2013 notes, “Table 1 lists all of the main distance estimates to spiral nebulae (known to this author) from the late 1800s until 1930 when standard candles began to be found in spiral nebulae [galaxies].” (image credit: Way 2013/arXiv).Hubble’s accreditation as the discoverer of the expanding Universe (the Hubble constant) has generated considerable discussion, which is ultimately tied to the discovery of a relationship between a galaxy’s velocity and its distance. An accusation even surfaced that Hubble may have censored the publication of another scientist to retain his pre-eminence. That accusation has since been refuted, but provides the reader an indication of the tone of the debate (see Livio 2012 (Nature), and references therein).
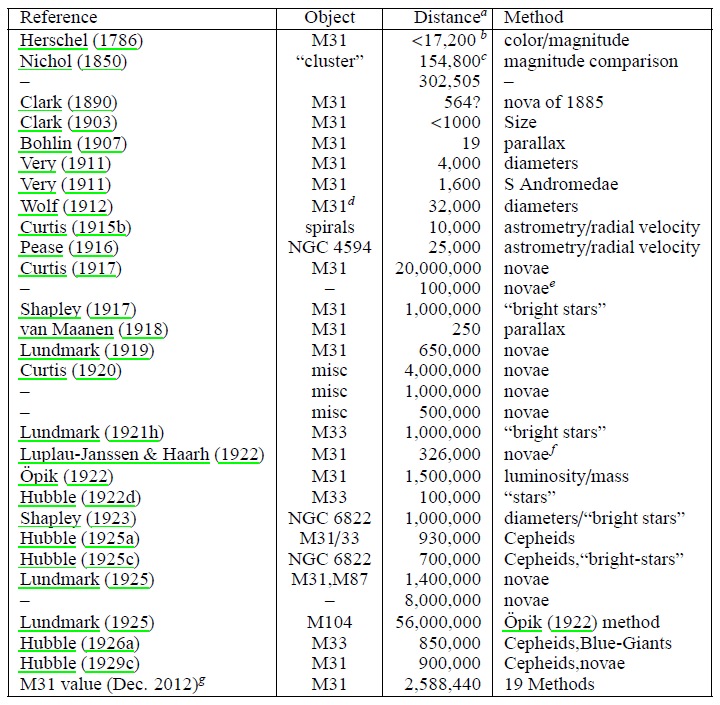
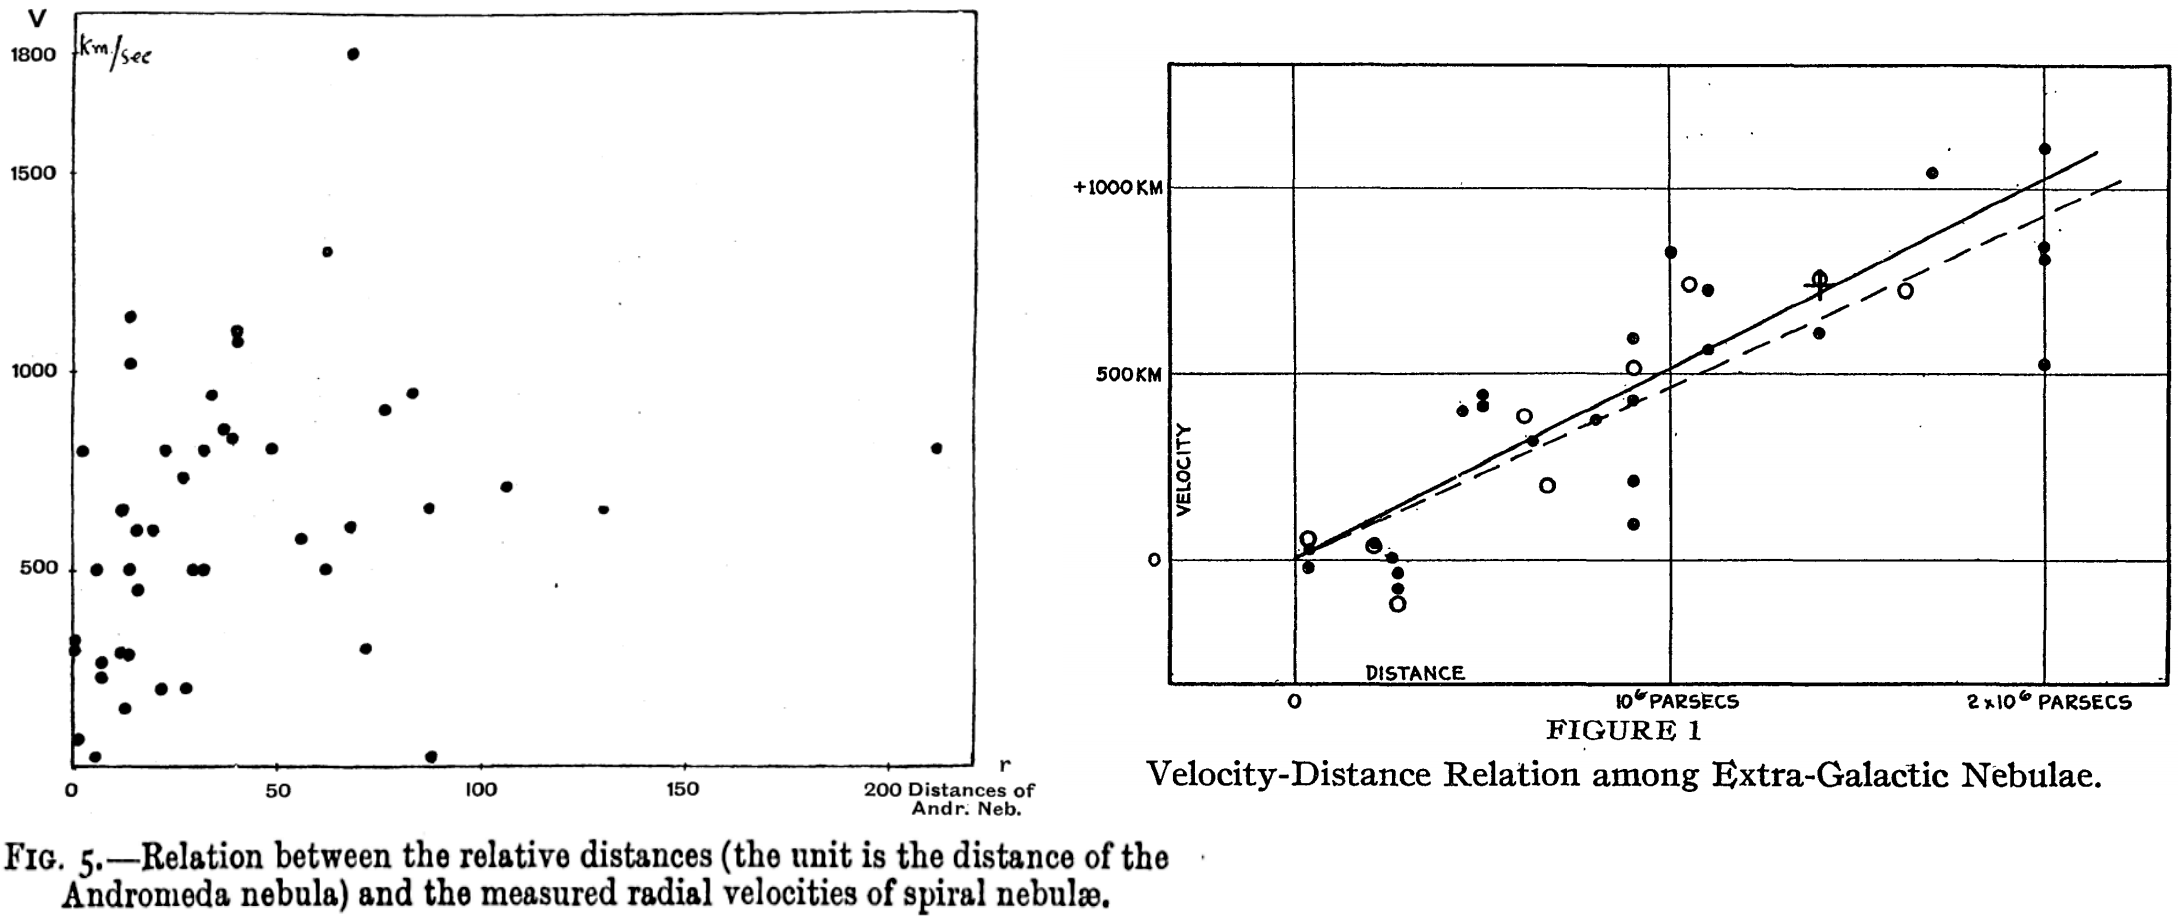
Hubble published his findings on the velocity-distance relation in 1929, under the unambiguous title, “A Relation Between Distance and Radial Velocity Among Extra-Galactic Nebulae”. Hubble 1929 states at the outset that other investigations have sought, “a correlation between apparent radial velocities and distances, but so far the results have not been convincing.” The key word being convincing, clearly a subjective term, but which Hubble believes is the principal impetus behind his new effort. In Lundmark 1924, where a velocity versus distance diagram is plotted for galaxies (see below), that author remarks that, “Plotting the radial velocities against these relative distances, we find that there may be a relation between the two quantities, although not a very definite one.” However, Hubble 1929 also makes reference to a study by Lundmark 1925, where Lundmark underscores that, “A rather definite correlation is shown between apparent dimensions and radial velocity, in the sense that the smaller and presumably more distant spirals have the higher space velocity.”
Hubble 1929 provides a velocity-distance diagram (featured below) and also notes that, “the data indicate a linear correlation between distances and velocities”. However, Hubble 1929 explicitly cautioned that, “New data to be expected in the near future may modify the significance of the present investigation, or, if confirmatory, will lead to a solution having many times the weight. For this reason it is thought premature to discuss in detail the obvious consequences of the present results … the linear relation found in the present discussion is a first approximation representing a restricted range in distance.” Hubble implied that additional effort was required to acquire observational data and place the relation on firm (convincing) footing, which would appear in Hubble and Humason 1931. Perhaps that may partly explain, in concert with the natural tendency of most humans to desire recognition and fame, why Hubble subsequently tried to retain credit for the establishment of the velocity-distance relation.
Hubble 1929 conveyed that he was aware of prior (but unconvincing to him) investigations on the topic of the velocity-distance relation. That is further confirmed by van den Bergh 2011, who cites the following pertinent quote recounted by Hubble’s assistant (Humason) for an oral history project, “The velocity-distance relationship started after one of the IAU meetings, I think it was in Holland [1928]. And Dr. Hubble came home rather excited about the fact that two or three scientists over there, astronomers, had suggested that the fainter the nebulae were, the more distant they were and the larger the red shifts would be. And he talked to me and asked if I would try and check that out.”
The velocities of galaxies plotted as a function of their distance, from Lundmark 1924 (left) and Hubble 1929 (right). Note the separate scales on the x-axis. Peacock 2013 demonstrates that distances cited by both authors were ultimately flawed, and problems (albeit less acute) likewise exist with modern distances (image credit: Lundmark/MNRAS/Hubble/PNAS, assembled by D. Majaess).
Hubble 1929 elaborated that, “The outstanding feature, however, is the possibility that the velocity-distance relation may represent the de Sitter effect, and hence that numerical data may be introduced into discussions of the general curvature of space.” de Sitter had proposed a model for the Universe whereby light is redshifted as it travels further from the emitting source. Hubble suspected that perhaps his findings may represent the de Sitter effect, however, Way 2013 notes that, “Thus far historians have unearthed no evidence that Hubble was searching for the clues to an expanding universe when he published his 1929 paper (Hubble 1929b).” Indeed, nearly two decades after the 1929 publication, Hubble 1947 remarks that better data may indicate that, “redshifts may not be due to an expanding universe, and much of the current speculation on the structure of the universe may require re-examination.” It is thus somewhat of a paradox that, in tandem with the other reasons outlined, Hubble is credited with discovering that the Universe is expanding.
The term redshift stems from the fact that when astronomers (e.g., V. Slipher) examined the spectra of certain galaxies, they noticed that although a particular spectral line should have appeared in the blue region of the spectrum (as measured in a laboratory): the line was actually shifted redward. Hubble 1947 explained that, “light-waves from distant nebulae [galaxies] seem to grow longer in proportion to the distance they have travelled It is as though the stations on your radio dial were all shifted toward the longer wavelengths in proportion to the distances of the stations. In the nebular [galaxy] spectra the stations (or lines) are shifted toward the red, and these redshifts vary directly with distance–an approximately linear relation. This interpretation lends itself directly to theories of an expanding universe. The interpretation is not universally accepted, but even the most cautious of us admit that redshifts are evidence either of an expanding universe or of some hitherto unknown principle of nature.”
Top, spectra for galaxies that are redshifted (image credit: JPL/Caltech/Planck).
As noted above, Hubble was not the first to deduce a velocity-distance relation for galaxies, and Way 2013 notes that, “Lundmark (1924b): first distance vs. velocity plot for spiral nebulae [galaxies] …Georges Lemaitre (1927): derived a non–static solution to Einstein’s equations and coupled it to observations to reveal a linear distance vs. redshift relation with a slope of 670 or 575 km/s/Mpc (depending on how the data is grouped) …” Although Hubble was aware of Lundmark’s research, he and numerous other astronomers were likely unaware of the now famous 1927 Lemaitre study, which was published in an obscure journal (see Livio 2012 (Nature), and discussion therein). Steer 2013 notes that, “Lundmark’s [1924] distance estimates were consistent with a Hubble constant of 75 km/s/Mpc [which is close to recent estimates].” (see also the interpretation of Peacock 2013). Certain distances established by Lundmark appear close to present determinations (e.g., M31, see the table above).
So why was Hubble credited with discovering the expanding Universe? Way 2013 suggests that, “Hubble’s success in gaining credit for his … linear distance-velocity relation may be related to his verification of the Island Universe hypothesis –after the latter, his prominence as a major player in astronomy was affirmed. As pointed out by Merton (1968) credit for simultaneous (or nearly so) discoveries is usually given to eminent scientists over lesser-known ones.” Steer told Universe Today that, “Lundmark in his own words did not find a definite relation between redshift and distance, and there is no linear relation overplotted in his redshift-distance graph. Where Lundmark used a single unproven distance indicator (galaxy diameters), cross-checked by a single unproven distance to the Andromeda galaxy, Hubble used multiple indicators including one still in use (brightest stars), cross-checked with distances to multiple galaxies based on Cepheids variables stars.”
Concerning assigning credit for the discovery of the expansion of the Universe, Way 2013 concludes that, “Overall we find that Lemaitre was the first to seek and find a linear relation between distance and velocity in the context of an expanding universe, but that a number of other actors (e.g. Carl Wirtz, Ludwik Silberstein, Knut Lundmark, Edwin Hubble, Willem de Sitter) were looking for a relation that fit into the context of de Sitter’s [Universe] Model B world with its spurious radial velocities [the redshift].” A partial list of the various contributors highlighted by van den Bergh 2011 is provided below.
“The history of the discovery of the expansion of the Universe may be summarized [above],” van den Bergh 2011 (image credit: van den Bergh/JRASC/arXiv).Way and Nussbaumer 2011 assert that, “It is still widely held that in 1929 Edwin Hubble discovered the expanding Universe … that is incorrect. There is little excuse for this, since there exists sufficient well-supported evidence about the circumstances of the discovery.”
In sum, the author’s personal opinion is that Hubble’s contributions to astronomy were seminal. Hubble helped convince astronomers of the extragalactic distance scale and that a relationship existed between the distance to a galaxy and its velocity, thus propelling the field and science forward. His extragalactic distances, albeit flawed, were also used to draw important conclusions (e.g., by Lemaitre 1927). However, it is likewise clear that other individuals are meritorious and deserve significant praise. The contributions of those scientists should be highlighted in parallel to Hubble’s research, and astronomy textbooks should be revised to emphasize those achievements A fuller account should be cited of the admirable achievements made by numerous astronomers working in synergy during the 1920s.
There are a diverse set of opinions on the topics discussed, and the reader should remain skeptical (of the present article and other interpretations), particularly since knowledge of the topic is evolving and more is yet to emerge. Two talks from the “Origins of the Expanding Universe: 1912-1932” conference are posted below (by H. Nussbaumer and M. Way), in addition to a talk by I. Steer from a separate event.
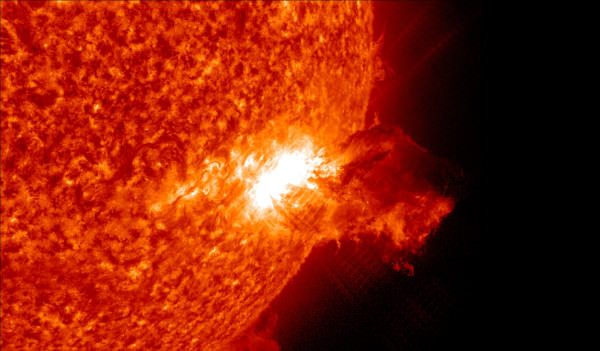
Our own Sun produces flares, but we are protected by our magnetosphere, and by the distance from the Sun to Earth. Credit: NASA/ Solar Dynamics Observatory,
Twice a year, the Solar Dynamics Observatory performs a 360-degree roll about the axis on which it points toward the Sun. This produces some unique views, but the rolls are necessary to help calibrate the instruments, particularly the Helioseismic and Magnetic Imager (HMI) instrument, which is making precise measurements of the solar limb to study the shape of the Sun. The rolls also help the science teams to know how accurately the images are aligned with solar north.
But take this rolling imagery, add some goofy music and hopefully it adds a smile to your day!
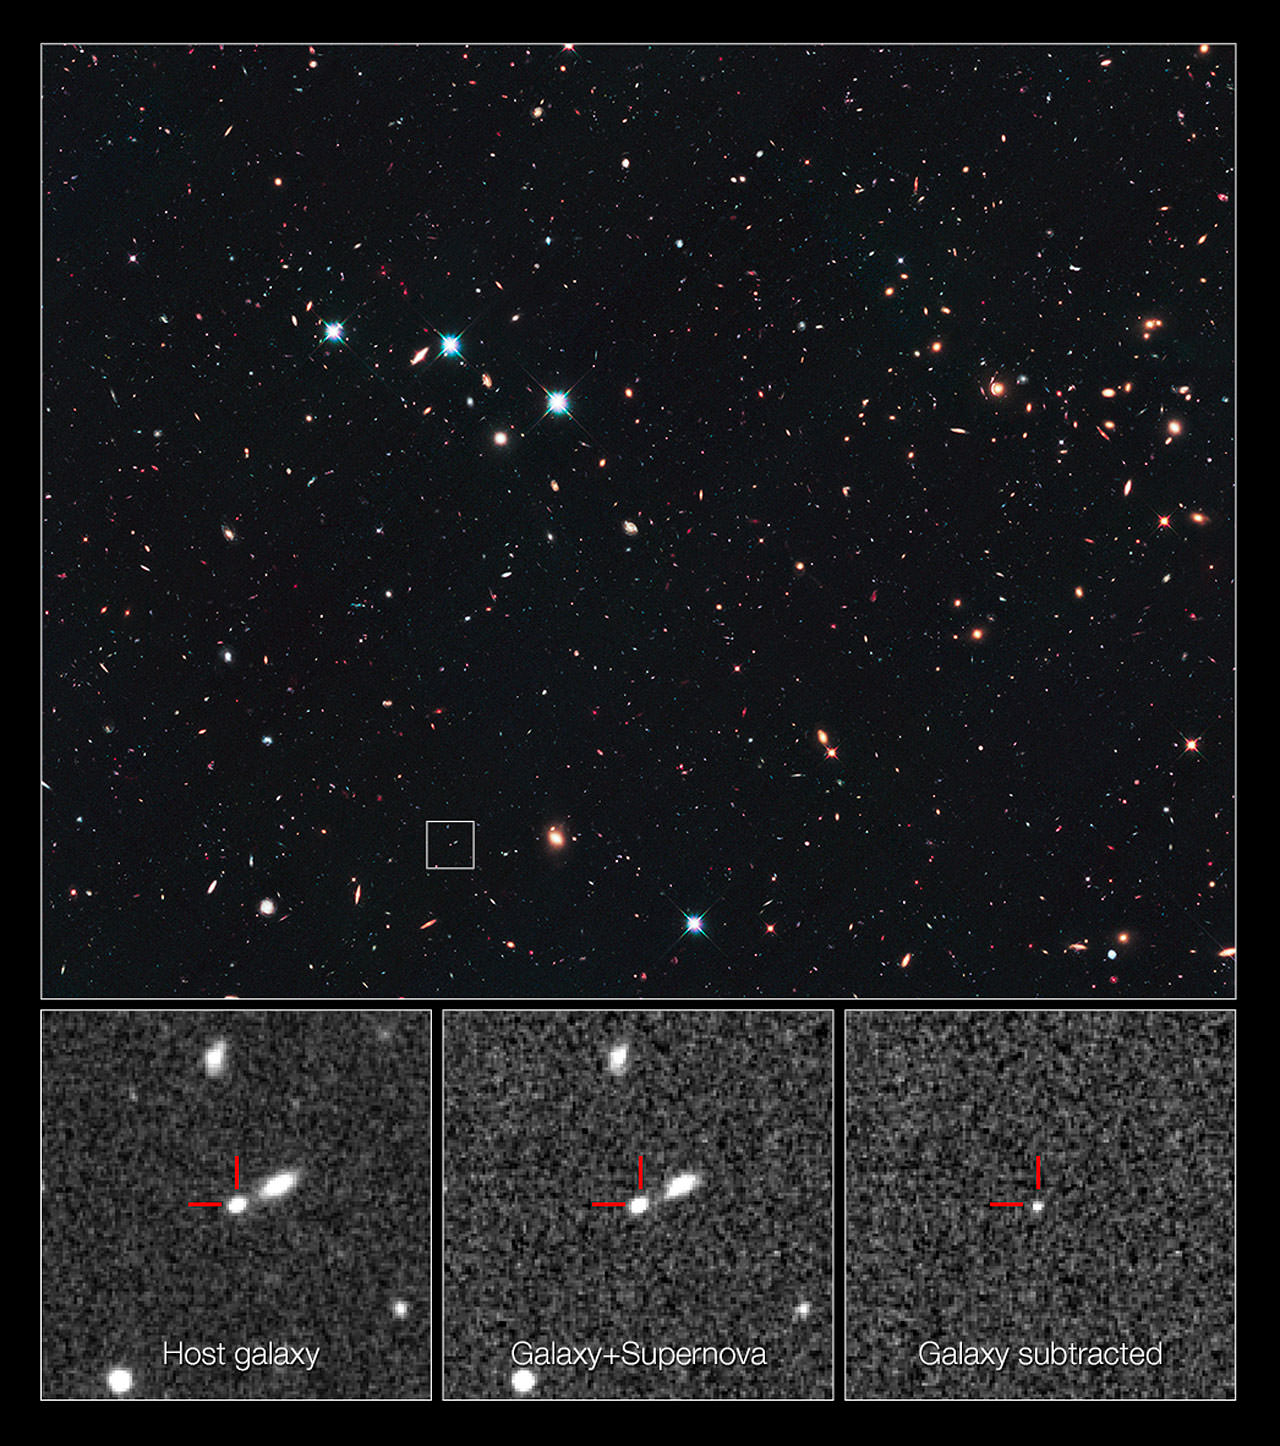
This is a NASA/ESA Hubble Space Telescope view looking long ago and far away at a supernova that exploded over 10 billion years ago — the most distant Type Ia supernova ever detected. The supernova’s light is just arriving at Earth, having travelled more than 10 billion light-years (redshift 1.914) across space. Credit: NASA, ESA, A. Riess (STScI and JHU), and D. Jones and S. Rodney (JHU).
Astronomers just keep honing their skills and refining their techniques to get the most out of their telescopes. Scientists using the Hubble Space Telescope have now broken the record for the most distant Type Ia supernova ever imaged. This supernova is over 10 billion light-years away, with a redshift of 1.914. When this star exploded 10 billion years ago, the Universe was in its early formative years and stars were being born at a rapid rate.
“This new distance record holder opens a window into the early Universe, offering important new insights into how these supernovae form,” said astronomer David O. Jones of The Johns Hopkins University in Baltimore, Md., lead author on the science paper detailing the discovery. “At that epoch, we can test theories about how reliable these detonations are for understanding the evolution of the Universe and its expansion.”
These three frames show the supernova dubbed SN UDS10Wil, or SN Wilson, the most distant Type Ia supernova ever detected. The leftmost frame in this image shows just the supernova’s host galaxy, before the violent explosion. The middle frame shows the galaxy after the supernova had gone off, and the third frame indicates the brightness of the supernova alone. Credit: NASA, ESA, A. Riess (STScI and JHU), and D. Jones and S. Rodney (JHU)
Designated as SN UDS10Wil (and nicknamed SN Wilson after American President Woodrow Wilson (president from 1913-1921), the distant supernova was part of a three-year Hubble program to survey faraway Type Ia supernovae and determine whether they have changed during the 13.8 billion years since the explosive birth of the universe. Since 2010, the CANDELS+CLASH Supernova Project has uncovered more than 100 supernovae of all types that exploded from 2.4 to over 10 billion years ago.
The previous record holder for Type Ia was announced earlier this year, a supernova that exploded around 9 billion years ago and has a redshift of 1.7. Although SN Wilson is only 4 percent more distant than the previous record holder, it pushes roughly 350 million years farther back in time.
The most distant supernovae ever are a pair of super-luminous supernovae, at redshifts of 2.05 and 3.90, announced in November 2012. Read about that discovery here.
Astronomers took advantage of the sharpness and versatility of Hubble’s Wide Field Camera 3 to search for supernovae in near-infrared light and verify their distance with spectroscopy. These bright beacons are prized by astronomers because they can be used as a yardstick for measuring cosmic distances, thereby yielding clues to the nature of dark energy, the mysterious force accelerating the rate of expansion of the Universe.
Additionally, finding remote supernovae provides a powerful method to measure the universe’s accelerating expansion.
“The Type Ia supernovae give us the most precise yardstick ever built, but we’re not quite sure if it always measures exactly a yard,” said team member Steve Rodney of Johns Hopkins University. “The more we understand these supernovae, the more precise our cosmic yardstick will become.”
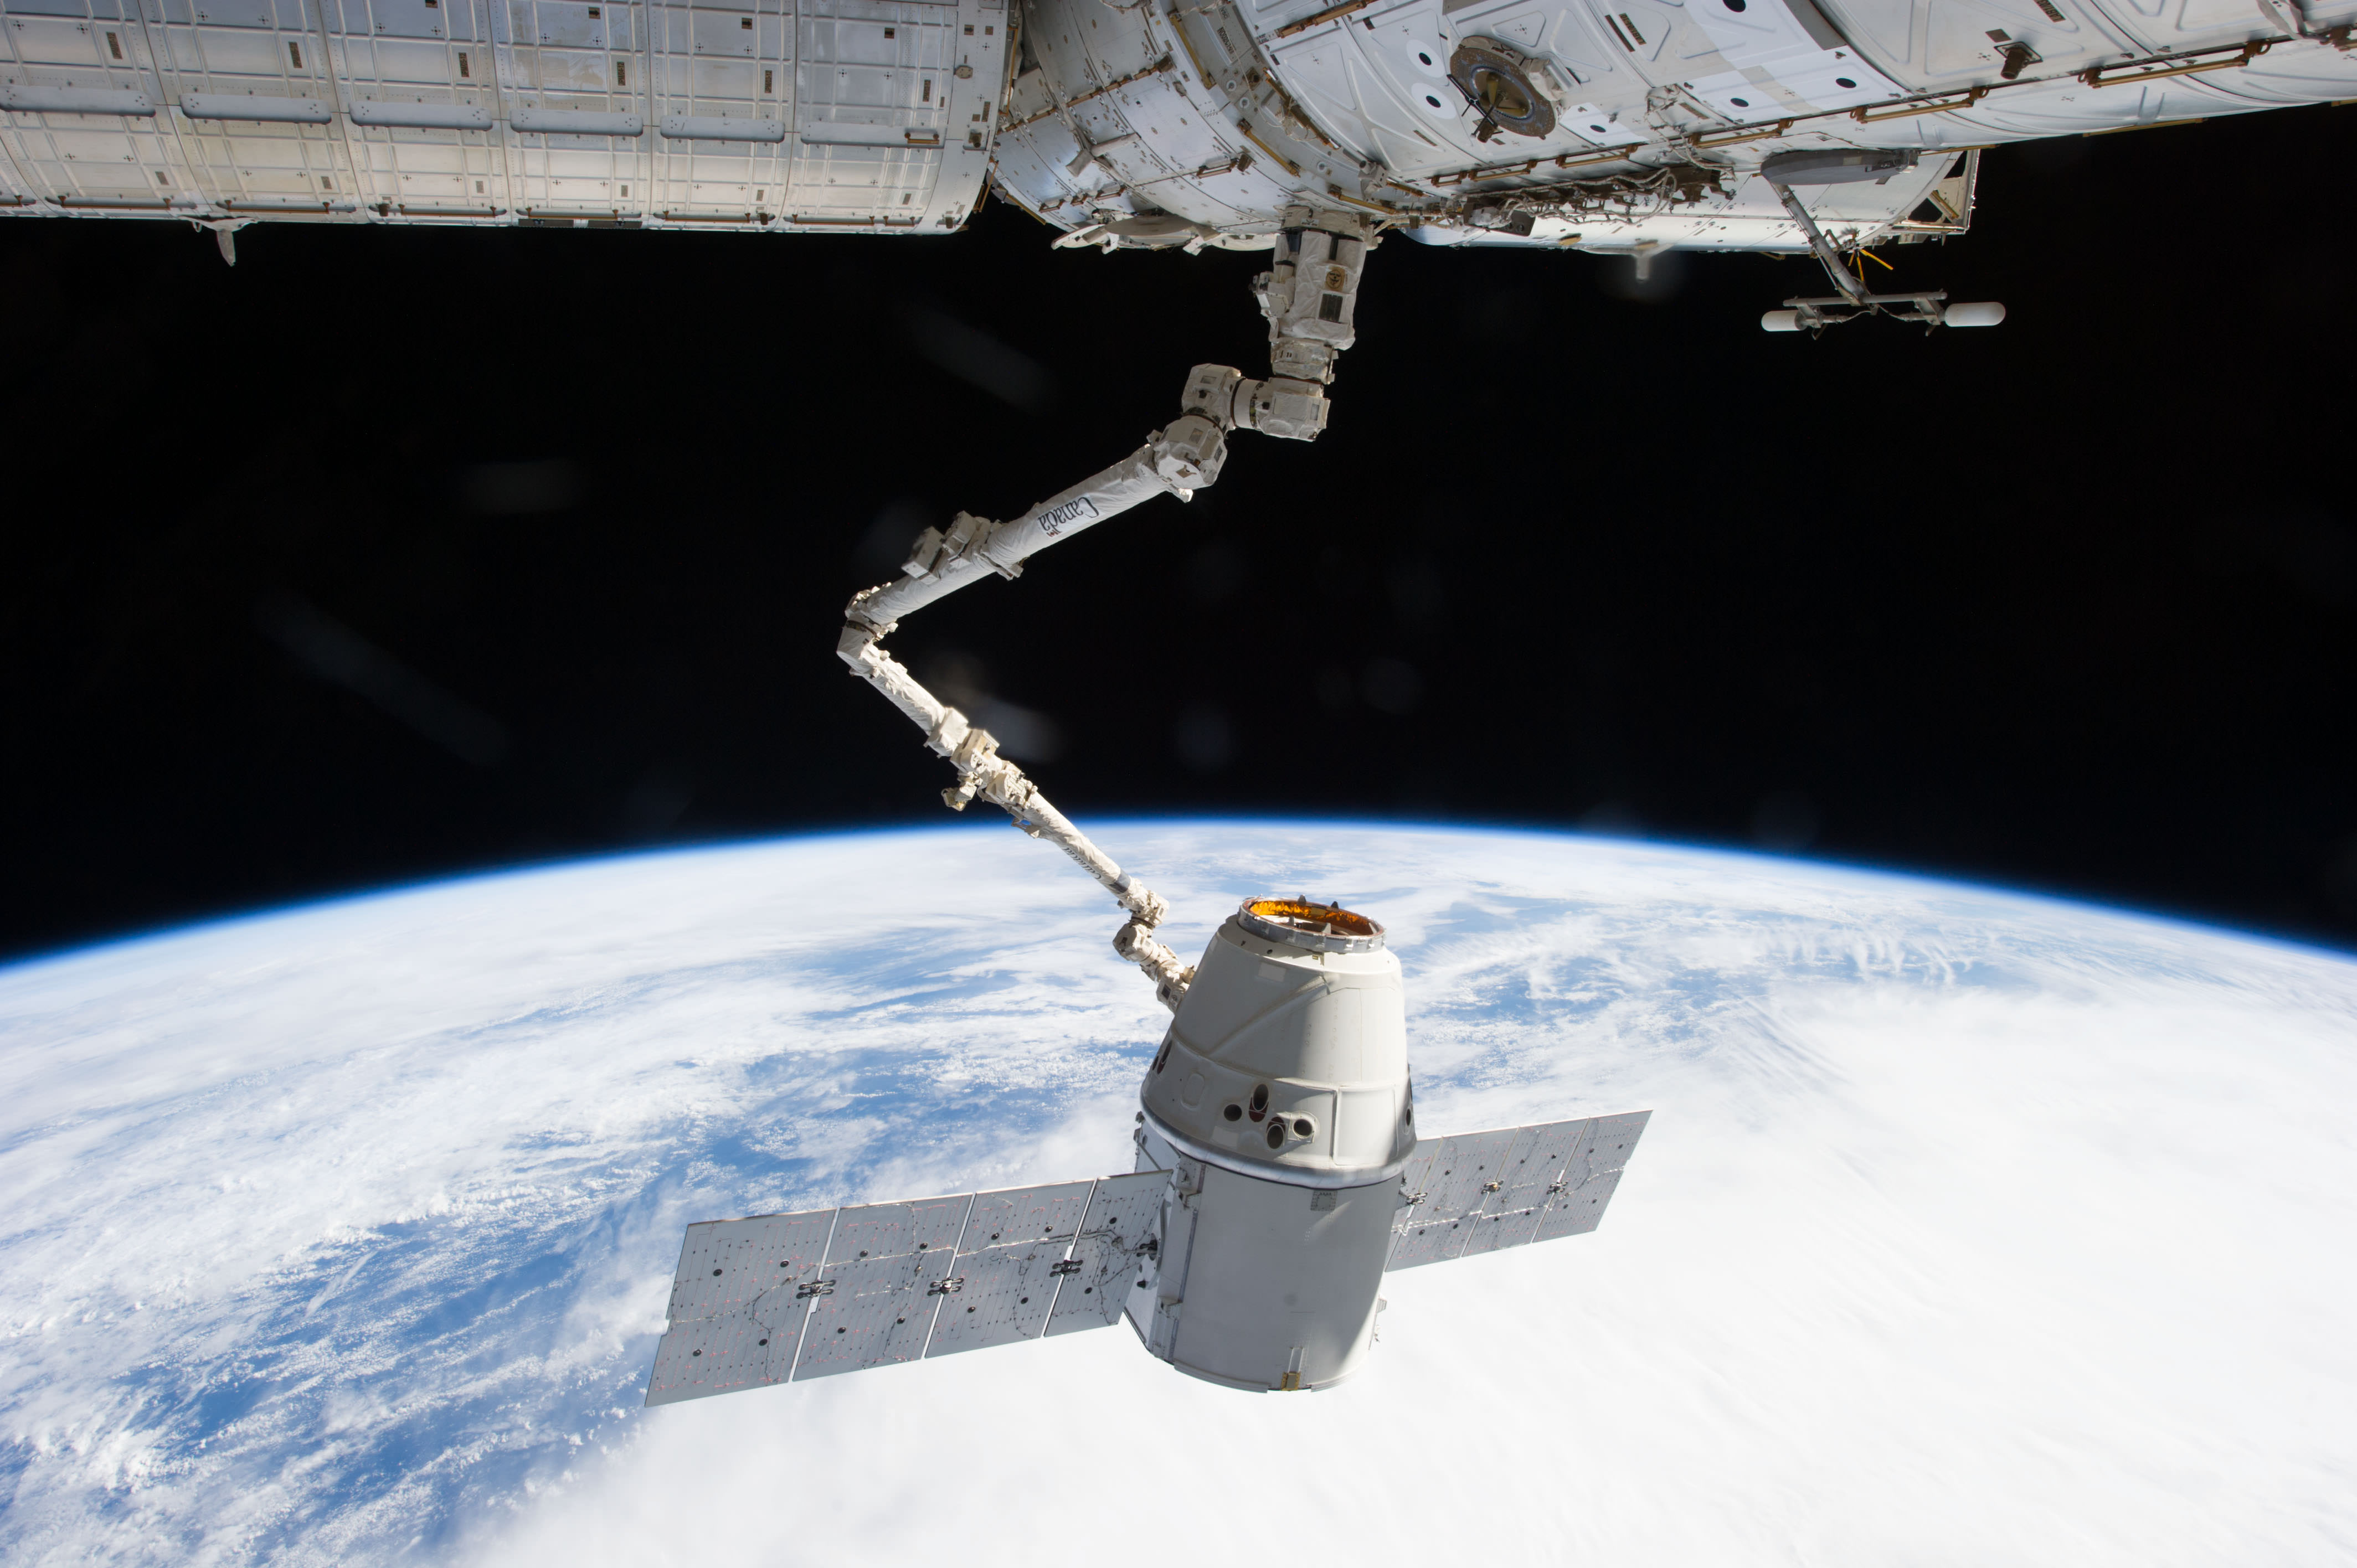
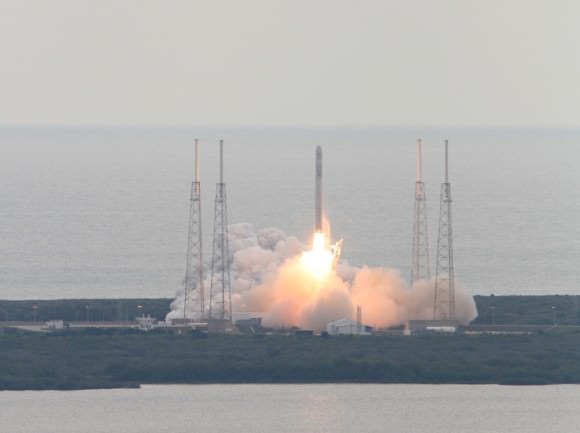
This grappling of the SpaceX Dragon capsule on March 3, 2013 by the space station robotic arm nearly didn’t happen when a thruster failure just minutes after the March 1 liftoff nearly doomed the mission. Credit: NASA
The picture perfect docking of the SpaceX Dragon capsule to the International Space Station (ISS) on March 3 and the triumphant ocean splashdown last week on March 26 nearly weren’t to be – and it all goes back to a microscopic manufacturing mistake in the oxidizer tank check valves that no one noticed long before the vessel ever took flight.
Barely 11 minutes after I witnessed the spectacular March 1 blastoff of the Dragon atop the SpaceX Falcon 9 rocket from Cape Canaveral, Florida, everyone’s glee suddenly turned to disbelief and gloom with the alarming news from SpaceX Mission Control that contact had been lost.
I asked SpaceX CEO and founder Elon Musk to explain what caused the failure and how they saved the drifting, uncontrolled Dragon capsule from doom – just in the nick of time.
Applying the space version of the Heimlich maneuver turned out to be the key. But if you can’t talk to the patient – all is lost.
Right after spacecraft separation in low Earth orbit , a sudden and unexpected failure of the Dragon’s critical thrust pods had prevented three out of four from initializing and firing. The oxidizer pressure was low in three tanks. And the propulsion system is required to orient the craft for two way communication and to propel the Dragon to the orbiting lab complex.
Then, SpaceX engineers and the U.S Air Force sprang into action and staged an amazing turnaround.
“The problem was a very tiny change to the check valves that serve the oxidizer tanks on Dragon.” Musk told Universe Today
“Three of the check valves were actually different from the prior check valves that had flown – in a very tiny way. Because of the tiny change they got stuck.”
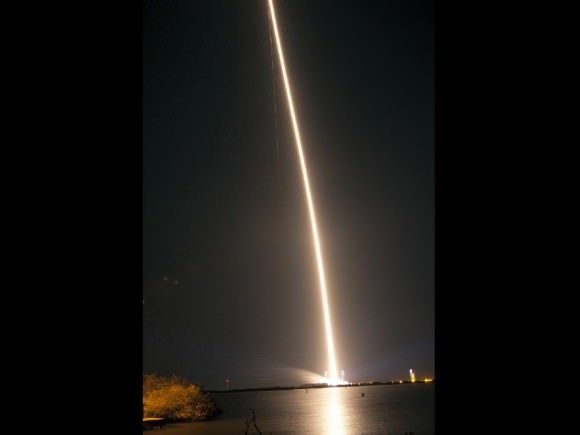
Falcon 9 SpaceX CRS-2 launch on March 1, 2013 to the ISS – shot from the roof of the Vehicle Assembly Building. Credit: Ken Kremer/www.kenkremer.com
SpaceX engineers worked frantically to troubleshoot the thruster issues in an urgent bid to overcome the serious glitch and bring the crucial propulsion systems back on line.
“What we did was we were able to write some new software in real time and upload that to Dragon to build pressure upstream of the check valves and then released that pressure- to give it a kind of a kick,” Musk told me at a NASA media briefing.
“For the spacecraft you could call it kind of a Heimlich maneuver. Basically that got the valves unstuck and then they worked well”
“But we had difficulty communicating with the spacecraft because it was in free drift in orbit.”
“So we worked closely with the Air Force to get higher intensity, more powerful dishes to communicate with the spacecraft and upload the software to do the Heimlich pressure maneuver.”
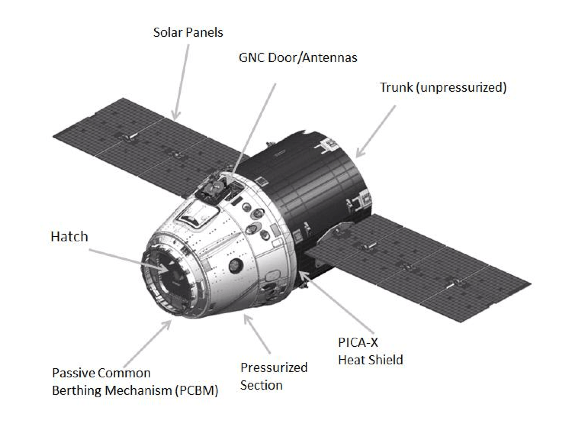
Schematic of SpaceX Dragon. Credit: SpaceX
Just how concerned was Musk?
“Yes, definitely it was a worrying time,” Musk elaborated.
“It was a little frightening,” Musk had said right after the March 1 launch.
Later in the briefing Musk explained that there had been a small design change to the check valves by the supplier.
“The supplier had made mistakes that we didn’t catch,” said Musk. “You would need a magnifying glass to see the difference.”
SpaceX had run the new check valves through a series of low pressurization systems tests and they worked well and didn’t get stuck. But SpaceX had failed to run the functional tests at higher pressures.
“We’ll make sure we don’t repeat that error in the future,” Musk stated.
Musk added that SpaceX will revert to the old check valves and run tests to make sure this failure doesn’t happen again.
SpaceX, along with Orbital Sciences Corp, are both partnered with NASA’s Commercial Resupply Services program to replace the cargo up mass capability the US lost following the retirement of NASA’s space shuttle orbiters in 2011.
Orbital’s Antares rocket could blast off on its first test mission as early as April 17.
Of course the Dragon CRS-2 flight isn’t the first inflight space emergency, and surely won’t be the last either.
So, for some additional perspective on the history of reacting to unexpected emergencies in space on both human spaceflight and robotic science probes, Universe Today contacted noted space historian Roger Launius, of the Smithsonian National Air & Space Museum (NASM).
Roger provided these insights to Universe Today editor Nancy Atkinson – included here:
“There are many instances in the history of spaceflight in which the mission had difficulties that were overcome and it proved successful,” said Launius.
“Let’s start with Hubble Space Telescope which had a spherical aberration on its mirror and the first reports in 1990 were that it would be a total loss, but the engineers found workarounds that allowed it to be successful even before the December 1993 servicing mission by a shuttle crew that really turned it into a superb scientific instrument.”
“Then what about Galileo, the Jupiter probe, which had a problem with its high gain antenna. It never did fully deploy but the engineers found ways to overcome that problem with the communication system and the spacecraft turned into a stunning success.”
“If you want to feature human spaceflight let’s start with the 1999 shuttle flight with Eileen Collins as commander that had a shutdown of the SSMEs prematurely and it failed to reach its optimum orbit. It still completed virtually all of the mission requirements.”
“That says nothing about Apollo 13,… I could go on and on. In virtually every mission there has been something potentially damaging to the mission that has happened. Mostly the folks working the mission have planned for contingencies and implement them and the public rarely hears about it as it looks from the outside like a flawless operation.”
“Bottom line, the recovery of the Dragon capsule was not all that amazing. It was engineers in the space business doing what they do best,” said Launius.
Learn more about SpaceX, Antares, Curiosity and NASA missions at Ken’s upcoming lecture presentations:
April 20/21 : “Curiosity and the Search for Life on Mars – (in 3-D)”. Plus Orion, SpaceX, Antares, the Space Shuttle and more! NEAF Astronomy Forum, Suffern, NY
April 28: “Curiosity and the Search for Life on Mars – (in 3-D)”. Plus the Space Shuttle, SpaceX, Antares, Orion and more. Washington Crossing State Park, Titusville, NJ, 130 PM
SpaceX Falcon 9 rocket and Dragon capsule poised to blast off from Cape Canaveral Air Force Station, Florida on a commercial resupply mission to the ISS. Credit: Ken Kremer/www.kenkremer.com
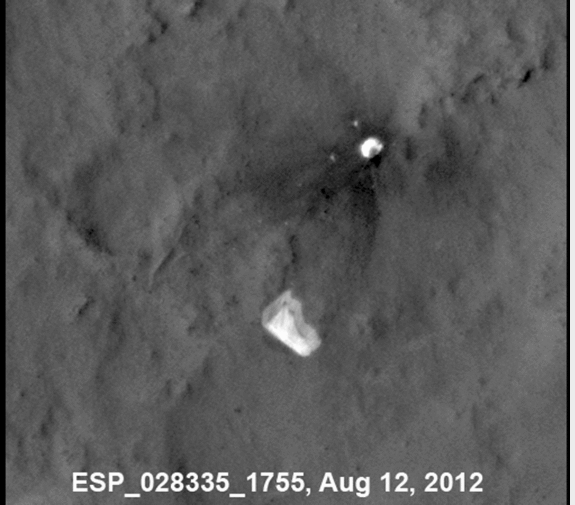
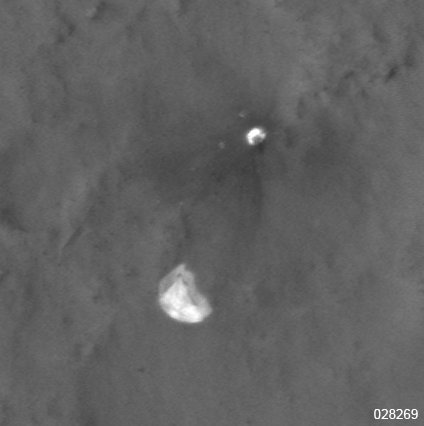
This sequence of seven images from the High Resolution Imaging Science Experiment (HiRISE) camera on NASA's Mars Reconnaissance Orbiter shows wind-caused changes in the parachute of NASA's Mars Science Laboratory spacecraft as the chute lay on the Martian ground during months after its use in safe landing of the Curiosity rover. Image credit: NASA/JPL-Caltech/Univ. of Arizona.
How cool is this? An animation of seven images from the HiRISE camera on the Mars Reconnaissance Orbiter show a “flapping” of the parachute that allowed the Curiosity rover to descend safely through Mars atmosphere images. The chute, imaged as it lay on the ground following the rover’s safe landing, was blown about by the Martian breeze! The images were acquired by HiRISE between August 12, 2012 and January 13, 2013. The different images show distinct changes in the parachute, which is attached to the backshell that encompassed the rover during launch, flight and descent.
The HiRISE team explains the animation:
In the first four images there are only subtle changes, perhaps explained by differences in viewing and illumination geometry.
Sometime between September 8, 2012 and November 30, 2012, there was a major change in which the parachute extension to the southeast (lower right) was moved inward, so the parachute covers a smaller area. In the same time interval some of the dark ejecta around the backshell brightened, perhaps from deposition of airborne dust.
Another change happened between December 16, 2012 and January 13, 2013, when the parachute shifted a bit to the southeast. This type of motion may kick off dust and keep parachutes on the surface bright, to help explain why the parachute from Viking 1 (landed in 1976) remains detectable.
The Mars Science Laboratory’s parachute flaps in the wind on Mars. Images by the HiRISE camera on the Mars Reconnaissance Orbiter, animation by Doug Ellison.
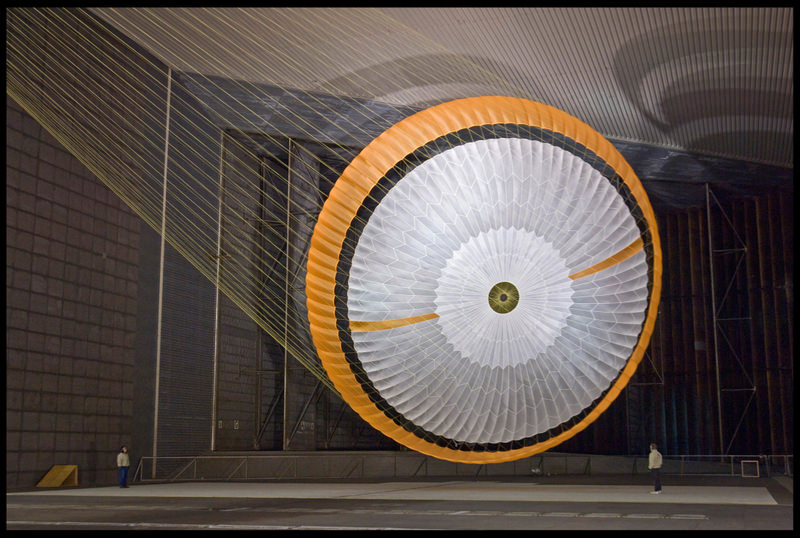
And here’s a look at how big the chute really is (note the people for scale):
MSL parachutte tested in a wind tunnel. Credit: JPL.
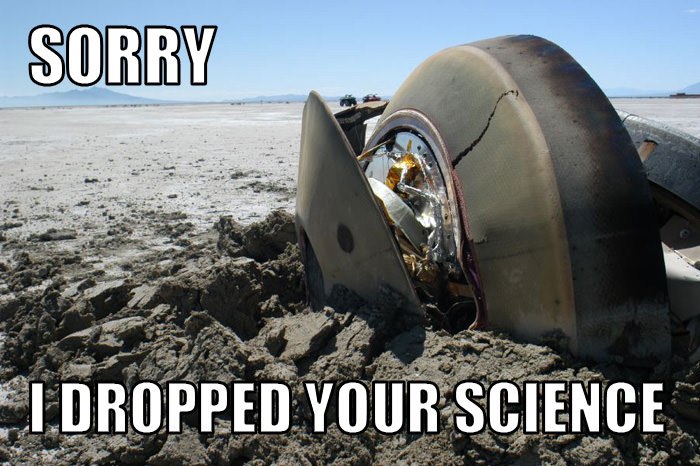
@doug_ellison's contribution to the new 'Robot Shaming' Tumblr site.
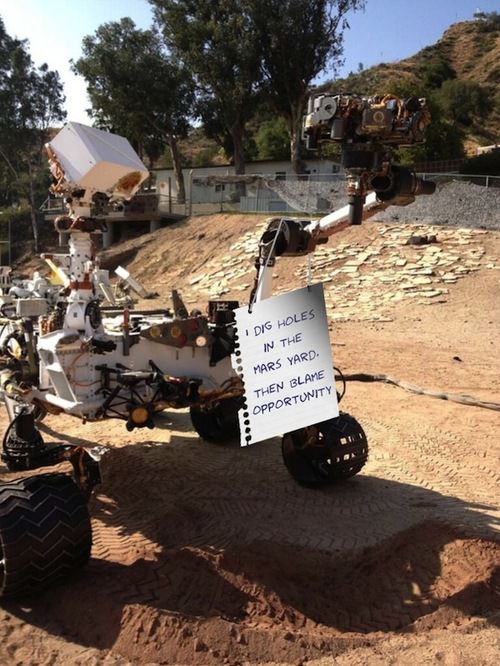
Oh, those space robots. They don’t always do what we want them to do, but we love them anyway. If you need a fun diversion in your day, a new Tumblr site has arisen to call out the robots who have made mistakes. Called “Shaming Robots” it started innocently with an image posted of the engineering model of the Curiosity rover blaming the engineering Opportunity rover for messing up JPL’s Mars Yard. There’s now pages of shamed robots (both space and Earth-based). Submit your own if you have a robot you’d like to shame. You can also follow the fun discussion on Twitter at the hashtag #robotshaming.
Astronomer Alex Parker stared the ‘Robot Shaming’ meme with this image of the engineering model of Curiosity at JPL.


!["The history of the discovery of the expansion of the Universe may be summarized [above]", S. van den Bergh 2011. Image credit: S. van den Bergh/JRASC/arXiv.](https://www.universetoday.com/wp-content/uploads/2013/04/history.jpg)