An Awesome Annular Eclipse! Images and Videos from Earth and Space

@Beyond_Beneath Geoff Sims Plutonic Gold Mine, Australia

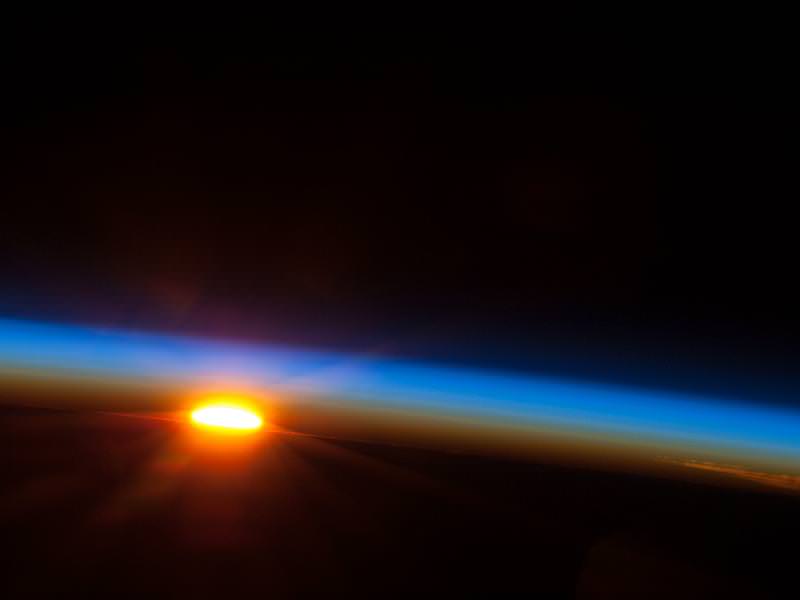
A spectacular annular eclipse of the Sun was witnessed across Australia and the southern Pacific region early today. Morning dawned mostly clear across the Australian continent, and those who journeyed out to meet the antumbra of the Moon as the Sun rose across the Great Sandy Desert and the Cape York Peninsula were not disappointed. The rest of us watched worldwide on as Slooh and a scattering of other ad-hoc broadcasts delivered the celestial event to us via the web.

This was a challenging one. Although partial phases of the eclipse was visible across the entirety of Australia, Hawaii, and as far north as the Philippines and as far south as New Zealand, the track of annularity passed over some very remote locales. Stable Internet connections were scarce, and many photos and videos are still trickling in as die-hard eclipse chasers return “from the Bush.”

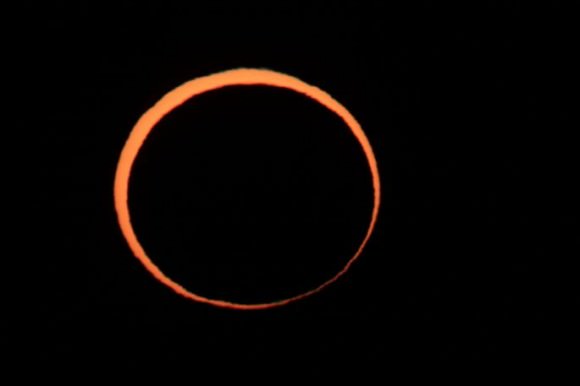
One lucky witness to the eclipse was Druce Horton (Xylopia on flickr) who caught the eclipse from Kuranda, Australia just north of Cairns. “It was completely clouded over here in Kuranda and I didn’t even bother going to a place where I could get a clear view.” Druce told Universe Today. “I then noticed the sky lightening a little and I rushed out with the camera and desperately tried to set an appropriate exposure and frame it while avoiding getting an eyeful of sunlight and/or a tree branch in the way.”

As seen by Druce Horton near Kurunda, Australia.
A rising crescent eclipse as seen by Druce Horton near Kurunda, Australia. (Credit and Copyright: Druce Horton. Used with Permission).

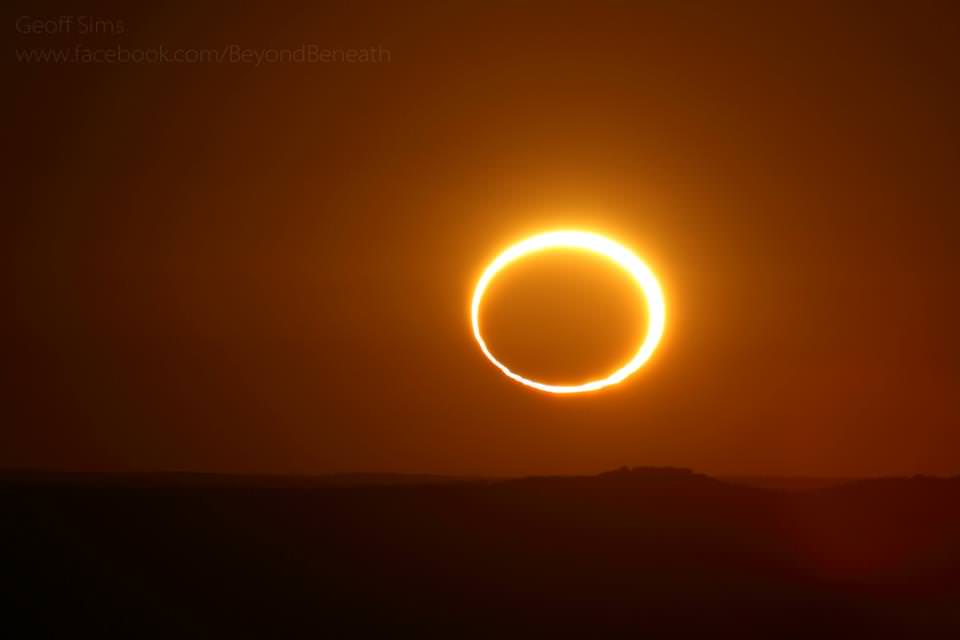
As pointed out the us by Michael Zeiler (@EclipseMaps) earlier this week, the town of Newman and surrounding regions in Western Australia were a great place to witness the rising annular eclipse. Geoffrey Sims ventured out and did just that:

eclipse...
The rising annular eclipse. (Credit: Geoff Sims).

Note how the atmospheric haze is distorting the solar annulus into a flattened ring… pure magic! Mr. Sims got some truly stunning pictures of the eclipse, and was one of the first to manage to get them out onto the Internet, though he stated on Twitter that it “will likely take weeks to sort through the images!”

All get reasons to keep a close eye on Mr. Sims’ Facebook page

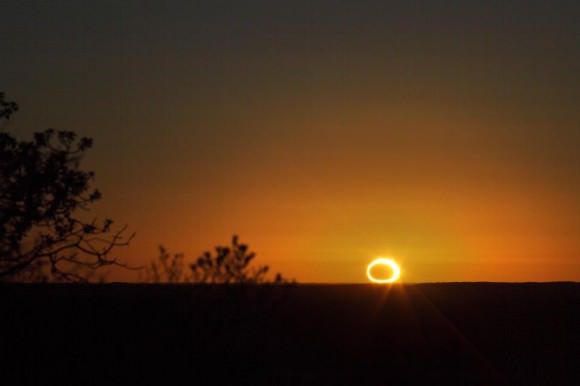
Mr. Joerg Schoppmeyer also ventured about 70 kilometres south of Newman to catch the rising “Ring of Fire”:

Annularity just moments after internal contact of the antumbra. Credit:
Annularity just moments after internal contact of the antumbra. Credit: Joerg Schoppmeyer).

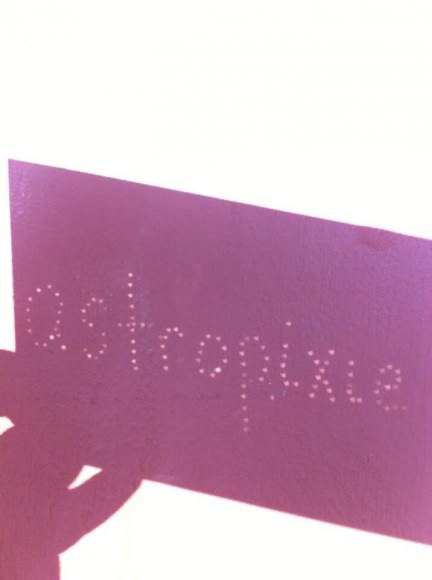
We also mentioned earlier this week how you can use the “strainer effect” to create a flock of crescent Suns during a partial solar eclipse.

Amanda Bauer (@astropixie) of Sydney, Australia did just this to create her name in “eclipse pacmans”:

eclipse
An Astropixie Eclipse… (Credit: Amanda Bauer).

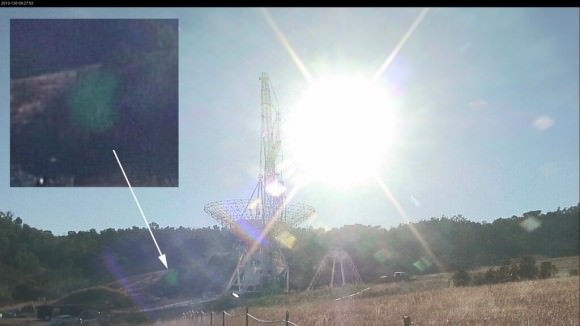
And speaking of which, eclipse crescents can turn up in the most bizarre of places, such as a lens flare caught by a webcam based at the Canberra Deep Space Network:

Credit: NASA
A lens flare eclipse. (Credit: CDSCC/NASA).

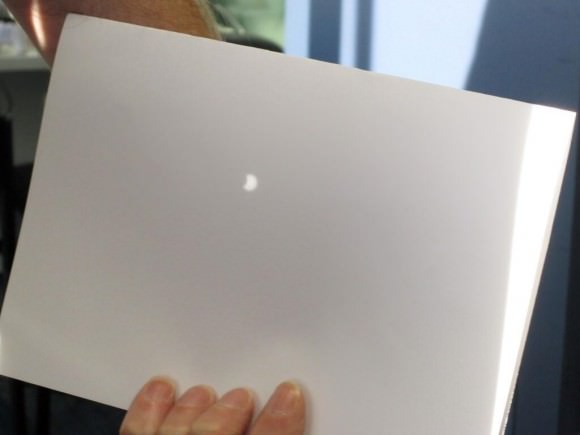
Trevor Sellman (@tsellman) based in northern Melbourne preferred to catch sight of the partial phase of the eclipse “the old fashioned way,” via a simple pinhole projection onto a white sheet of paper:

Pinhole
A pinhole eclipse. (Credit: Trevor Sellman).

In addition to Slooh, the Mead West Vaco Observatory in conjunction with the Columbus State University’s Coca-Cola Space Science Center provided an excellent webcast of the full phases of the eclipse, and in multiple wavelengths to boot:

CCSS
The solar annulus as seen near mid-eclipse in hydrogen alpha. (Credit: the CCSSC).

And they also provided a view in Calcium-K:

Screen cap in Cal-K
A screen capture of the final stage of the eclipse as seen in Cal-K. (Credit: the CCSSC).

But Earth bound-observers weren’t the only ones on hand to witness this eclipse. Roskosmos also released a video animation of the antumba of the Moon crossing the Earth as seen from the Elektro-L satellite:

“These images interest Russian space enthusiasts because we asked  Roskosmos to optimize (the) work of satellite for best pictures of eclipse,” Vitaliy Egorov told Universe Today.

There’s no word as of yet if the NASA/JAXA spacecraft Hinode or if ESA’s Proba-2 caught the eclipse, although they were positioned to take advantage of the opportunity.

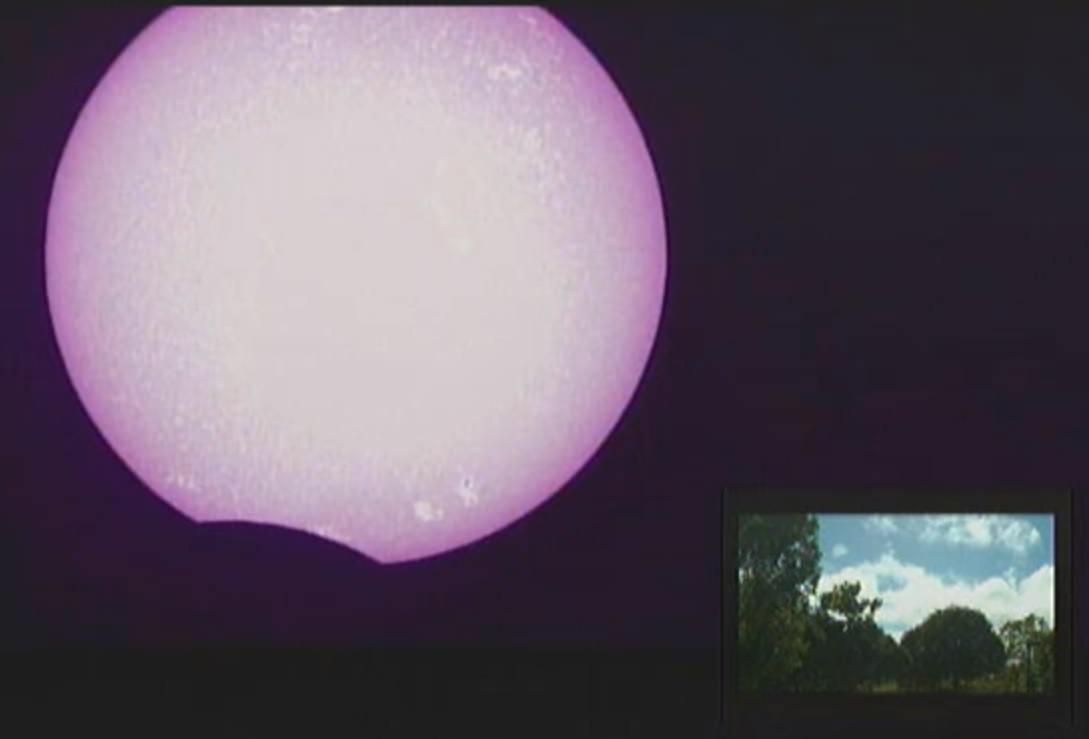
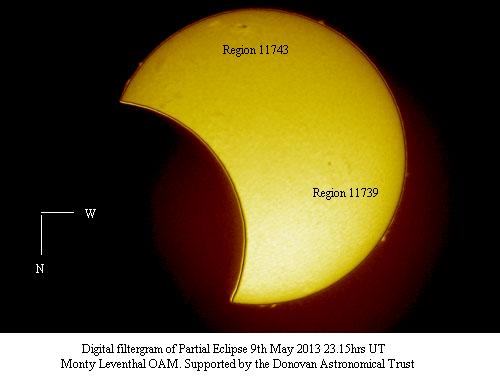
There were also some active sunspot regions on the Earthward face of the Sun, as captured by Monty Leventhal in this outstanding white-light filtered image:

Eclipse

Another fine video animation of the eclipse turned up courtesy of Steve Swayne of Maleny in Queensland, Australia;

And finally, Vanessa Hill caught the partial stage of the eclipse while observing from the CSIRO Astrophysics & Space Sciences viewing event:

eclipse
A partially eclipsed Sun. (Credit: @nessyhill).

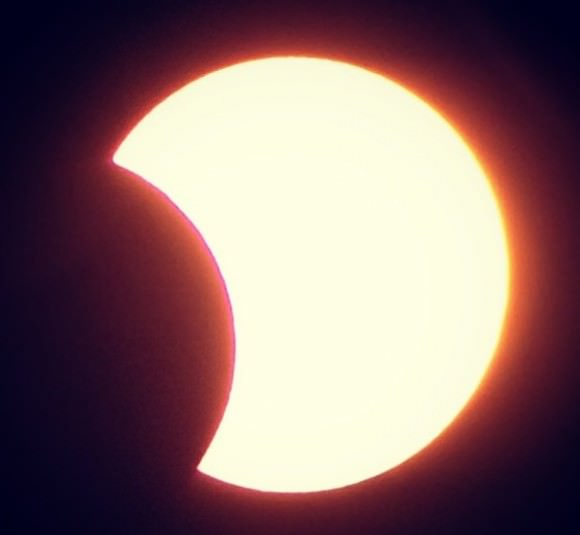
Partial stages of the eclipse were also captured by Carey Johnson (@TheTelescopeGuy) from Hawaii and can be viewed on his flickr page.

If this eclipse left you jonesin’ for more, there’s a hybrid solar eclipse across the Atlantic and central Africa on November 3rd 2013. Maximum totality for this eclipse is 1 minute and 40 seconds. Unfortunately, after two solar eclipses in 6 months, another total solar eclipse doesn’t grace the Australian continent until July 22nd, 2028!

But such are the ways of the cosmos and celestial mechanics… hey, be glad we occupy a position in space and time where solar eclipses can occur.

Thanks to all who sent in photos… if you’ve got a picture of today’s eclipse, an anecdote, or just a tale of triumph and/or eclipse chasing tribulations drop us a line & share those pics up to the Universe Today flickr group. See you next syzygy, and may all your eclipse paths be clear!


Hang On! Trailer for “Gravity” Previews Spacewalk Disaster Film

'Gravity' teaser poster. Via Warner Brothers.

Yikes! The trailer for an upcoming film “Gravity” is absolutely terrifying. This movie won’t hit theaters until October 4, 2013, so we can expect to see more trailers after this first ‘teaser.” We do know it is directed by Alfonso Cuarón and stars Sandra Bullock and George Clooney. But with an emergency spacewalk likely taking place tomorrow at the International Space Station, the timing of the release of this trailer is just a bit eerie.

Bullock plays a medical engineer on her first shuttle mission, with veteran astronaut Matt Kowalsky (Clooney) in command of his last flight before retiring. But on a seemingly routine spacewalk, disaster strikes. The shuttle is destroyed, the space station is damaged, leaving the two astronauts completely alone and tethered to nothing but each other and spiraling out into the blackness.

Watch the teaser below:

The word on the street is that NASA was not consulted at all for this film, so we can only hope for a hint of reality (i.e., let hope it’s not another “Armageddon.”) But from the trailer, it seems to follow the recipe for any space disaster film: go into space, have the mission go awry, bring in the heroes to save the day. Guesses on thumbs up or down?

Hubble Observes Planet-“Polluted” Dead Stars In Hyades

Artist Impression of debris around a white dwarf star. Image credit: NASA, ESA, STScI, and G. Bacon (STScI)

For those of us who practice amateur astronomy, we’re very familiar with the 150 light-year distant Hyades star cluster – one of the jewels in the Taurus crown. We’ve looked at it countless times, but now the NASA/ESA Hubble Space Telescope has taken its turn observing and spotted something astronomers weren’t expecting – the debris of Earth-like planets orbiting white dwarf stars. Are these “burn outs” being polluted by detritus similar to asteroids? According to researchers, this new observation could mean that rocky planet creation is commonplace in star clusters.

“We have identified chemical evidence for the building blocks of rocky planets,” said Jay Farihi of the University of Cambridge in England. He is lead author of a new study appearing in the Monthly Notices of the Royal Astronomical Society. “When these stars were born, they built planets, and there’s a good chance they currently retain some of them. The material we are seeing is evidence of this. The debris is at least as rocky as the most primitive terrestrial bodies in our solar system.”

So what makes this an uncommon occurrence? Research tells us that all stars are formed in clusters, and we know that planets form around stars. However, the equation doesn’t go hand in hand. Out of the hundreds of known exoplanets, only four are known to have homes in star clusters. As a matter of fact, that number is a meager half percent, but why? As a rule, the stars contained within a cluster are young and active. They are busy producing stellar flares and similar brilliant activity which may mask signs of emerging planets. This new research is looking to the “older” members of the cluster stars – the grandparents which may be babysitting.

To locate possible candidates, astronomers have employed Hubble’s Cosmic Origins Spectrograph and focused on two white dwarf stars. Their return showed evidence of silicon and just slight levels of carbon in their atmospheres. This observation was important because silicon is key in rocky materials – a prime ingredient on Earth’s list and other similar solid planets. This silicon signature may have come from the disintegration of asteroids as they wandered too close to the stars and were torn apart. A lack of carbon is equally exciting because, while it helps shape the properties and origins of planetary debris, it becomes scarce when rocky planets are formed. This material may have formed a torus around the defunct stars which then drew the matter towards them.

“We have identified chemical evidence for the building blocks of rocky planets,” said Farihi. “When these stars were born, they built planets, and there’s a good chance they currently retain some of them. The material we are seeing is evidence of this. The debris is at least as rocky as the most primitive terrestrial bodies in our solar system.”

Ring around the rosie? You bet. This leftover material swirling around the white dwarf stars could mean that planet formation happened almost simultaneously as the stars were born. At their collapse, the surviving gas giants may have had the gravitational “push” to relocate asteroid-like bodies into “star-grazing orbits”.

This image shows the region around the Hyades star cluster, the nearest open cluster to us. The Hyades cluster is very well-studied due to its location, but previous searches for planets have produced only one. A new study led by Jay Farihi of the University of Cambridge, UK, has now found the atmospheres of two burnt-out stars in this cluster — known as white dwarfs — to be “polluted” by rocky debris circling the star. Inset, the locations of these white dwarf stars are indicated — stars known as WD 0421+162, and WD 0431+126.  Credit: NASA, ESA, STScI, and Z. Levay (STScI)
This image shows the region around the Hyades star cluster, the nearest open cluster to us. The Hyades cluster is very well-studied due to its location, but previous searches for planets have produced only one. A new study led by Jay Farihi of the University of Cambridge, UK, has now found the atmospheres of two burnt-out stars in this cluster — known as white dwarfs — to be “polluted” by rocky debris circling the star.
Inset, the locations of these white dwarf stars are indicated — stars known as WD 0421+162, and WD 0431+126. Credit: NASA, ESA, STScI, and Z. Levay (STScI)

“We have identified chemical evidence for the building blocks of rocky planets,” explains Farihi. “When these stars were born, they built planets, and there’s a good chance that they currently retain some of them. The signs of rocky debris we are seeing are evidence of this — it is at least as rocky as the most primitive terrestrial bodies in our Solar System. The one thing the white dwarf pollution technique gives us that we won’t get with any other planet detection technique is the chemistry of solid planets. Based on the silicon-to-carbon ratio in our study, for example, we can actually say that this material is basically Earth-like.”

What of future plans? According to Farihi and the research team, by continuing to observe with methods like those employed by Hubble, they can take an even deeper look at the atmospheres around white dwarf stars. They will be searching for signs of solid planet “pollution” – exploring the white dwarf chemistry and analyzing stellar composition. Right now, the two “polluted” Hyades white dwarfs are just a small segment of more than a hundred future candidates which will be studied by a team led by Boris Gansicke of the University of Warwick in England. Team member Detlev Koester of the University of Kiel in Germany is also contributing by using sophisticated computer models of white dwarf atmospheres to determine the abundances of various elements that can be traced to planets in the Hubble spectrograph data.

“Normally, white dwarfs are like blank pieces of paper, containing only the light elements hydrogen and helium,” Farihi said. “Heavy elements like silicon and carbon sink to the core. The one thing the white dwarf pollution technique gives us that we just won’t get with any other planet-detection technique is the chemistry of solid planets.”

The team also plans to look deeper into the stellar composition as well. “The beauty of this technique is that whatever the Universe is doing, we’ll be able to measure it,” Farihi said. “We have been using the Solar System as a kind of map, but we don’t know what the rest of the Universe does. Hopefully with Hubble and its powerful ultraviolet-light spectrograph COS, and with the upcoming ground-based 30- and 40-metre telescopes, we’ll be able to tell more of the story.”

And we’ll be listening…

Original Story Source: Hubble News Release.

Astronauts Find a Coolant Leak on the Space Station

The International Space Station. Credit: NASA

Astronauts on the International Space Station spotted small white flakes floating away from an area of the International Space Station’s P6 truss structure today (Thursday, May 9) and determined an ammonia-based coolant was leaking from the solar array system. While the coolant is vital to the operation of the ISS, NASA says at this point, the crew is not in any danger.

“It is a serious situation,” ISS Commander Chris Hadfield tweeted today, “but between crew and experts on the ground, it appears to have been stabilized. Tomorrow we find out for certain.”


The ammonia is used to cool electronics associated with solar arrays which provide electricity to station systems. NASA said the crew used handheld cameras and Mission Control used external television cameras to gain additional imagery in an attempt to narrow down the leak’s location.

Listen to audio from Hadfield reporting the leak to Mission Control.

The crew reports, along with imagery and data received by flight controllers in Mission Control in Houston, confirmed that the rate of the ammonia leaking from this section of the cooling system has increased.

Each solar array has its own independent cooling loop. There was a minor leak in the same area that was first identified in 2007 – thought to have been caused perhaps by a micrometeorite impact — and in November 2012 two astronauts went on a spacewalk to fix the problem. They rewired some coolant lines and installed a spare radiator, and it appeared the problem had been fixed.

NASA does not yet know whether this increased ammonia flow is from the same leak, which at the time of the spacewalk, was not visible. The early analysis by thermal control systems specialists indicates that the leak rate could result in a shutdown of this one cooling loop in about 48 hours.

Plans are being developed to reroute other power channels to maintain full operation of those and other systems normally controlled by the solar array that is cooled by this loop.

Current ISS Capcom in Mission Control Doug Wheelock radioed to the crew that “Tomorrow we’ll plan to get the (robotic) arm in the game to see if we can better pinpoint the location of the leak.”

Three of the crewmembers, Chris Hadfield, NASA astronaut Tom Marshburn and cosmonaut Roman Romanenko are scheduled to depart the station on Monday, May 13. Hadfield asked Wheelock is this leak might impact their undocking, but Wheelock said that they are still “getting their arms fully around the issue,” and would have more information for the crew by tomorrow morning.

How Long Does it Take to Get to Mars?

How Long Does it Take to Get to Mars?

This article originally appeared in Universe Today in July, 2012, but it’s been updated with a related video.

The planet Mars is one of the brightest objects in the night sky, easily visible with the unaided eye as a bright red star. Every two years or so, Mars and Earth reach their closest point, called “opposition”, when Mars can be as close as 55,000,000 km from Earth. And every two years, space agencies take advantage of this orbital alignment to send spacecraft to the Red Planet. How long does it take to get to Mars?

The total journey time from Earth to Mars takes between 150-300 days depending on the speed of the launch, the alignment of Earth and Mars, and the length of the journey the spacecraft takes to reach its target. It really just depends on how much fuel you’re willing to burn to get there. More fuel, shorter travel time.

History of Going to Mars:

The first spacecraft ever to make the journey from Earth to Mars was NASA’s Mariner 4, which launched on November 28, 1964 and arrived at Mars July 14, 1965, successfully taking a series of 21 photographs. Mariner 4’s total flight time was 228 days.

The next successful mission to Mars was Mariner 6, which blasted off on February 25, 1969 and reached the planet on July 31, 1969; a flight time of only 156 days. The successful Mariner 7 only required 131 days to make the journey.

The NASA team threw in every bit of data they could to model the Mars Curiosity landing. Credit: NASA

Mariner 9, the first spacecraft to successfully go into orbit around Mars launched on May 30, 1971, and arrived November 13, 1971 for a duration of 167 days. This is the same pattern that has held up for more almost 50 years of Mars exploration: approximately 150-300 days.

Here are some more examples:

  • Viking 1 (1976) – 335 days
  • Viking 2 (1976) – 360 days
  • Mars Reconnaissance Orbiter (2006) – 210 days
  • Phoenix Lander (2008) – 295 days
  • Curiosity Lander (2012) – 253 days

Why Does it Take So Long?:

A top-down image of the orbits of Earth and Mars. Image: NASA
A top-down image of the orbits of Earth and Mars. Credit: NASA

When you consider the fact that Mars is only 55 million km away, and the spacecraft are travelling in excess of 20,000 km/hour, you would expect the spacecraft to make the journey in about 115 days, but it takes much longer. This is because both Earth and Mars are orbiting around the Sun. You can’t point directly at Mars and start firing your rockets, because by the time you got there, Mars would have already moved. Instead, spacecraft launched from Earth need to be pointed at where Mars is going to be.

The other constraint is fuel. Again, if you had an unlimited amount of fuel, you’d point your spacecraft at Mars, fire your rockets to the halfway point of the journey, then turn around and decelerate for the last half of the journey. You could cut your travel time down to a fraction of the current rate – but you would need an impossible amount of fuel.

How to Get to Mars with the Least Amount of Fuel:

The primary concern of engineers is how to get a spacecraft to Mars, on the least amount of fuel. Robots don’t really care about the hostile environment of space, so it makes sense to decrease the launch costs of the rocket as much as possible.

NASA engineers use a method of travel called a Hohmann Transfer Orbit – or a Minimum Energy Transfer Orbit – to send a spacecraft from Earth to Mars with the least amount of fuel possible. The technique was first proposed by Walter Hohmann who published the first description of the maneuver in 1925.

Instead of pointing your rocket directly at Mars, you boost the orbit of your spacecraft so that it’s following a larger orbit around the Sun than the Earth. Eventually that orbit will intersect the orbit of Mars – at the exact moment that Mars is there too.

If you need to launch with less fuel, you just take longer to raise your orbit, and increase the journey to Mars.

Other Ideas to Decrease the Travel Time to Mars:

Although it requires some patience to wait for a spacecraft to travel 250 days to reach Mars, we might want a completely different propulsion method if we’re sending humans. Space is a hostile place, and the radiation of interplanetary space might pose a longterm health risk to human astronauts. The background cosmic rays inflict a constant barrage of cancer-inducing radiation, but there’s a bigger risk of massive solar storms, which could kill unprotected astronauts in a few hours. If you can decrease the travel time, you reduce the amount of time astronauts are getting pelted with radiation, and minimize the amount of supplies they need to carry for a return journey.

Go Nuclear:
One idea is nuclear rockets, which heat up a working fluid – like hydrogen – to intense temperatures in a nuclear reactor, and then blast it out a rocket nozzle at high velocities to create thrust. Because nuclear fuels are far more energy dense than chemical rockets, you could get a higher thrust velocity with less fuel. It’s proposed that a nuclear rocket could decrease the travel time down to about 7 months

Go Magnetic:
Another proposal is a technology called the Variable Specific Impulse Magnetoplasma Rocket (or VASIMR). This is an electromagnetic thruster which uses radio waves to ionize and heat a propellant. This creates an ionized gas called plasma which can be magnetically thrust out the back of the spacecraft at high velocities. Former astronaut Franklin Chang-Diaz is pioneering the development of this technology, and a prototype is expected to be installed on the International Space Station to help it maintain its altitude above Earth. In a mission to Mars, a VASIMR rocket could reduce the travel time down to 5 months.

Go Antimatter:
Perhaps one of the most extreme proposals would be to use an antimatter rocket. Created in particle accelerators, antimatter is the most dense fuel you could possibly use. When atoms of matter meet atoms of antimatter, they transform into pure energy, as predicted by Albert Einstein’s famous equation: E = mc2. Just 10 milligrams of antimatter would be needed to propel a human mission to Mars in only 45 days. But then, producing even that minuscule amount of antimatter would cost about $250 million.

Artist's concept of Antimatter propulsion system. Credit: NASA/MFSC
Artist’s concept of Antimatter propulsion system. Credit: NASA/MFSC

Future Missions to Mars:

Even though some incredible technologies have been proposed to shorten the travel time to Mars, engineers will be using the tried and true methods of following minimum energy transfer orbits using chemical rockets. NASA’s MAVEN mission will launch in 2013 using this technique, as well ESA’s ExoMars missions. It might be a few decades before other methods become common techniques.

Research further:
Information about Interplanetary Orbits – NASA
7 Minutes of Terror – The Challenge of Landing at Mars
NASA Proposal for a nuclear rocket engine
Hohmann Transfer Orbits – Iowa State University
Minimum Transfers and Interplanetary Orbits
New and Improved Antimatter Space Ship for Mars Missions – NASA
Astronomy Cast Episode 84: Getting Around the Solar System

Related Stories from Universe Today:
Travel to Mars in Only 39 Days
A One Way, One Person Mission to Mars
Could a Human Mission to Mars be Funded Commercially?
How Will MSL Navigate to Mars? Very Carefully
A Cheap Solution to Getting to Mars?
Why have so many missions to Mars failed?

This article originally appeared in Universe Today in July, 2012, but it’s been updated with a related video.

This Diagram is Better than 183,487 Images

Hertzsprung-Russell Diagram. Credit: ESO.

When it comes to immediate and widespread appeal, astronomical diagrams have it tough. There’s a reason we have Most Awesome Space Images of 2012, but not “Astronomy’s coolest diagrams 2012.” But arguably, diagrams (more concretely: plots that help us visualize one or more physical quantities) are the key to understanding what’s up with all those objects whose colorful images we know and love.

To be sure, some diagrams have become quite famous. Take the Hubble diagram plotting galaxies’ redshifts against their distances: Its earliest version marks the discovery that we live in an expanding universe. A more recent incarnation, which shows how cosmic expansion is accelerating, won its creators the 2011 Nobel prize in physics.

Another famous diagram is the Hertzsprung-Russell diagram (HR diagram, for short, shown above.) A single star doesn’t tell you all that much about stars in general. But if you plot the brightnesses and colors of many stars, patterns begin to emerge – such as the distinctive broad band of the “main sequence” bisecting the HR diagram diagonally, the realm of the giants and supergiants to its upper right and the White Dwarfs below on the left.

When astronomers first recognized those patterns, they took the first steps towards our modern understanding of how stars evolve over time.

The first HR diagram was published by the US astronomer Henry Norris Russell in 1913 (or at least described in words, if you look at the article); Hubble’s first diagram in 1929. Off the top of my head, I cannot think of any famous astronomical plot with more recent roots.

But that doesn’t mean there aren’t some plots that by rights should be famous. Here’s my rendition of what, back in 2003, must have been one of the first comprehensive examples of its kind (from this article by Blanton et al. 2003). The diagram shows the colors of many different galaxies, and how frequently or less frequently one encounters galaxies with those particular colors:

fig1a

If you’re not familiar with this type of plot, it’s best to think of the vertical lines as dividing the diagram into bins – think “glass cylinders you can put stuff in.” Next, obtain a sample of images of distant galaxies. Here are some that I retrieved with the Skyserver Tool kindly provided by the folks who produced the Sloan Digital Sky Survey (SDSS) — a huge survey that, in its latest data release, lists more than 1.4 million galaxies:

Galaxies from the Sloan Digital Sky Survey.

If these images are less detailed than what you’re used to, it’s because the galaxies are very far away even by extragalactic standards — their light takes almost 1.3 billion years to reach us. Even so, you can readily distinguish the galaxies’ different colors.

With that information, back to our (glass) bins. Think of the differently colored galaxies as differently colored marbles. Each bin accepts galaxies of one particular shade of color – so put each marble into the appropriate bin! As you do, some of the bins will fill up more, some less. The colored bars indicate each bin’s filling level. On the scale to the left, you can read off the corresponding numbers. For instance, the best-filled bin contains a little more than 5 percent of all the galaxy-marbles.

Now that you know how to read the diagram, let’s remove the extra vertical lines. In a paper published in an astronomical research journal, this is what a “histogram” of this kind would look like:

Galaxy distribution by color. Credit: Markus Pössel

I’ve left the coloring in even though you’d probably not find it in an astronomical paper. The astronomers’ own measure of color, denoted “g-r” on the horizontal axis, is a bit technical — let’s ignore those details and stick with the colors we see in the diagram.

To fill the bins in this particular diagram, the astronomers from the SDSS collaboration sorted 183,487 galaxies from their survey by color.

So what does the diagram tell us? Evidently, there are two peaks: one near the bluish end on the left, one near the reddish end on the right. That indicates two distinct types of galaxies. Galaxies of the first kind are, on average, of a bluish-white color, with some specimens a little more and some a little less blue (which is why the peak is a little broad). Galaxies of the other kind are, on average, much redder.

A galaxy’s color derives from its stars. A bluish galaxy is one with bluish stars. Bluish stars are hotter than reddish ones. (Think of heating metal: It starts out a dull red, becomes orange, then white-hot; if you could make metal even hotter, it would radiate bluish.) Hot stars are more massive than cooler stars, and they live fast and die young — the most massive ones die after much less than a million years, a fleeting moment compared with our Sun’s estimated lifetime of ten billion years. For a galaxy to glow an overall blue, it must have a steady supply of these short-lived bluish stars, producing new blue stars in sufficient quantities as the old ones burn out. So evidently, the galaxies of the bluish kind are continually producing new bluish stars. Since there is no known mechanism that makes a galaxy produce only bluish stars, we can drop the qualifier: these galaxies are continually producing new stars.

The reddish galaxies, on the other hand, produce hardly any new stars. If they did, then by all we know about star formation there should be sufficient bluish stars around to give these galaxies an overall bluish tint. Without any new stars, all that is left are long-lived, less massive stars, and those tend to be cooler and more reddish.

The existence of two distinct classes of galaxies — star-forming vs. “red and dead” — is a driving force behind current research on galaxy evolution in much the same way the HR diagram was for stellar evolution. Why are there two distinct kinds? What makes the bluish galaxies produce stars, and what prevents the reddish ones? Do galaxies move from one camp to the other over time? And if yes, how and in which direction? When you read an article like this about the care and feeding of teenage galaxies, or this one about galaxies recycling their gas, it’s all about astronomers trying to find pieces of the puzzle of why there are these two populations.

This diagram clearly deserves wider public recognition. And no doubt there are many other, equally under-appreciated astronomical plots. Please help me give them some of the recognition they deserve: Which diagrams have done the most to increase your understanding of what’s out there? Which have surprised you? Which have sent a thrill down your spine? Please post a link or a description, and let’s see if we can create a “Top 10” list of astronomical diagrams. And who knows: We might even try for an “Astronomy’s coolest diagrams 2013” at the end of the year.

__________________________________________

Additional information about how the two-peak galaxy diagram was made, including different versions for download and the python script that produced it, can be found here. If you do want to know about the technical details about the color: The values on the x axis correspond to g-r, where g is the star’s brightness (expressed in the usual astronomical magnitude system) through one particular greenish filter and r the brightness through one particular reddish filter. Details about the ugriz filter system used can be found on this SDSS page. And in case you’re worrying about the effect cosmic redshift might have had on the galaxies in the sample: the astronomers took care to compensate for that particular effect, correcting the colors to appear as they would if each of the galaxies were so far away that its light would take 1.29 billion years to reach us (that is, at a cosmic redshift of z=0.1).

Many thanks to Kate H.R. Rubin for pointing me to the galaxy diagram and for helpful discussions.

Venus Comes Out of Hiding! How to See Upcoming Conjunctions in the Evening Sky

Starting Friday the moon will be your guide to Venus' return to the evening sky. This map shows the sky facing west-northwest about 30 minutes after sunset across the middle of the U.S., but it's useful from 30-50 degrees north. Venus will be 4 degrees high at the time. Friday's moon is very thin! Stellarium

Has Venus finally come out of hiding? For the past couple months it’s kept close to the sun, hidden in its glare, but come Friday, sky watchers in mid-northern latitudes may get their first shot at seeing the planet’s return to the evening sky.

It won’t be easy, but you’ll have help from the knife-edged crescent moon. Like a spring bloom raising its head from the dark earth, Venus will poke just 4 degrees above the western horizon a half hour after sunset. The moon will be about 2 degrees to the lower left of the planet. Seeing both requires a wide open view to the west and a clean, cloudless sky. It also helps to know when the sun sets for your location – easily found by clicking HERE.

Most any binoculars will prove useful for seeing Venus in twilight this week. One of my (inexpensive) favorites is a pair of Nikon Action 8x40s. Once you spot the planet in binoculars, try to see it with your naked eye. Credit: Bob King

Take along a pair of binoculars. They’ll help fish out both moon and planet in the bright twilight sky. It’s also advantageous to arrive at your viewing spot a little early. Enjoy the sunset, and then take a minute to make sure you’re binoculars are focused at infinity. If you don’t, Venus will be a blur and much harder to find. I usually focus mine on a cloud or the very farthest thing out along the horizon.

Once you’re all set, point your binoculars in the sunset direction and slowly sweep back and forth. Venus will be a short distance to the left or south of the brightest glow remaining along the horizon. Since most binoculars have a field of view of 4 or 5 degrees, when you place the horizon at the bottom of the view, the moon should appear in the middle of the field and Venus up near the top. Look higher and lower and farther left and right to be thorough. Once spotted in binoculars, take the visual challenge and see if you can find it without optical aid.

Venus punctuates colorful clouds low in the west in August 2008. Credit: Bob King
Venus punctuates a colorful sky low in the west at dusk in August 2008. Credit: Bob King

If you succeed, you’ll be rewarded with an elegant eyeful. Swamped in skylight, Venus will appear unusually meek but still possess its classic fiery brilliance. The newborn crescent will float just a degree and a half (three full moon diameters) away. From the U.S. east coast, the moon will be just 24 hours old; from the west coast 27 hours. Seeing such a young moon is a rarity in itself, but in the company of Venus that much finer.

Let’s say conditions aren’t ideal and you miss the pair on Friday. Well, try again on Saturday. The moon will be higher and much easier to see. Use it as a bow to shoot an imaginary arrow horizon-ward to Venus. And did I mention Jupiter? The planet that cheerily lit up our winter nights is now departing in the west. Watch for it to have a close encounter with Venus on the nights of May 27-28.

With its perpetual clouds, Venus would be a most distressing planet to any skywatcher unfortunate enough to live there. Yet it’s those same clouds that make it the most brilliant planet in the solar system seen from Earth. Clouds reflect sunlight splendidly. Combined with Venus’ proximity to Earth, it’s no wonder the planet earned the title of goddess of love and beauty.

As Venus revolves around the sun, we see it from a constantly changing perspective from our vantage point on Earth. In May, the planet is slightly to the left or east of the sun and making its reappearance as nearly "full moon" in evening twilight. Come Halloween it will appear like a half-moon. Credit: Bob King
As Venus and Earth revolve around the sun at different speeds, we see Venus from a constantly changing perspective. In May, the planet is slightly to the left or east of the sun and looks like a miniature full moon at dusk. Come Halloween it resembles a half-moon and a crescent at Christmas. Credit: Bob King

In the first 3 months of this year, Venus remained close to the sun in the morning sky and difficult to see. Then on March 28, it passed behind the sun on the opposite side of Earth’s orbit; astronomers call the lineup superior conjunction. Seen from Earth, Venus looked like a tiny full moon. We’re now about 6 weeks past conjunction and the planet has begun to peek out into the evening sky. At 98% illuminated, it still looks nearly full through a telescope, but that will change in the coming months as Venus approaches Earth in its speedier orbit. Watch for the goddess to grow larger in apparent size while at the same time slimming down her phase from full to half to crescent. Good luck getting re-acquainted this weekend!

Amateur Astronomer Catches Record Setting Gamma-Ray Burst

Vigilance and a little luck paid off recently for an amateur astronomer.

On April 27th, 2013 a long lasting gamma-ray burst was recorded in the northeastern section of the constellation Leo. As reported here on Universe Today, the burst was the most energetic ever seen, peaking at about 94 billion electron volts as seen by Fermi’s Large Area Telescope. In addition to Fermi’s Gamma Ray Burst Monitor, the Swift satellite and a battery of ground based instruments also managed to quickly swing into action and record the burst as it was underway.

Patrick Wiggins' capture of the optical counterpart to GRB 130427A with extrapolated light curve. Note that the Moon was just two days past Full in the direction of the constellation Libra at the time, hence the sky glow! (Credit: Patrick Wiggins).
Patrick Wiggins’ capture of the optical counterpart to GRB 130427A with extrapolated light curve. Note that the Moon was just two days past Full in the direction of the constellation Libra at the time, hence the sky glow! (Credit: Patrick Wiggins).

But professionals weren’t the only ones to capture the event. Amateur astronomer Patrick Wiggins was awake at the time, doing routine observations from his observatory based near Toole, Utah when the alert message arrived. He quickly swung his C-14 telescope  into action at the coordinates of the burst at 11 Hours 32’ and 33” Right Ascension and +27° 41’ 56” declination.

Wiggins then began taking a series of 60-second exposures with his SBIG ST-10XME imager and immediately found something amiss. A 13th magnitude star had appeared in the field. At first, Wiggins believed this was simply too bright to be a gamma-ray burst transient, but he continued to image the field into the morning of April 27th.

Wiggins had indeed caught his optical prey, the very first gamma-ray burst he’d captured. And what a burst it was. At only 3.6 billion light years distant, GRB 130427A (gamma-ray bursts are named after the year-month-day of discovery) was one for the record books, and in the top five percent of the closest bursts ever observed.

Mr. Wiggins further elaborated the fascinating story of the observation to Universe Today:

“I was imaging an area near where the burst occurred and received an email GCN Circular and a GCN/SWIFT Notice of the event within minutes of it happening.  As bad luck would have it I was in the kitchen fixing a late night snack when both arrived so I was about 10 minutes late reading them.

I figured that 10 minutes was way too late as these things typically only last a minute or two but I slewed to the coordinates indicated in the notices and shot a quick picture.  There was a bright “something” in the middle of the frame as shown here with the POSS comparison image:”

POSS comparison image of the field of GRB 130427A. (Credit: Partick Wiggins).

But I thought it looked way too bright for a GRB so I moved the telescope slightly (to see if the object was a ghost or an artifact in the system) and shot again but it was still there.

A quick check of the POSS showed nothing should be there so I started shooting pictures at five minute intervals until dawn and it was those images I used to put together the light curve:”

Expanded light curve of GRB 130427A. (Credit: Patrick Wiggins).

Amazingly, the RAPTOR (RAPid Telescopes for Optical Response) array recorded a peak brightness in optical wavelengths of magnitude +7.4 just less than a minute before the Swift spacecraft swung into action. This is just below the dark sky limiting naked-eye magnitude of +6. This is also just below the record optical brightness set by GRB 080319B, which briefly reached magnitude +5.3 back in 2008.

RAPTOR-K & RAPTOR-T based at the Fenton Hill Observatory in New Mexico. (Credit: NNSA/Los Alamos National Laboratory/Dept. of Energy).

RAPTOR is run by the Los Alamos National Laboratory and is based at Fenton Hill Observatory in the Jemez Mountains of New Mexico 56 kilometres west of Los Alamos.

The Catalina Real-Time Transient Survey based outside of Tucson Arizona also detected the burst independently, giving it the designation CSS130502: 113233+274156. The burst occurred less than a degree from the +13th magnitude galaxy NGC 3713, and the galaxy SDSS J113232.84+274155.4 is also very close to the observed position of the burst.

Mr. Wiggins’ observation also raises an intriguing possibility. Did anyone catch a surreptitious image of the burst? Anyone wide-field imaging right around the three-way junction of the constellations Ursa Major, Leo & Leo Minor at the correct time might just have caught GRB 130427A in the act. Make sure to review those images!

Follow up observations of gamma-ray bursts are just one of the ways that amateur backyard observers continue to contribute to the science of astronomy. Observers such as Mr. Wiggins and James McGaha based at the Grasslands Observatory near Sonita, Arizona routinely swing their equipment into action chasing after optical transients as alert messages for gamma-ray events are received.

Gamma-ray bursts where first discovered in 1967 by the Vela spacecraft designed to monitor nuclear weapons testing during the Cold War. They come in two varieties: short period and long duration bursts. Short period bursts of less than two seconds duration are thought to occur when a binary pulsar pair merges, while long duration bursts such as GRB 130427A occur when a massive red giant star undergoes a core collapse and shoots a high energy jet directly along its poles in a hypernova explosion. If the burst is aimed in our direction, we get to see the event. Thankfully, no possible progenitors of a long duration gamma-ray burst lie aimed at us in our galaxy, though the Wolf-Rayet stars Eta Carinae and WR 104 both about 8,000 light years distant are worth keeping an eye on. Luckily, neither of these massive stars is known to have rotational poles tipped in our general direction.

Scary stuff to consider as we hunt for the next “Big One” in the night sky. In the meantime, we’ve got much to learn from gamma-ray bursts such as GRB 130427A. Congrats to Mr. Wiggins on his first gamma-ray burst observation… the event was made all the more special by the fact that it occurred on his birthday!

-Mr Patrick Wiggins is NASA/JPL Ambassador to the state of Utah.

– Read the American Association of Variable Star Observers (AAVSO) report of the light curve of GRB 130427A as reported by Mr. Wiggins here.

– NASA’s Goddard Space Flight Center maintains a clearing house of the latest GRB alerts in near-real-time here.

– You can also now receive GRB alerts via @Gammaraybursts on Twitter, as well as follow NASA’s Swift and Fermi missions.

– And of course, “there’s an App for that” in the world of GRB alerts in the form of the free Swift Explorer App for the Iphone.

Hydrogen Clouds Discovered Between Andromeda And Triangulum Galaxies

This combined graphic shows new, high-resolution GBT imaging (in box) of recently discovered hydrogen clouds between M31 (upper right) and M33 (bottom left). Credit: Bill Saxton, NRAO/AUI/NSF.

Score another point for the National Science Foundation’s Green Bank Telescope (GBT) at the National Radio Astronomy Observatory (NRAO) in Green Bank. They have opened our eyes – and ears – to previously undetected region of hydrogen gas clouds located in the area between the massive Andromeda and Triangulum galaxies. If researchers are correct, these dwarf galaxy-sized sectors of isolated gases may have originated from a huge store of heated, ionized gas… Gas which may be associated with elusive and invisible dark matter.

“We have known for some time that many seemingly empty stretches of the Universe contain vast but diffuse patches of hot, ionized hydrogen,” said Spencer Wolfe of West Virginia University in Morgantown. “Earlier observations of the area between M31 and M33 suggested the presence of colder, neutral hydrogen, but we couldn’t see any details to determine if it had a definitive structure or represented a new type of cosmic feature. Now, with high-resolution images from the GBT, we were able to detect discrete concentrations of neutral hydrogen emerging out of what was thought to be a mainly featureless field of gas.”

So how did astronomers detect the extremely faint signal which clued them to the presence of the gas pockets? Fortunately, our terrestrial radio telescopes are able to decipher the representative radio wavelength signals emitted by neutral atomic hydrogen. Even though it is commonplace in the Universe, it is still frail and not easy to observe. Researchers knew more than 10 years ago that these repositories of hydrogen might possibly exist in the empty space between M33 and M32, but the evidence was so slim that they couldn’t draw certain conclusions. They couldn’t “see” fine grained structure, nor could they positively identify where it came from and exactly what these accumulations meant. At best, their guess was it came from an interaction between the two galaxies and that gravitational pull formed a weak “bridge” between the two large galaxies.

The animation demonstrates the difference in resolution from the original Westerbork Radio Telescope data (Braun & Thilker, 2004) and the finer resolution imaging of GBT, which revealed the hydrogen clouds between M31 and M33. Bill Saxton, NRAO/AUI/NSF Credit: Bill Saxton, NRAO/AUI/NSF.

Just last year, the GBT observed the tell-tale fingerprint of hydrogen gas. It might be thin, but it is plentiful and it’s spread out between the galaxies. However, the observations didn’t stop there. More information was gathered and revealed the gas wasn’t just ethereal ribbons – but solid clumps. More than half of the gas was so conspicuously aggregated that they could even have passed themselves off as dwarf galaxies had they a population of stars. What’s more, the GBT also studied the proper motion of these gas pockets and found they were moving through space at roughly the same speed as the Andromeda and Triangulum galaxies.

“These observations suggest that they are independent entities and not the far-flung suburbs of either galaxy,” said Felix J. Lockman, an astronomer at the NRAO in Green Bank. “Their clustered orientation is equally compelling and may be the result of a filament of dark matter. The speculation is that a dark-matter filament, if it exists, could provide the gravitational scaffolding upon which clouds could condense from a surrounding field of hot gas.”

And where there is neutral hydrogen gas, there is fuel for new stars. Astronomers also recognize these new formations could eventually be drawn into M31 and M33, eliciting stellar creation. To add even more interest, these cold, dark regions which exist between galaxies contain a large amount of “unaccounted-for normal matter” – perhaps a clue to dark matter riddle and the reason behind the amount of hydrogen yet to revealed in universal structure.

“The region we have studied is only a fraction of the area around M31 reported to have diffuse hydrogen gas,” said D.J. Pisano of West Virginia University. “The clouds observed here may be just the tip of a larger population out there waiting to be discovered.”

Original Story Source: National Radio Astronomy Observatory News Release.