Greedy Galaxies Gobbled Gas, Stalling Star Formation Billions Of Years Ago

Arp 147 contains a spiral galaxy (right) that collided with an elliptical galaxy (left), triggering a wave of star formation. Credit: X-ray: NASA/CXC/MIT/S.Rappaport et al, Optical: NASA/STScI

Like millionaires that burn through their cash too quickly, astronomers have found one factor behind why compact elliptical galaxies stopped growing stars about 11 billion years ago: they ate through their gas reserves.

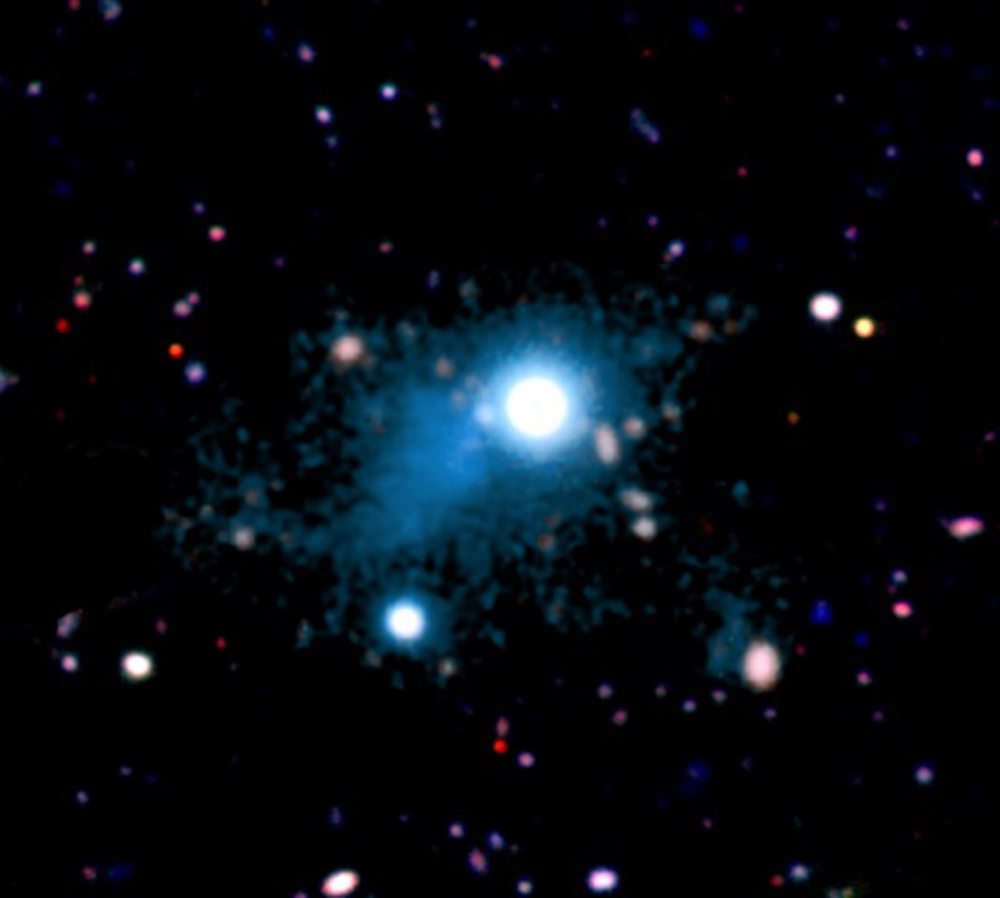
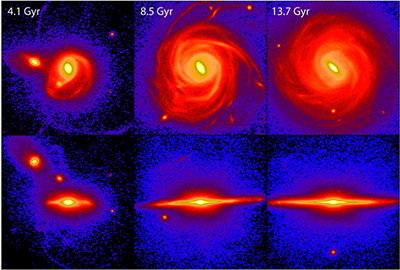
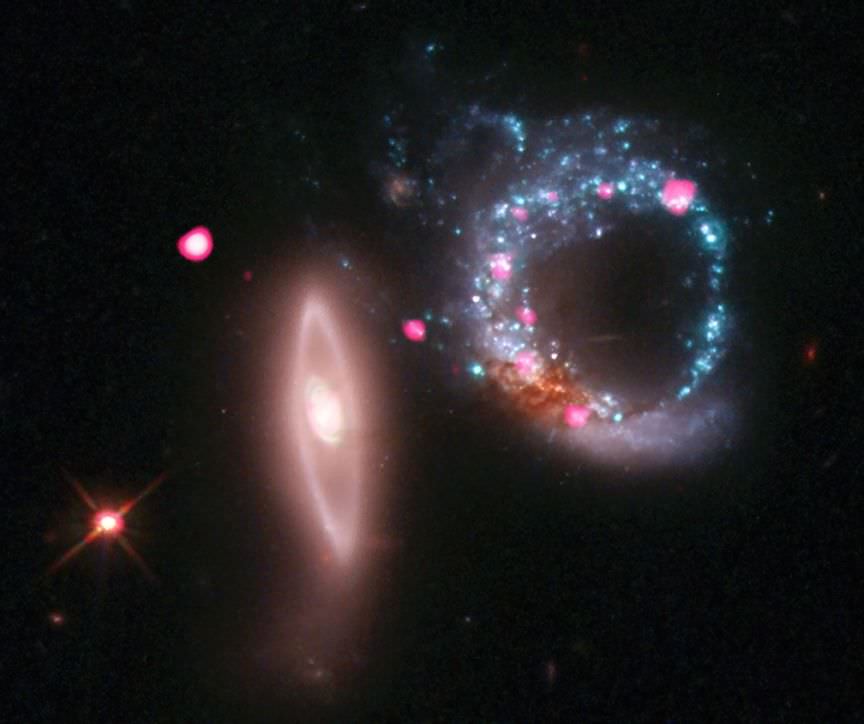
The revelation comes as researchers released a new evolutionary track for compact elliptical galaxies that stopped their star formation when the universe was just three billion years old. When these galaxies ran out of gas, some of them cannibalized smaller galaxies to create giant elliptical galaxies. The “burned-out”galaxies have stars crowding 10 to 100 times more densely than elliptical galaxies formed more recently through a different evolutionary track.

“We at last show how these compact galaxies can form, how it happened, and when it happened. This basically is the missing piece in the understanding of how the most massive galaxies formed, and how they evolved into the giant ellipticals of today,” stated Sune Toft, who led the study and is a researcher at the Dark Cosmology Center at the Niels Bohr Institute in Copenhagen.

“This had been a great mystery for many years, because just three billion years after the Big Bang we see that half of the most massive galaxies have already completed their star formation.”

How massive elliptical galaxies evolved in about 13 billion years. Credit: NASA, ESA, S. Toft (Niels Bohr Institute), and A. Feild (STScI)

The team got a snapshot of these galaxies’ evolution by looking at a representative sample with the Hubble Space Telescope, specifically through the Cosmic Assembly Near-Infrared Deep Extragalactic Legacy Survey (CANDELS) and a spectroscopic survey called 3D-HST. To find out how old the stars were, they combined the Hubble work with data gathered from the  Spitzer Space Telescope and the Subaru Telescope in Hawaii.

Next, they examined ancient, fast-star-forming submillimeter galaxies with data gathered from a range of space and ground-based telescopes.

The Hubble Space Telescope. image credit: NASA, tweaked by D. Majaess.

“This multi-spectral information, stretching from optical light through submillimeter wavelengths, yielded a full suite of information about the sizes, stellar masses, star-formation rates, dust content, and precise distances of the dust-enshrouded galaxies that were present early in the universe,” Hubble’s news center stated.

The group found that that the submillimeter galaxies were likely “progenitors” of compact elliptical galaxies, as they share predicted characteristics of the ancestors. Further, researchers calculated that starbursts in submillimeter galaxies only went on for about 40 million years before the galaxies ran out of gas.

You can read the results in the Feb. 20 edition of the Astrophysical Journal or in prepublished version in Arxiv.

Source: Hubble News Center

‘Cosmic Flashlight’ Makes Gas Glow Like A Fluorescent Light Bulb

A nebula (seen in cyan) that is about two million light-years across. It was found surrounding the bright quasar UM287 (center). Credit: S. Cantalupo (UCSC)

Funny how a single quasar can illuminate — literally and figuratively — some of the mysteries of the universe. From two million light-years away, astronomers spotted a quasar (likely a galaxy with a supermassive black hole in its center) shining on a nearby collection of gas or nebula. The result is likely showing off the filaments thought to connect galaxies in our universe, the team said.

“This is a very exceptional object: it’s huge, at least twice as large as any nebula detected before, and it extends well beyond the galactic environment of the quasar,” stated Sebastiano Cantalupo, a postdoctoral fellow at the University of California Santa Cruz who led the research.

The find illuminated by quasar UM287  could reveal more about how galaxies are connected with the rest of the “cosmic web” of matter, astronomers said. While these filaments were predicted in cosmological simulations, this is the first time they’ve been spotted in a telescope.

“Gravity causes ordinary matter to follow the distribution of dark matter, so filaments of diffuse, ionized gas are expected to trace a pattern similar to that seen in dark matter simulations,” UCSC stated.

A graphic showing how matter in the universe could be distributed. Some astronomers believe matter is sprinkled as a a "cosmic web" of filaments. The larger section shows a dark-matter simulation (by Anatoly Klypin and Joel Primack) and the inset a smaller portion, 10 million light-years across, from another simulation that also includes gas (S. Cantalupo).  Credit:  S. Cantalupo (UCSC), Joel Primack (UCSC) and Anatoly Klypin (NMSU).
A graphic showing how matter in the universe could be distributed. Some astronomers believe matter is sprinkled as a a “cosmic web” of filaments. The larger section shows a dark-matter simulation (by Anatoly Klypin and Joel Primack) and the inset a smaller portion, 10 million light-years across, from another simulation that also includes gas (S. Cantalupo). Credit: S. Cantalupo (UCSC), Joel Primack (UCSC) and Anatoly Klypin (NMSU).

Astronomers added that it was lucky that the quasar happened to be shining in the right direction to illuminate the gas, acting as a sort of “cosmic flashlight” that could show us more of the underlying matter. UM287 is making the gas glow in a similar way that fluorescent light bulbs behave on Earth, the team added.

“This quasar is illuminating diffuse gas on scales well beyond any we’ve seen before, giving us the first picture of extended gas between galaxies,” stated J. Xavier Prochaska, coauthor and professor of astronomy and astrophysics at UC Santa Cruz. “It provides a terrific insight into the overall structure of our universe.”

The find was made using the 10-meter Keck I telescope at the W. M. Keck Observatory in Hawaii. You can check out more details on the discovery on the Keck Observatory’s website or at this press release from the Max Planck Institute for Astronomy in Heidelberg, Germany.

The research was published in the Jan. 19 edition of Nature and available in preprint version on Arxiv.

Milky Way Shakes, Rattles and Rolls…

Three stages of the evolution of the galaxy simulation used to model the Milky Way. (Credit: AIP)

For decades astronomers have puzzled over the many details concerning the formation of the Milky Way Galaxy. Now a group of scientists headed by Ivan Minchev from the Leibniz Institute for Astrophysics Potsdam (AIP) have managed to retrace our galaxy’s formative periods with more detail than ever before. This newly published information has been gathered through careful observation of stars located near the Sun and points to a rather “moving” history.

To achieve these latest results, astronomers observed stars perpendicular to the galactic disc and their vertical motion. Just to shake things up, these stars also had their ages considered. Because it is nearly impossible to directly determine a star’s true age, they rattled the cage of chemical composition. Stars which show an increase in the ratio of magnesium to iron ([Mg/Fe]) appear to have a greater age. These determinations of stars close to the Sun were made with highly accurate information gathered by the RAdial Velocity Experiment (RAVE). According to previous findings, “the older a star is, the faster it moves up and down through the disc”. This no longer seemed to be true. Apparently the rules were broken by stars with the highest magnesium-to-iron ratios. Despite what astronomers thought would happen, they observed these particular stars slowing their roll… their vertical speed decreasing dramatically.

So what’s going on here? To help figure out these curious findings, the researchers turned to computer modeling. By running a simulation of the Milky Way’s evolutionary patterns, they were able to discern the origin of these older, slower stars. According to the simulation, they came to the conclusion that small galactic collisions might be responsible for the results they had directly observed.

Smashing into, or combining with, a smaller galaxy isn’t new to the Milky Way. It is widely accepted that our galaxy has been the receptor of galactic collisions many times during its course of history. Despite what might appear to be a very violent event, these incidents aren’t very good at shaking up the massive regions near the galactic center. However, they stir things up in the spiral arms! Here star formation is triggered and these stars move away from the core towards our galaxy’s outer edge – and near our Sun.

In a process known as “radial migration”, older stars, ones with high values of magnesium-to-iron ratio, are pushed outward and display low up-and-down velocities. Is this why the elderly, near-by stars have diminished vertical velocities? Were they forced from the galactic center by virtue of a collision event? Astronomers speculate this to be the best answer. By comparison, the differences in speed between stars born near the Sun and those forced away shows just how massive and how many merging galaxies once shook up the Milky Way.

Says AIP scientist Ivan Minchev: “Our results will enable us to trace the history of our home galaxy more accurately than ever before. By looking at the chemical composition of stars around us, and how fast they move, we can deduce the properties of satellite galaxies interacting with the Milky Way throughout its lifetime. This can lead to an improved understanding of how the Milky Way may have evolved into the galaxy we see today.”

Original Story Source: Leibniz Institute for Astrophysics Potsdam News Release. For further reading: A new stellar chemo-kinematic relation reveals the merger history of the Milky Way.

What a Star About to Go Supernova Looks Like

SBW2007 is a nebula with a giant star at its center. All indications are that it could explode as a supernova at any time. Credit: ESA/NASA, acknowledgement: Nick Rose.

No, this isn’t a distant view of the London Eye. This nebula with a giant star at its center is known as SBW2007, located in the Carina Nebula. Astronomers say it has striking similarities to a star that went supernova back in 1987, SN 1987A. Both stars had identical rings of the same size and age, which were travelling at similar speeds; both were located in similar HII regions; and they had the same brightness. We didn’t have the telescopic firepower back before 1987 like we do now, so we don’t have a closeup view of how SN 1987A looked before it exploded, but astonomers think SBW2007 is a snapshot of SN1987a’s appearance, pre-supernova.

Of course, no one can predict when a star will go supernova, and since SBW2007 is 20,000 light-years away, we don’t have any worries about it causing any problems here on Earth. But astronomers are certainly hoping they’ll have the chance to watch it happen.

SN 1987A is the closest supernova to that we’ve been able to study since the invention of the telescope and it has provided scientists with good opportunities to study the physical processes of an exploding star.

Below is the latest image of SN 1987A, courtesy of the National Radio Astronomy Observatory. You can read about their recent findings here, where they were able to image the newly formed dust from the explosion.

Composite image of supernova 1987A. ALMA data (in red) shows newly formed dust in the center of the remnant. HST (in green) and Chandra (in blue) show the expanding shockwave. Credit: R. Indebetouw et. al, A. Angelich (NRAO/AUI/NSF); NASA/STScI/CfA/R. Kirshner; NASA/CXC/SAO/PSU/D. Burrows et al.

Source: NASA & ESA

ESA’s Gaia Mission Launches to Map the Milky Way

Soyuz VS06, with Gaia space observatory, lifted off from Europe's Spaceport, French Guiana, on 19 December 2013. (ESA–S. Corvaja)

Early this morning, at 09:12 UTC, the cloudy pre-dawn sky above the coastal town of Kourou, French Guiana was brilliantly sliced by the fiery exhaust of a Soyuz VS06, which ferried ESA’s “billion-star surveyor” Gaia into space to begin its five-year mission to map the Milky Way.

Ten minutes after launch, after separation of the first three stages, the Fregat upper stage ignited, successfully delivering Gaia into a temporary parking orbit at an altitude of 175 km (108 miles). A second firing of the Fregat 11 minutes later took Gaia into its transfer orbit, followed by separation from the upper stage 42 minutes after liftoff. 46 minutes later Gaia’s sunshield was deployed, and the spacecraft is now cruising towards its target orbit around L2, a gravitationally-stable point in space located 1.5 million km (932,000 miles) away in the “shadow” of the Earth.

The launch itself was really quite beautiful, due in no small part to the large puffy clouds over the launch site. Watch the video below:

A global space astrometry mission, Gaia will make the largest, most precise three-dimensional map of our galaxy by surveying more than a billion stars over a five-year period.

“Gaia promises to build on the legacy of ESA’s first star-mapping mission, Hipparcos, launched in 1989, to reveal the history of the galaxy in which we live,” says Jean-Jacques Dordain, ESA’s Director General.

Soyuz VS06, with Gaia, lifted off from French Guiana, 19 December 2013. (ESA - S. Corvaja)
Soyuz VS06 with Gaia (ESA – S. Corvaja, 2013)

Repeatedly scanning the sky, Gaia will observe each of the billion stars an average of 70 times each over the five years. (That’s 40 million observations every day!) It will measure the position and key physical properties of each star, including its brightness, temperature and chemical composition.

By taking advantage of the slight change in perspective that occurs as Gaia orbits the Sun during a year, it will measure the stars’ distances and, by watching them patiently over the whole mission, their motions across the sky.

The motions of the stars can be put into “rewind” to learn more about where they came from and how the Milky Way was assembled over billions of years from the merging of smaller galaxies, and into “fast forward” to learn more about its ultimate fate.

“Gaia represents a dream of astronomers throughout history, right back to the pioneering observations of the ancient Greek astronomer Hipparchus, who catalogued the relative positions of around a thousand stars with only naked-eye observations and simple geometry. Over 2,000 years later, Gaia will not only produce an unrivaled stellar census, but along the way has the potential to uncover new asteroids, planets and dying stars.”

– Alvaro Giménez, ESA’s Director of Science and Robotic Exploration

Gaia will make an accurate map of the stars within the Milky Way from its location at L2 (ESA/ATG medialab; background: ESO/S. Brunier)
Gaia will make an accurate map of a billion stars within the Milky Way from its location at L2 (ESA/ATG medialab; background: ESO/S. Brunier)

Of the one billion stars Gaia will observe, 99% have never had their distances measured accurately. The mission will also study 500,000 distant quasars, search for exoplanets and brown dwarfs, and will conduct tests of Einstein’s General Theory of Relativity.

“Along with tens of thousands of other celestial and planetary objects,” said ESA’s Gaia project scientist Timo Prusti, “this vast treasure trove will give us a new view of our cosmic neighbourhood and its history, allowing us to explore the fundamental properties of our Solar System and the Milky Way, and our place in the wider Universe.”

Follow the status of Gaia on the mission blog here.

Source: ESA press release and Gaia fact sheet

Gaia's launch aboard an Arianespace-operated Soyuz on Dec. 19, 2013 from ESA's facility in French Guiana (ESA)
Gaia’s launch aboard an Arianespace-operated Soyuz on Dec. 19, 2013 from ESA’s facility in French Guiana (ESA)

Celestial Laser Show? Nope, These Are Trails Showing Off Star Colors

Star trails above the European Space Observatory's Paranal Observatory in Chile, showing three of the four auxiliary telescopes of the Very Large Telescope Interferometer (VLTI). Credit: ESO/B. Tafreshi

There are so many colorful streaks in that image above that you’d be forgiven for thinking somebody is shooting lasers around the European Southern Observatory (ESO) in Chile. Actually, though, this demonstrates a common technique for astronomy photo-taking where you do a time lapse to watch the stars moving as the Earth makes its daily rotation.

The image of auxiliary telescopes of Very Large Telescope Interferometer is not only pretty, but does have some scientific interest as well, ESO said.

“This technique … enhances the natural colours of the stars, which gives an indication of their temperature, ranging from about 1000 degrees Celsius [1,832 Fahrenheit] for the reddest stars to a few tens of thousands of degrees Celsius [or Fahrenheit] for the hottest, which appear blue. The sky in this remote and high location in Chile is extremely clear and there is no light pollution, offering us this amazing light show,” stated the European Southern Observatory.

According to ESO, these supplementary telescopes working together allow astronomers to “see details up to 25 times finer than with the individual telescopes.” You can read more about the VLTI at this ESO link, which includes some interesting facts — such as why the interferometers are named Antu, Kueyen, Melipal and Yepun.

Source: European Southern Observatory

Watch a Star Blast Out Waves of Light

Hubble image of variable star RS Puppis (NASA, ESA, and the Hubble Heritage Team)

6,500 light-years away in the southern constellation Puppis an enormous star pulses with light and energy, going through the first throes of its death spasms as it depletes its last reserves of hydrogen necessary to maintain a stable, steady radiance. This star, a Cepheid variable named RS Puppis, brightens and dims over a 40-day-long cycle, and newly-released observations with Hubble reveal not only the star but also the echoes of its bright surges as they reflect off the dusty nebula surrounding it.

The image above shows RS Puppis shining brilliantly at the center of its dusty cocoon. (Click the image for a super high-res version.) But wait, there’s more: a video has been made of the variable star’s outbursts as well, and it’s simply mesmerizing. Check it out below:

Assembled from observations made over the course of five weeks in 2010, the video shows RS Puppis pulsing with light, outbursts that are then reflected off the structure of its surrounding nebula. What look like expanding waves of gas are really “light echoes,” radiation striking the densest rings of reflective dust located at farther and farther distances from the star.

According to the NASA image description:

RS Puppis rhythmically brightens and dims over a six-week cycle. It is one of the most luminous in the class of so-called Cepheid variable stars. Its average intrinsic brightness is 15,000 times greater than our sun’s luminosity.

The nebula flickers in brightness as pulses of light from the Cepheid propagate outwards. Hubble took a series of photos of light flashes rippling across the nebula in a phenomenon known as a “light echo.” Even though light travels through space fast enough to span the gap between Earth and the moon in a little over a second, the nebula is so large that reflected light can actually be photographed traversing the nebula. (Source)

RS Puppis is ten times more massive than our Sun, and 200 times larger.

Cepheid variables are more than just fascinating cosmic objects. Their uncanny regularity in brightness allows astronomers to use them as standard candles for measuring distances within our galaxy as well as others — which is trickier than it sounds. Because of its predictable variation along with the echoing light from its surrounding nebula, the distance to RS Puppis (6,500 ly +/- 90) has been able to be calculated pretty accurately, making it an important calibration tool for other such stars. (Read more here.)

Source: ESA news release

Full image credit: NASA, ESA, and the Hubble Heritage Team (STScI/AURA)-Hubble/Europe Collaboration. Acknowledgment: H. Bond (STScI and Penn State University)

P.S.: Cepheid variables don’t last forever, though — sometimes they stop.

When Is a Star Not a Star?

Artist's impression of a Y-dwarf, the coldest known type of brown dwarf star. (NASA/JPL-Caltech)

When it’s a brown dwarf — but where do we draw the line?

Often called “failed stars,” brown dwarfs are curious cosmic creatures. They’re kind of like swollen, super-dense Jupiters, containing huge amounts of matter yet not quite enough to begin fusing hydrogen in their cores. Still, there has to be some sort of specific tipping point, and astronomers (being the scientists that they are) would like to know: when does a brown dwarf stop and a star begin?

Researchers from Georgia State University now have the answer.

From a press release issued Dec. 9 from the National Optical Astronomy Observatory (NOAO):

For most of their lives, stars obey a relationship referred to as the main sequence, a relation between luminosity and temperature – which is also a relationship between luminosity and radius. Stars behave like balloons in the sense that adding material to the star causes its radius to increase: in a star the material is the element hydrogen, rather than air which is added to a balloon. Brown dwarfs, on the other hand, are described by different physical laws (referred to as electron degeneracy pressure) than stars and have the opposite behavior. The inner layers of a brown dwarf work much like a spring mattress: adding additional weight on them causes them to shrink. Therefore brown dwarfs actually decrease in size with increasing mass.

Read more: The Secret Origin Story of Brown Dwarfs

As Dr. Sergio Dieterich, the lead author, explained, “In order to distinguish stars from brown dwarfs we measured the light from each object thought to lie close to the stellar/brown dwarf boundary. We also carefully measured the distances to each object. We could then calculate their temperatures and radii using basic physical laws, and found the location of the smallest objects we observed (see the attached illustration, based on a figure in the publication). We see that radius decreases with decreasing temperature, as expected for stars, until we reach a temperature of about 2100K. There we see a gap with no objects, and then the radius starts to increase with decreasing temperature, as we expect for brown dwarfs. “

Dr. Todd Henry, another author, said: “We can now point to a temperature (2100K), radius (8.7% that of our Sun), and luminosity (1/8000 of the Sun) and say ‘the main sequence ends there’ and we can identify a particular star (with the designation 2MASS J0513-1403) as a representative of the smallest stars.”

The relation between size and temperature at the point where stars end and brown dwarfs begin (based on a figure from the publication) Image credit: P. Marenfeld & NOAO/AURA/NSF.

“We can now point to a temperature (2100K), radius (8.7% that of our Sun), and luminosity (1/8000 of the Sun) and say ‘the main sequence ends there’.”

Dr. Todd Henry, RECONS Director

Aside from answering a fundamental question in stellar astrophysics about the cool end of the main sequence, the discovery has significant implications in the search for life in the universe. Because brown dwarfs cool on a time scale of only millions of years, planets around brown dwarfs are poor candidates for habitability, whereas very low mass stars provide constant warmth and a low ultraviolet radiation environment for billions of years. Knowing the temperature where the stars end and the brown dwarfs begin should help astronomers decide which objects are candidates for hosting habitable planets.

The data came from the SOAR (SOuthern Astrophysical Research) 4.1-m telescope and the SMARTS (Small and Moderate Aperture Research Telescope System) 0.9-m telescope at the Cerro Tololo Inter-American Observatory (CTIO) in Chile.

Read more here.

‘Glowing Wreck Of A Star’ Reveals Cosmic Cannibalism

Composite image of Circinus X-1, which is about 24,000 light-years from Earth in the constellation Circinus. Credit: X-ray: NASA/CXC/Univ. of Wisconsin-Madison/S. Heinz et al; Optical: DSS; Radio:
Composite image of Circinus X-1, which is about 24,000 light-years from Earth in the constellation Circinus. Credit: X-ray: NASA/CXC/Univ. of Wisconsin-Madison/S. Heinz et al; Optical: DSS; Radio: CSIRO/ATNF/ATCA

Circinus X-1 may look like a serene place from a distance, but in reality this gassy nebula is quite a busy spot. Embedded in the nebula is the neutron star that is also a leftover of the supernova that produced the gas. Not only that, but the neutron star is still locked on to a companion and is in fact “cannibalizing” it, astronomers said.

The “glowing wreck of a star”, as the team called it, is exciting because it demonstrates what systems look like in the first stages after an explosion. The nebula is an infant in cosmic terms, with an upper limit to its age of just 4,500 years. To put that in human terms, that’s around the time of the first civilizations (such as in Mesopotamia).

“The fact that we have this remnant along with the neutron star and its companion means we can test all kinds of things,” stated Sebastian Heinz, an astronomy professor at the University of Wisconsin-Madison who led the research.

“Our observations solve a number of puzzles both about this object and the way that neutron stars evolve after they are born. For example, the unusual elliptical orbit on which these two stars swing around each other is exactly what you would expect for a very young X-ray binary.”

X-ray binaries are typically made up of a black hole or a neutron star that is locked on to a “normal” companion star such as that of our sun. That star won’t stay normal forever, however, as it’s being subject to very intense gravity from the black hole or neutron star. Its starstuff is being pulled off, heated, and then emitting radiation in X-rays that are easily trackable across the universe.

While X-ray binaries have been spotted before, seeing one along with a nebula is something special. By comparison, the gas cloud doesn’t stick around for very long — just 100,000 years or so — while the stars can be there for a while longer.

Checking out this star system could not only teach scientists about stellar evolution, but about the nature of neutron stars. One thing puzzling the team right now is why the neutron star has a faint magnetic field, which stands against established theory. Further study will be required to figure out why it isn’t as strong as expected.

Combining observations done with ESO's Very Large Telescope and NASA's Chandra X-ray telescope, astronomers have uncovered the most powerful pair of jets ever seen from a stellar black hole. The black hole blows a huge bubble of hot gas, 1,000 light-years across or twice as large and tens of times more powerful than the other such microquasars. The stellar black hole belongs to a binary system as pictured in this artist's impression.  Credit: ESO/L. Calçada
A binary X-ray system with a black hole (right) and companion star. Credit: ESO/L. Calçada

This high-resolution view from NASA’s Chandra X-Ray Telescope and the Australia Telescope Compact Array, however, has revealed some new things.

“I have been perplexed by the unusually strong evolution of the orbit of Circinus X-1 since my graduate-school days,” stated Niel Brandt, an astronomer at Pennsylvania State University who is on the team. “The discovery now of this system’s youth provides a satisfying explanation for why its orbit evolves so strongly — because the system likely still is settling down after its violent birth.”

You can read more in the Dec. 4 publication in The Astrophysical Journal or, in prepublished form, on Arxiv.

Sources: University of Wisconsin-Madison and Pennsylvania State University

This Spooky X-Ray ‘Hand’ Demonstrates A Pulsar Star Mystery

This X-ray nebula appears to look like a human hand. The ghostly shape comes courtesy of a pulsar star called PSR B1509-58 (B1509 for short) that is just 12 miles or 19 kilometers in diameter. The nebula itself is 150 light-years across. Image taken by NASA's Chandra X-ray Observatory. Credit: NASA/CXC/CfA/P. Slane et al.

That spooky hand in the image above is producing questions for scientists. While the shape only coincidentally looks like a human hand, scientists are still trying to figure out how a small star produced such a large shape visible in X-rays.

Pulsar star PSR B1509-58 (or B1509 for short) is a 12-mile (19-kilometer) remnant of a much larger star that exploded and left behind a quickly spinning neutron star. Energy leaves mostly via neutrino (or neutral particle) emission, with a bit more coming out via beta decay, or a radioactive process where charged particles leave from atoms.

Using a new model, scientists found that so much energy comes out from neutrino emission that there shouldn’t be enough left for the beta decay to set off the X-rays you see here in this image, or in other situations. Yet it’s still happening. And that’s why they’re hoping to take a closer look at the situation.

Artist's conception of a neutron star flare. Credit: University of California Santa Cruz
Artist’s conception of a neutron star flare. Credit: University of California Santa Cruz

“Scientists are intrigued by what exactly powers these massive explosions, and understanding this would yield important insights about the fundamental forces in nature, especially on the astronomical/cosmological scale,” stated Peter Moller, who is with the theoretical division of Los Alamos National Laboratory and participated in the research.

Preliminary studies indicate that to better understand what’s happening on the surface of these objects, computer models must endeavor to “describe the shape of each individual nuclide” (or atom that has a certain number of protons and neutrons in its nucleus). That’s because not all of these nuclides are simple spheres.

Using facilities at Los Alamos, scientists created databases with different types of nuclides that had various beta-decay properties. They then plugged this into a Michigan State University model of neutron stars to see what energy was released as the stars accrete or come together.

Accretion can cause neutron stars to flare violently

The results stood against what was a “common assumption”, the scientists stated, that the radioactive action would be enough to power the X-rays. They urge more study on this front, especially using a proposed Facility for Rare Isotope Beams that would be built at Michigan State, using funding from the U.S. Department of Energy Office of Science. FRIB project participants are hoping that will be ready in the 2020s.

You can read more about the research in the Dec. 1 edition of Nature. It was led by Hendrik Schatz, a professor at the National Superconducting Cyclotron Laboratory at Michigan State.

Source: Los Alamos National Laboratory