NASAs Solar Crown Jewel Bolted atop Atlas Rocket

NASA's Solar Dynamics Observatory is lifted atop the Atlas V rocket. Credit: NASA/Jack Pfaller

[/caption]The “Crown Jewel” of NASA’s solar science research fleet, the Solar Dynamics Observatory, or SDO, was transported from the Astrotech payload processing facility outside KSC to the Vertical Integration Facility (VIF) at Launch Complex 41 in the overnight hours of Jan 26. It’s standard operating procedure to transport such highly valuable payloads after midnight, when the least amount of traffic is on the road in order to minimize any possibility for an accident. This journey was in preparation for connecting to its Atlas rocket. The $848 million spacecraft was moved at about 10 MPH on a specially designed flat bed truck for a trip lasting roughly four hours.

SDO is bolted onto Centaur Upper Stage. Credit: NASA/Jack Pfaller
After daylight broke, the encapsulated SDO was lifted by crane, hoisted 13 stories to the top of the Atlas V rocket and bolted atop the Centaur upper stage previously erected inside the gantry at Cape Canaveral Air Force Station. Interface and aliveness tests of the integrated system to verify electrical connections between SDO and the booster rocket are underway.

The Flight Readiness Review is set for Feb. 5 and pad rollout on Feb. 8. NASA is currently targeting Feb 9 as the launch date with a 1 hour launch window starting at 10:30 AM EST, just 2 days after the scheduled Feb. 7 blast off of Shuttle Endeavour and Tranquility module on the STS 130 mission to the ISS. If STS 130 is delayed, SDO would likewise be delayed on a matching day by day basis. A minimum turnaround time of 48 hours is required to reconfigure all telemetry and tracking systems and hardware on the Air Force Eastern range between launches.

I’ll be reporting from the launch pads for both SDO and STS 130.
Read my earlier preview article on SDO:
NASA advanced Solar Observatory nearing February launch; will send IMAX like movies daily

See a cool new video explaining SDO here:
The Solar Dynamics Observatory in 3.5 Minutes

Learn more at the NASA SDO Website

In the Vertical Integration Facility at Launch Complex 41 on Cape Canaveral Air Force Station, the payload fairing enclosing NASA's Solar Dynamics Observatory, or SDO, has been secured to the Atlas V rocket. SDO is the first mission in NASA's Living With a Star Program. Credit: NASA/Jack Pfaller

The Solar Dynamics Observatory in 3.5 Minutes

This great new video (just uploaded today!) does a great job of explaining the upcoming Solar Dynamics Observatory (SDO) mission, which is slated to launch on Feb. 9, 2010. SDO will provide a new eye on the sun that will deliver solar images with 10 times better resolution than high-definition television. This mission will zoom in on the cause of severe space weather—solar activity such as sunspots, solar flares, and coronal mass ejections. It will give us the best look ever at our Sun.

For more information see our detailed preview article on SDO.

NASA advanced Solar Observatory nearing February launch; will send IMAX like movies daily

SDO and two piece payload fairing inside “clean room” at Astrotech Spaceflight facility near KSC on Jan 21. Fairing protects spacecraft during ascent through earths atmosphere. Credit: Ben Cooper/Spaceflight Now

[/caption]

NASA’s new solar science satellite, dubbed the Solar Dynamics Observatory, or SDO, moved an important step closer to launch when it was encapsulated inside its two piece payload fairing on Thursday (Jan 21) at the Astrotech Space Operations Facility nearby to the Kennedy Space Center (KSC). SDO is the most sophisticated spacecraft ever designed and constructed to study the sun and its dynamic behavior.

Liftoff of SDO aboard an Atlas V rocket from Cape Canaveral Air Force Station is targeted for Feb 9, just 2 days after the shuttle Endeavour blasts off with the Tranquility module and heads for the ISS.

“SDO will revolutionize our view of the sun. It will reveal how solar activity affects our planet and help us anticipate what lies ahead”, said Madhulika Guhathakurta at a Jan 21 press briefing. She is the SDO program scientist at NASA Headquarters.

The enclosed observatory will be transported on a specially designed trailer to Launch Complex 41 on Tuesday (Jan. 26) and then be hoisted up and bolted atop the two stage booster rocket. The 19 story tall Atlas V will propel the 8,800 pound spacecraft into an inclined geosynchronous orbit where it will study the sun in multiple wavelengths during its 5 year primary mission. It carries sufficient fuel to operate for another 5 years.

An Atlas rocket similar to this vehicle I observed at Cape Canaveral Pad 41 will launch SDO. Credit: Ken Kremer
SDO arrived at KSC on July 9 for final processing, testing and fueling operations. It was shipped from NASA’s Goddard Space flight Center where it was built by teams of technicians, engineers and scientists at a cost of $848 million.

SDO is the first spacecraft to be launched as part of NASA’s Living with a Star (LWS) science program initiative. The goal is to better understand the causes of solar variability and to create better forecasts for predicting “space weather” which directly affects the Earth and all life inhabiting it. Furthermore, this information will be used to help protect and provide early warning to valuable satellites operating in space as well as astronaut crews working aboard the International Space Station.

When active regions on the sun erupt suddenly and violently in the form of a solar flare or coronal mass ejection (CME), they hurl millions of tons of solar material and charged particles toward Earth which can damage orbiting satellites, disrupt navigation systems and cause failures in the power grid.

SDO is equipped with 3 science instruments which will measure and characterize in-depth the Suns interior and atmosphere, magnetic field, hot plasma of the solar corona and the density of the radiation that creates the ionosphere of the planets.

SDO will collect huge volumes of data which amount to a staggering 1.5 terabytes per day. This is the equivalent of downloading a half million songs each day or filling a CD every 36 seconds. “That’s almost 50 times more science data than any other mission in NASA history”, says Dean Pesnell, the SDO project scientist at NASA Goddard.

SDO is enclosed in its payload fairing and ready for transport on Jan 26 to Atlas V launch pad. Credit: NASA/Jim Grossman
“SDO is going to send us images ten times better than high definition television” according to Pesnell. “The pixel count is comparable to an IMAX movie — an IMAX filled with the raging sun, 24 hours a day.”

“We’ll be getting IMAX-quality images every 10 seconds,” says Pesnell. “We’ll see every nuance of solar activity.” Because no orbiting spacecraft has ever come even close to this incredible speed, there is a vast potential for ground breaking science discoveries. Scientists hope to learn how storms are generated inside the sun and how they then evolve and propagate outwards through the suns atmosphere and towards earth and the rest of the solar system.

Since SDO has no on-board recording system, the data will be transmitted continuously on a 24/7 basis to dedicated receiving stations on the ground in New Mexico as it maintains position over 22,000 miles high above earths equator.

I will be reporting on site from the Kennedy Space Center in February and directly from the launch pads for both SDO and STS 130. See my earlier STS 130 reports here.

NASA SDO Website

Cluster Satellite Detects Rifts in Earth’s Magnetic Field

Illustration of solar wind impact on Earth's magnetosphere Copyright: NASA

[/caption]

While Earth’s magnetic field protects our planet from most of the permanent flow of particles from the solar wind, rifts or fissures in natural shield are known to occur, enabling the solar wind to penetrate our near-space environment. An ESA satellite cluster called, appropriately, Cluster has provided new insight into the location and duration of these ruptures in the Earth’s magnetic shield, and reveals while our atmosphere protects us for the most part, clear effects of these rifts have been detected high in the upper atmosphere and in the region of space around Earth where satellites orbit.

This study reports the observation of fissures on the Sun-facing side of the Earth’s magnetic shield – the dayside magnetopause. Fortunately, these fissures don’t expose Earth’s surface to the solar wind; our atmosphere protects us. But the upper atmosphere is affected. ,

clear effects have been detected high in the upper atmosphere and in the region of space around Earth where satellites orbit. Credit: ESA

The dominant physical process causing these cracks is known as magnetic reconnection, a process whereby magnetic field lines from different magnetic domains collide and reconnect: opening the closed magnetic shield. Magnetic reconnection is a physical process at work throughout the Universe, from star formation to solar explosions to experimental fusion reactors on Earth. However, the conditions under which it occurs and how long it lasts remain unclear.

What is known is that magnetic reconnection leads to the mixing of previously separated plasmas when, for instance, the solar wind plasma enters the magnetosphere. In this instance the two magnetic domains are the Earth’s internal magnetic field, and the interplanetary magnetic field (IMF). (The solar wind is not only composed of solar particles (mostly protons and electrons), it also carries the Sun’s magnetic field. Out among the planets, this field is the IMF.)

For more than 700,000 years, the South to North orientation of the terrestrial magnetic field has been rather steady. In contrast, the IMF orientation is highly variable, with total inversion frequently observed on times-scales of minutes.

Reconnection between the IMF and the Earth’s magnetic field critically depends on the angle between these fields. Space physicists have made a distinction between reconnection when both fields are in opposite directions, or anti-parallel, and component reconnection, when the IMF is neither parallel nor anti-parallel to the terrestrial magnetic field. The distinction is important since component and anti-parallel reconnection have different onset characteristics and lead to different duration of the fissures in the magnetic shield. The distinction between these two types of magnetic reconnection has been the subject of hot debate among space scientists for many years.

The position, on 25 February 2005, of the Cluster satellite constellation and the Double Star TC-1 satellite with respect to the magnetopause. Blue lines represent magnetic field lines related to the Earth's magnetic field. Spacecraft configurations are scaled by a factor of 5.

For the first time, four spacecraft flying in constellation (the ESA Cluster mission), have provided unambiguous evidence of anti-parallel reconnection at high latitude on the dayside magnetopause, occurring quasi-simultaneously with a period of low-latitude component reconnection detected by the Sino-European Double Star TC-1 satellite. TC-1 and the Cluster array (with the Cluster spacecraft separated by ~2000 km) are more than 30,000 km apart (see below.) The 3D reconnection picture, determined by repeated sampling of the ion diffusion region and associated magnetic null fields (i.e. the heart of the reconnection process). 2.

“These observations support the idea that both anti-parallel and component reconnection occur at the dayside magnetopause under the same IMF conditions and that both phenomena might be the local signatures of a global reconnection picture”, says Professor Malcolm Dunlop from the Rutherford Appleton Laboratory, Didcot, UK.

“This remarkable set of observations shows that magnetic reconnection at the magnetopause is not as simple as it is described in textbooks! It also demonstrates the need for the capability to study magnetic reconnection at multiple scales simultaneously”, says Matt Taylor, acting Cluster project scientist at the European Space Agency.

Source: ESA

Solar Flares Can Now Be Predicted More Accurately

An eruption on the Sun. Credit: NASA

[/caption]
We all like to know in advance what the weather is going to be like, and space weather is no different. However, predicting solar storms from the sun — which can disrupt satellites and even ground-based technologies — has been difficult. But now scientists say magnetic loops breaking inside the sun provide two to three-day warnings of solar flares. “For the first time, we can tell two to three days in advance when and where a solar flare will occur and how large it will be,” said Alysha Reinard, from the NOAA Space Weather Prediction Center.

Reinard and her team found that sound waves recorded from more than 1,000 sunspot regions reveal disruptions in the sun’s interior magnetic loops that predict a solar flare. They found the same pattern in region after region: magnetic twisting that tightened to the breaking point, burst into a large flare, and vanished. They established that the pattern could be used as a reliable tool for predicting a solar flare.

“These recurring motions of the magnetic field, playing out unseen beneath the solar surface, are the clue we’ve needed to know that a large flare is coming—and when,” said Reinard.

Twisting magnetic fields beneath the surface of the sun erupt into a large solar flare, as shown above. Credit: NOAA

The new technique is already twice as accurate as current methods, according to the authors, and that number is expected to improve as they refine their work over the next few years. With this technique, reliable watches and warnings should be possible before the next solar sunspot maximum, predicted to occur in 2013.
“Two or three days lead time can make the difference between safeguarding the advanced technologies we depend on every day for our livelihood and security, and the catastrophic loss of these capabilities and trillions of dollars in disrupted commerce,” said Thomas Bogdan, director of NOAA’s Space Weather Prediction Center.

The team’s paper has been accepted for publication by the Astrophysical Journal Letters.

Source: NOAA

Eclipse Sunspots Signal Increased Activity

Sun sunspots show up during the recent annular eclipse. Credit: Shehal Joseph and Romayne Anthony

[/caption]

Astrophotographers capturing the recent annular solar eclipse on January 15, 2010 got an added bonus: upon closer inspection, they found sunspot 1040 also showed up on their images, too. “We didn’t mean to catch sunspots in our Jaffna Eclipse expedition, nor did we plan to,” said Prasanna Deshapriya, one of the members of the Eclipse Hunt 2010 crew, featured in our eclipse photo and video collection. “But surprisingly this is what really happened.”

SOHO image of sunspot 1040 on January 15, 2010. credit: SOHO/MDI

The rather big sunspot 1040, which was also captured by the SOHO spacecraft on Jan. 15 has just disappeared over the sun’s western limb, currently leaving the visible disk of the sun blank once again in this uncharacteristically long solar minimum. But our old friend, sunspot 1039 should be showing up soon, as the sun rotates around. We know it is still there, because the STEREO spacecraft can show us what is going on the sun’s far side. Sunspot 1039 should emerge for direct viewing from Earth within the next 48 hours. Spaceweather.com encourages those amateur astronomers with solar telescopes to monitor the Sun’s east limb for developments.

STEREO B captures the largest solar flare in two years. Click for larger movie.

Additionally on Jan. 19th at 1340 UT, STEREO-B recorded the strongest solar flare in almost two years. Click the image to see the action on an ultraviolet movie of the blast. The M2-class eruption came from sunspot 1039, so that sunspot is likely still very active.

Spaceweather.com said that considering the sunspot was not even visible from Earth at the time of the eruption, the flare was probably much stronger than its M2 classification would suggest. This active region has produced at least three significant eruptions since Jan. 17th and it shows no signs of cooling off.

Sources: Eclipse 2010 blog, Spaceweather.com from 01/19/2010 , Kanabona.com

Unprecedented Images Show Betelgeuse Has Sunspots

Caption:The surface of Betelgeuse in near infrared at 1.64 micron in wavelength, obtained with the IOTA interferometer (Arizona). The image has been re-constructed with two different algorithms, which yield the same details, of 9 milliarcseconds (mas). The star diameter is about 45 milliarcseconds. Credit: Copyright 2010 Haubois / Perrin (LESIA, Observatoire de Paris)

An international team of astronomers has obtained an unprecedented image of the surface of the red supergiant Betelgeuse, in the constellation Orion. The image reveals the presence of two giant bright spots, which cover a large fraction of the surface. Their size is equivalent to the Earth-Sun distance. This observation provides the first strong and direct indication of the presence of the convection phenomenon, transport of heat by moving matter, in a star other than the Sun. This result provides a better understanding of the structure and evolution of supergiants.

Betelgeuse is a red supergiant located in the constellation of Orion, and is quite different from our Sun. First, it is a huge star. If it were the center of our Solar System it would extend to the orbit of Jupiter. At 600 times larger than our Sun, it radiates approximately 100,000 times more energy. Additionally, with an age of only a few million years, the Betelgeuse star is already nearing the end of its life and is soon doomed to explode as a supernova. When it does, the supernova should be seen easily from Earth, even in broad daylight.

But we now know Betelgeuse has some similarities to the Sun, as it also has sunspots. The surface has bright and dark spots, which are actually regions that are hot and cold spots on the star. The spots appear due to convection, i.e., the transport of heat by matter currents. This phenomenon is observed every day in boiling water. On the surface of the Sun, these spots are rather well-known and visible. However, it is not at all the case for other stars and in particular supergiants. The size, physical characteristics, and lifetime of these dynamical structures remain unknown.

Betelgeuse is a good target for interferometry because its size and brightness make it easier to observe. Using simultaneously the three telescopes of the Infrared Optical Telescope Array (IOTA) interferometer on Mount Hopkins in Arizona (since removed), and the Paris Observatory (LESIA) the astronomers were able to obtain a numerous high-precision measurements. These made it possible to reconstruct an image of the star surface thanks to two algorithms and computer programs.

Two different algorithms gave the same image. One was created by Eric Thiebaut from the Astronomical Research Center of Lyon (CRAL) and the other was developed by Laurent Mugnier and Serge Meimon from ONERA. The final image reveals the star surface with unprecedented, never-before-seen details. Two bright spots clearly show up next to the center of the star.

The analysis of the brightness of the spots shows a variation of 500 degrees compared to the average temperature of the star (3,600 Kelvin). The largest of the two structures has a dimension equivalent
to the quarter of the star diameter (or one and a half the Earth-Sun distance). This marks a clear difference with the Sun where the convection cells are much finer and reach hardly 1/20th of the solar radius (a few Earth radii). These characteristics are compatible with the idea of luminous spots produced by convection. These results constitute a first strong and direct indication of the presence of convection on the surface of a star other than the Sun.

Convection could play an important role in the explanation of the mass-loss phenomenon and in the gigantic plume of gas that is expelled from Betelgeuse. The latter has been discovered by a team led by Pierre Kervella from Paris Observatory (read our article about this discovery). Convection cells are potentially at the origin of the hot gas ejections.

The astronomers say this new discovery provides new insights into supergiant stars, opening up a new field of research.

Sources: Abstract: arXiv, Paper: “Imaging the spotty surface of Betelgeuse in the H band,” 2009, A&A, 508, 923″. Paris Observatory

Measuring the Coronal Temperature with Iron

This image of the solar corona contains a color overlay of the emission from highly ionized iron lines and white light taken of the 2008 eclipse. Red indicates iron line Fe XI 789.2 nm, blue represents iron line Fe XIII 1074.7 nm, and green shows iron line Fe XIV 530.3 nm. This is the first such map of the 2-D distribution of coronal electron temperature and ion charge state. Credit: Habbal, et al.

Astronomers presenting at this week’s AAS conference have reported on new research measuring the temperature of the solar corona. The work combines observations of the Sun’s outer reaches from observations during total solar eclipses in 2006, 2008, and 2009. It utilized mapping of various abundances of ionized iron to build a two dimensional temperature map.

Although many introductory science classes paint temperature as a fixed number, in reality, it’s the average of a range of temperatures which is a way of quantifying the kinetic energy of the particles in question. Individual particles may be hotter (higher kinetic energy) while others may be cooler (lower kinetic energy). As these atoms move around, they can collide and these collisions will knock off electrons causing the atoms to become ionized. The degree of ionization will be indicative of just how energetic the collision was.

Those ionized atoms can then be identified spectroscopically or by using a filter to search for the wavelength at which those atoms will emit light as new electrons settle down into the previously vacated orbitals. By measuring the relative amounts of ionization astronomers can then reconstruct the range of kinetic energies in the gas and thus, temperature range which can, in turn, be used to determine the average temperature.

This is the method an international team of astronomers used to study the sun’s corona. Since light atoms don’t work well for this method (they become fully ionized or just can’t show a large range of ionization like atoms with more electrons), the astronomers chose to study the Sun’s corona through various states of iron ionization. In doing so they mapped several ionization states, including capturing for the first time, the elusive Fe IX lines (iron with 8 electrons knocked off) at 789.2 nm.

One interesting finding was that the region of emission extended to three solar radii (or 1.5 times the diameter). After this distance, the collision rate drops off and can no longer cause the ionization of atoms (however, radiative processes caused by photons from the sun can still ionize the atoms, but this is no longer indicative of the temperature of the atoms). This was further than originally anticipated.

Another result of their work showed that there is a strong correspondence between the amounts of various ions coming from the sun and that same ratio in interplanetary space as measured by the SWICS on the Advanced Composition Explorer. This connection will better help astronomers understand the working of our Sun as well as how its emissions may impact the Earth.

The full results of this work are to be published in the January 10 issue of the Astrophysical Journal.

Solar Activity is Picking Up

The current solar cycle (24) has been pretty boring, but a new sunspot — 1035 — is growing rapidly and now is seven times wider than Earth. Solar astronomers are predicting it could grow to be the largest sunspot of the year. There’s not been a lot of competition for the biggest sunspot, though: for 259 days (or 74%) of 2009, the sun has been spotless. But maybe the (solar) tide is turning. There’s been other action recently besides the new sunspot. A long-duration C4-class solar flare erupted this morning at 0120 UT from around the sunspot, which hurled a coronal mass ejection (CME) towards Earth. (See below for image of the CME that blasted off the sun on Dec. 14) Observers at high-latitude could see some aurora action when the CME arrives on or about Dec. 18th. Keep cheering; maybe the sun will come out of its doldrums.

CME on Dec. 14, 2009.  Credit: NASA, SoHO
CME on Dec. 14, 2009. Credit: NASA, SoHO

Remember, don’t look at the Sun directly to try and see the sunspot. NASA has a great site that gives real-time data and updated images of the Sun from SoHO (Solar and Heliospheric Observatory.) Or check out Spaceweather.com, which also provides updates. And if you have a safe way of observing and imaging the sunspot, feel free to post images here, or send to Nancy.

Comets Posing as Asteroids (or is the the other way around?)

Images of known MBCs from UH 2.2-meter telescope data. Credit: Henry Hsieh

[/caption]

Asteroids are rocky bodies which belong between Mars and Jupiter. Comets are icy bodies that belong way out beyond Pluto. So what are comet-like objects doing in the asteroid belt?

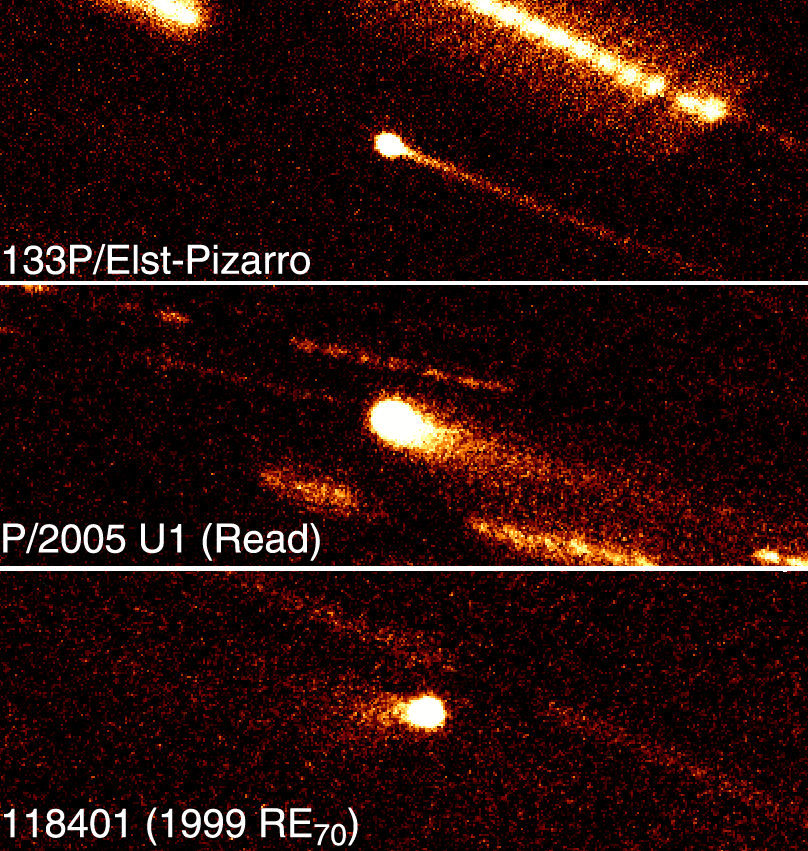
On the night of August 7, 1996, astronomers Eric Elst and Guido Pizarro were observing what was previously thought to be an ordinary asteroid. To their surprise, the object revealed a faint but distinct tail similar to that of a comet. Initially, this was written off as a minor impact kicking up a debris cloud, but when the tail returned in 2002, when the supposed asteroid again returned to perihelion (the closest approach to the Sun), it once again displayed a tenuous tail. The “asteroid” was then given the designation of 133P/Elst-Pizarro. In 2005, two new asteroids were discovered to sport tails: P/2005 U1 and 118401. In 2008, yet another one of these odd objects was found (P/2008 R1). This new class of objects has been dubbed “Main Belt Comets (MBCs)”.

So where are these objects coming from?

A previous article here on Universe Today explored the possibility that these objects formed like other asteroids in the main belt. After all, each of the objects has an orbit consistent with other apparently normal asteroids. They have a similar distance at with they orbit the Sun, as well as similar eccentricities and inclinations of their orbit. So trying to explain these objects as having origins in the outer solar system that migrated just right into the asteroid belt seemed like little more than special pleading.

Furthermore, a 2008 study by Schorghofer at the University of Hawaii predicted that, if such an icy body were to form, it would be able to avoid sublimation for several billion years if only it were covered with a few meters of dust and dirt thus negating the problems of these objects suffering an early death. (Keep in mind that, much like a melting snowball, the water will evaporate but the dirt won’t, so the dirt will pile up quickly on the surface making this entirely plausible!) However, if the ice were covered by such an amount of dust, it would take a collision to remove the dust and trigger the cometary appearance.

In a recent paper, Nader Haghighipour also at the University of Hawaii explores the viability of collisions to trigger this activation as well as the stability of the orbits of these objects to assess the expectation that they were formed at the same time as other asteroids in the main belt.

For the orbital range in which three of the MBCs lie, it was predicted that “on average, one m[eter]-sized object collides … every 40,000 years.” They stress this is an upper limit since their simulation did not include other, nearby asteroids which would likely deplete the number of available impactors.

When they explored the orbital stability of these objects, the discovered at least two of them were dynamically unstable and would eventually be ejected from their orbits on a timescale of 20 million years. As such, it would be unreasonable to expect such objects to have lasted for the nearly 5 billion year history of the solar system. Thus, an in-situ formation was ruled out. However, due to a similarity in orbital characteristics to a family of asteroids known as the Themis family, suggesting they may have resulted from the same break up of a larger body that created this group. This begs the question of whether or not more of these asteroids are secretly hiding water ice reservoirs and are just waiting for an impact to expose them.

Distinctly separate from this orbital family was P/2008 R1 which exists in an especially unstable orbit near one of the resonances from Jupiter. This suggests that this MBC was likely scattered to its present location, but from where remains to be determined.

So while such Main Belt Comets may not have formed simply as they are now, they are likely to be in orbits not far removed from their original formation. Also, this work supported the earlier notion that minor impacts could reliably expected to expose ice allowing for the cometary tails. Whether or not more asteroids have tails tucked between their legs will be the target of future exploration.

Haghighipour’s Paper