SOHO Can See Right Through the Sun

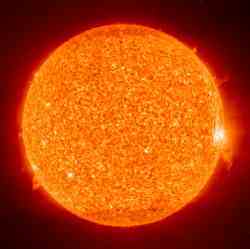
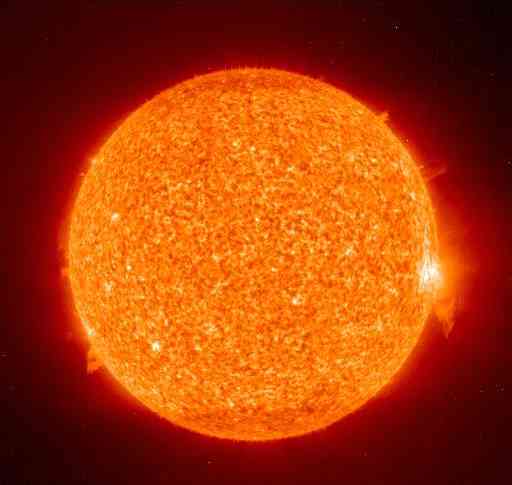
The Sun. Image credit: NASA/ESA Click to enlarge
NASA researchers have developed a technique that allows them to look right through the Sun to see what’s happening on the other side. The Solar and Heliospheric Observatory (SOHO) can trace the sound waves caused by active regions on the opposite side of the Sun. This technique allows the researchers to be more prepared when large sunspots rotate around to face the Earth, and better predict active space weather.

NASA researchers using the Solar and Heliospheric Observatory (SOHO) spacecraft have developed a method of seeing through the sun to the star’s far side. The sun’s far side faces away from the Earth, so it is not directly observable by traditional techniques.

“This new method allows more reliable advance warning of magnetic storms brewing on the far side that could rotate with the sun and threaten the Earth,” said NASA-supported scientist Phil Scherrer of Stanford University, Stanford, Calif.

Magnetic storms resulting from violent solar activity disrupt satellites, radio communications, power grids and other technological systems on Earth. Advance warning can help planners prepare for operational disruptions. The sun rotates once every 27 days, as seen from Earth, and this means the evolution of active regions on the far side of the sun previously has not been detectable.

Many of these storms originate in groups of sunspots, or active regions – areas with high concentration of magnetic fields. Active regions situated on the near side of the sun, the one facing the Earth, can be observed directly. However, traditional methods provided no information about active regions developing on the other side of the sun. Knowing whether there are large active regions on the opposite side of the sun may greatly improve forecast of potential magnetic storms.

The new observation method uses SOHO’s Michelson Doppler Imager (MDI) instrument to trace sound waves reverberating through the sun to build a picture of the far side.

The sun is filled with many kinds of sound waves caused by the convective (boiling) motion of gas in its surface layers. The far side imaging method compares the sound waves that emanate from each small region on the far side with what was expected to arrive at that small region from waves that originated on the front side. An active region reveals itself because its strong magnetic fields speed up the sound waves. The difference becomes evident when sound waves originating from the front side and from the back side get out of step with one another.

“The original far-side imaging method only allowed us to see the central regions, about one-quarter to one-third of its total area,” Scherrer said. “The new method allows us to see the entire far side, including the poles.” Scherrer started an effort to use the new method to create full far-side images from archived MDI data collected since 1996. The project was completed in December 2005.

Douglas Biesecker of the National Oceanic and Atmospheric Administration’s Space Environment Center, Boulder, Colo., said, “With the new far side photo album going back to 1996, we can discover identifying characteristics of active regions. This will improve our ability to distinguish real active regions.”

SOHO is a cooperative project between the European Space Agency and NASA. For SOHO information and images on the Web, visit:
www.nasa.gov/vision/universe/solarsystem/soho_xray.html

Original Source: NASA News Release

Solar Minimum Doesn’t Mean a Calm Sun

A huge solar explosion in 2001. Image credit: SOHO. Click to enlarge.
There’s a myth about the sun. Teachers teach it. Astronomers repeat it. NASA mission planners are mindful of it.

Every 11 years solar activity surges. Sunspots pepper the sun; they explode; massive clouds of gas known as “CMEs” hurtle through the solar system. Earth gets hit with X-rays and protons and knots of magnetism. This is called solar maximum.

There’s nothing mythical about “Solar Max.” During the most recent episode in 2000 and 2001, sky watchers saw auroras as far south as Mexico and Florida; astronomers marveled at the huge sunspots; satellite operators and power companies struggled with outages.

Now the sun is approaching the opposite extreme of its activity cycle, solar minimum, due in 2006. We can relax because, around solar minimum, the sun is quiet. Right?

“That’s the myth,” says solar physicist David Hathaway of the NASA Marshall Space Flight Center. The truth is, solar activity never stops, “not even during solar minimum.”

To show that this is so, Hathaway counted the number of X-class solar flares each month during the last three solar cycles, a period spanning 1970 to the present. X-flares are the most powerful kind of solar explosions; they’re associated with bright auroras and intense radiation storms. “There was at least one X-flare during each of the last three solar minima,” says Hathaway.

This means astronauts traveling through the solar system, far from the protection of Earth’s atmosphere and magnetic field, can’t drop their guard–ever.

Recent events bear this out: Rewind to January 10, 2005. It’s four years since solar maximum and the sun is almost blank–only two tiny sunspots are visible from Earth. The sun is quiet.

The next day, with stunning rapidity, everything changes. On January 11th, a new ‘spot appears. At first no more than a speck, it quickly blossoms into a giant almost as big as the planet Jupiter. “It happened so quickly,” recalls Hathaway. “People were asking me if they should be alarmed.”

Between January 15th and 20th, the sunspot unleashed two X-class solar flares, sparked auroras as far south as Arizona in the United States, and peppered the Moon with high-energy protons. Lunar astronauts caught outdoors, had there been any, would’ve likely gotten sick.

So much for the quiet sun.

It almost happened again last month. On April 25, 2005, small sunspot emerged and–d?j? vu–it grew many times wider than Earth in only 48 hours. This time, however, there were no eruptions.

Why not? No one knows.

Sunspots are devilishly unpredictable. They’re made of magnetic fields poking up through the surface of the sun. Electrical currents deep inside our star drag these fields around, causing them to twist and tangle until they become unstable and explode. Solar flares and CMEs are by-products of the blast. The process is hard to forecast because the underlying currents are hidden from view. Sometimes sunspots explode, sometimes they don’t. Weather forecasting on Earth was about this good … 50 years ago.

Researchers like Hathaway study sunspots and their magnetic fields, hoping to improve the woeful situation. “We’re making progress,” he says.

Good thing. Predicting solar activity is more important than ever. Not only do we depend increasingly on sun-sensitive technologies like cell phones and GPS, but also NASA plans to send people back to the Moon and then on to Mars. Astronauts will be “out there” during solar maximum, solar minimum and all times in between.

Will the sun be quiet when it’s supposed to be? Don’t count on it.

Original Source: Science@NASA Article

More Sunlight is Hitting the Earth

Global map of brightness increases. Yellow represents an increase, brown is decreasing. Image credit: PNL. Click to enlarge.
Earth’s surface has been getting brighter for more than a decade, a reversal from a dimming trend that may accelerate warming at the surface and unmask the full effect of greenhouse warming, according to an exhaustive new study of the solar energy that reaches land.

Ever since a report in the late 1980s uncovered a 4 to 6 percent decline of sunlight reaching the planet’s surface over 30 years since 1960, atmospheric scientists have been trying out theories about why this would be and how it would relate to the greenhouse effect, the warming caused by the buildup of carbon dioxide and other gasses that trap heat in the atmosphere.

Meanwhile, a group led by Martin Wild at the Swiss Federal Institute of Technology in Zurich, home of the international Baseline Surface Radiation Network (BSRN) archive, had gone to work collecting surface measurements and crunching numbers.

“BSRN didn’t get started until the early ’90s and worked hard to update the earlier archive,” said Charles N. Long, senior scientist at the Department of Energy’s Pacific Northwest National Laboratory and co-author of a BSRN report in this week’s issue (Friday, May 6) of the journal Science.

“When we looked at the more recent data, lo and behold, the trend went the other way,” said Long, who conducted the work under the auspices of DOE’s Atmospheric Radiation Measurement (ARM) program.

Data analysis capabilities developed by ARM research were crucial in the study, which reveals the planet’s surface has brightened by about 4 percent the past decade. The brightening trend is corroborated by other data, including satellite analyses that are the subject of another paper in this week’s Science.

Sunlight that isn’t absorbed or reflected by clouds as it plunges earthward will heat the surface. Because the atmosphere includes greenhouse gasses, solar warming and greenhouse warming are related.

“The atmosphere is heated from the bottom up, and more solar energy at the surface means we might finally see the increases in temperature that we expected to see with global greenhouse warming,” Long said.

In fact, he said, many believe that we have already been seeing those effects in our most temperature-sensitive climates, with the melting of polar ice and high altitude glaciers.

The report’s authors stopped short of attributing a cause to the cycle of surface dimming and brightening, but listed such suspects as changes in the number and composition of aerosols?liquid and solid particles suspended in air?and how aerosols affect the character of clouds. Over the past decade, the ARM program has built a network of instrumentation sites to sample cloud characteristics and energy transfer in a variety of climates, from tropical to polar.

“The continuous, sophisticated data from these sites will be crucial for determining the causes,” Long said.

Long also pointed out that 70 percent of the planet’s surface is ocean, for which we have no long-term surface brightening or dimming measurements.

PNNL (www.pnl.gov) is a DOE Office of Science laboratory that solves complex problems in energy, national security, the environment and life sciences by advancing the understanding of physics, chemistry, biology and computation. PNNL employs more than 4,000 staff, has a $650 million annual budget, and has been managed by Ohio-based Battelle since the lab’s inception in 1965.

Original Source: PNL News Release

SOHO Sees a Huge Prominence on the Sun

Image credit: SOHO
On Friday, 12 March 2004, the Sun ejected a spectacular ‘eruptive prominence’ into the heliosphere. SOHO, the ESA/NASA solar watchdog observatory, faithfully recorded the event.

This ‘eruptive prominence’ is a mass of relatively cool plasma, or ionised gas. We say ‘relatively’ cool, because the plasma observed by the Extreme-ultraviolet Imaging Telescope (EIT) on board SOHO was only about 80 000 degrees Celsius, compared to the plasma at one or two million degrees Celsius surrounding it in the Sun’s tenuous outer atmosphere, or ‘corona’.

At the time of this snapshot, the eruptive prominence seen at top right was over 700 000 kilometres across – over fifty times Earth’s diameter – and was moving at a speed of over 75 000 kilometres per hour.

Eruptive prominences of this size are associated with coronal mass ejections (CMEs), and the combination of CMEs and prominences can affect Earth’s magnetosphere when directed toward our planet. In this case, the eruptive prominence and associated CME were directed away from Earth.

SOHO is a mission of international co-operation between ESA and NASA, launched in December 1995. Every day SOHO sends thrilling images from which research scientists learn about the Sun’s nature and behaviour. Experts around the world use SOHO images and data to help them predict ‘space weather’ events affecting our planet.

Original Source: ESA News Release