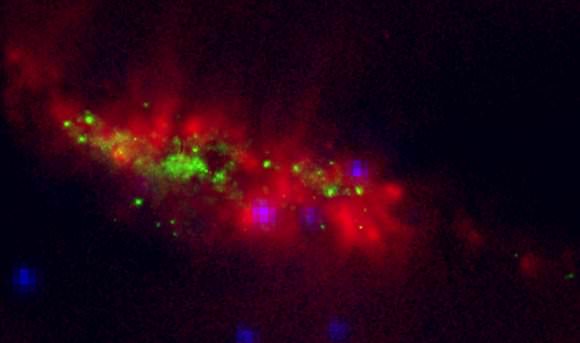
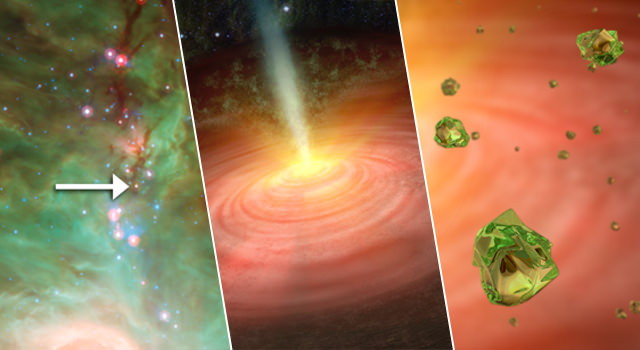
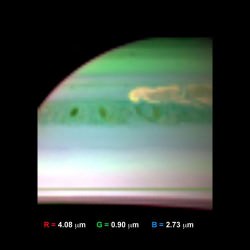
Through The Eyes of WISE… Galaxies Seen In A New Light

Galaxy Shapes
Image credit: NASA/JPL-Caltech/UCLA

[/caption]

NASA’s Wide-field Infrared Survey Explorer (WISE) just released a new series of galactic images – allowing us just a hint at the amazing, and colorful, things to come. Release data products include an Atlas of 10,464 calibrated, co-added Image Sets and a Source Catalog containing positional and photometric information for over 257 million objects detected on the WISE images. Out of all this data, the mission plans to release a thousand images and possibly more…

“Galaxies come in all sorts of delicious flavors,” said Tom Jarrett, a WISE team member at the Infrared Processing and Analysis Center, California Institute of Technology, in Pasadena, who studies our Milky Way’s neighboring galaxies. “Our first sample shows what WISE is capable of. We can produce spectacular high-resolution images of the largest galaxies.”

Images taken in infrared light have been transformed into colors we can understand and relate to. Short wavelengths appear as blue and the longest are red. By token, aging stars appear blue, while clusters of newly formed stars take on yellow or reddish hues. This newly released image gives us a great sampler of all galaxy types – from elegant to disturbed. Because they are “close to home”, these particular galactic images taken through the eyes of WISE will allow us further insight as to their formation and evolution.

“We can learn about a galaxy’s stars — where are they forming and how fast?” said Jarrett. “There’s so much diversity in galaxies to explore.”

WISE, which launched into space in Dec. 2009, has been a busy project. Scanning the whole sky one-and-a-half times in infrared light, the mission has captured images as close as asteroids in our own solar system and distant galaxies billions of light-years away. The first data set, which ironically doesn’t include all of the galaxies in the new collage, was released to the public in April of this year. The complete WISE catalog will follow a year later, in the spring of 2012.

Says NASA; “The most distant objects that will stand out like ripe cherries in WISE’s view are tremendously energetic galaxies. Called ultraluminous infrared galaxies, or ULIRGs, these objects shine with the light of up to a trillion suns. They crowd the distant universe, but appear virtually absent in visible-light surveys. WISE should find millions of ultra-luminous infrared galaxies, and the most luminous of these could be the most luminous galaxy in the Universe.”

Source: Berkeley U.

From 2MASS To You… The Most Complete 3-D Map of Local Universe

Credit: T.H. Jarrett (IPAC/SSC)

[/caption]

Isn’t this era of astronomy incredible? There are times when I thumb through my old astronomy books with their outdated information and simply marvel over today’s capabilities. Who would have believed just 50 years ago that we’d be peering into the far reaches of our Universe – let alone mapping them? Thanks to an endeavor that took more than 10 years to complete, the 2MASS Redshift Survey (2MRS) has provided us with 3-D map which cuts through the dust and pushes the envelope of the Galactic Plane out to 380 million light-years – encompassing more than 500 million stars and resolving more than 1.5 million galaxies.

With our current understanding of expansion, we accept a distant galaxy’s light is stretched into longer wavelengths – or redshifted. By default, this means the further a galaxy is away, the greater the redshift will be. This then becomes a critical factor in producing a three-dimensional point in mapping. To cut through the layers of obscuring dust, the original Two-Micron All-SkySurvey (2MASS) visualized the entire visible sky in three near-infrared wavelength bands. While it gave us an incredible look at what’s out there, it lacked a critical factor… distance. Fortunately, some of the galaxies logged by 2MASS had known redshifts, and thus began the intense “homework” of measurements in the late 1990s using mainly two telescopes: one at the Fred Lawrence Whipple Observatory on Mt. Hopkins, AZ, and one at the Cerro Tololo Inter-American Observatory in Chile.

“Our understanding of the origin and evolution of the Universe has been fundamentally transformed with seminal redshift, distant supernovae and cosmic microwave background surveys. The focus has shifted to the distribution and nature of dark matter and dark energy that drive the dynamics of the expanding cosmos.” says team member, Thomas Jarrett. “The study of the local Universe, including its peculiar motions and its clustering on scales exceeding 100 Mpc, is an essential ingredient in the connection between the origin of structure in the early Universe and the subsequent formation of galaxies and their evolution to the state we observe today. Key issues include the location and velocity distribution of galaxies, leading to the mass-to-light relationship between what is observed and what is influencing the mass density field.”

What makes this work so impressive? The 2MRS has logged what’s been previously hidden behind our Milky Way – allowing us to comprehend the impact they have on our motion. From the time astronomers first measured our movement relative to the rest of the Universe and realized it couldn’t be explained by the gravitational attraction from any visible matter, it became a huge jigsaw puzzle just waiting to have the pieces match up. Now massive local structures, like the Hydra-Centaurus region (the “Great Attractor”) which were previously hidden almost behind the Milky Way are shown in great detail by 2MRS. The Galactic “zone of avoidance” (ZoA) is still, however, a formidable barrier due to the sheer number of stars that produce a foreground (confusion) “noise”. Near the center of the Milky Way the confusion noise is extreme, blocking nearly 100% of the background light; whereas far from the Galactic center the confusion noise is minimal and the veil of the Milky Way is lifted at near-infrared wavelengths

“The 2MASS catalog has proven to be quite versatile to the astronomical community: supporting observation and future mission planning, seeding studies of star formation and morphology in nearby galaxies, penetrating the zone of avoidance, providing the base catalog of redshift and Tully-Fisher HI surveys, and so on. But perhaps its most important function is to provide the “big picture” context for analysis and interpretation of data concerning galaxy clusters, large scale structure and the density of matter in the Universe.” says Jarrett. “And so the primary motivation of this work, with the construction of qualitative “road” maps to the local Universe, is to provide a broad framework for studying the physical connection between the local Universe (Milky Way, Local Group, Local Supercluster, “Great Wall”, etc) and the distant Universe where galaxies and the cosmic web first formed. The best is yet to come.”

Studying Saturn’s Super Storm

Three views of Saturn's northern storm. ESO/University of Oxford/L. N. Fletcher/T. Barry

[/caption]

First seen by amateur astronomers back in December, the powerful seasonal storm that has since bloomed into a planet-wrapping swath of churning clouds has gotten some scrutiny by Cassini and the European Southern Observatory’s Very Large Telescope array situated high in the Chilean desert.

The image above shows three views of Saturn acquired on January 19: one by amateur astronomer Trevor Barry taken in visible light and the next two by the VLT’s infrared VISIR instrument – one taken in wavelengths sensitive to lower atmospheric structures one sensitive to higher-altitude features. 

Cassini image showing dredged-up ammonia crystals in the storm. NASA/JPL/Univ. of Arizona.

While the storm band can be clearly distinguished in the visible-light image, it’s the infrared images that really intrigue scientists. Bright areas can be seen along the path of the storm, especially in the higher-altitude image, marking large areas of upwelling warmer air that have risen from deep within Saturn’s atmosphere.

Normally relatively stable, Saturn’s atmosphere exhibits powerful storms like this only when moving into its warmer summer season about every 29 years. This is only the sixth such storm documented since 1876, and the first to be studied both in thermal infrared and by orbiting spacecraft.

The initial vortex of the storm was about 5,000 km (3,000 miles) wide and took researchers and astronomers by surprise with its strength, size and scale.

“This disturbance in the northern hemisphere of Saturn has created a gigantic, violent and complex eruption of bright cloud material, which has spread to encircle the entire planet… nothing on Earth comes close to this powerful storm.”

– Leigh Fletcher, lead author and Cassini team scientist at the University of Oxford in the United Kingdom.

The origins of Saturn’s storm may be similar to those of a thunderstorm here on Earth; warm, moist air rises into the cooler atmosphere as a convective plume, generating thick clouds and turbulent winds. On Saturn this mass of warmer air punched through the stratosphere, interacting with the circulating winds and creating temperature variations that further affect atmospheric movement.

The temperature variations show up in the infrared images as bright “stratospheric beacons”. Such features have never been seen before, so researchers are not yet sure if they are commonly found in these kinds of seasonal storms.

“We were lucky to have an observing run scheduled for early in 2011, which ESO allowed us to bring forward so that we could observe the storm as soon as possible. It was another stroke of luck that Cassini’s CIRS instrument could also observe the storm at the same time, so we had imaging from VLT and spectroscopy of Cassini to compare. We are continuing to observe this once-in-a-generation event.”

– Leigh Fletcher

A separate analysis using Cassini’s visual and infrared mapping spectrometer confirmed the storm is very violent, dredging up larger atmospheric particles and churning up ammonia from deep in the atmosphere. Other Cassini scientists are studying the evolving storm and a more extensive picture will emerge soon.

Read the NASA article here, or the news release from ESO here.


The leading edge of Saturn's storm in visible RGB color from Cassini raw image data taken on February 25, 2011. (The scale size of Earth is at upper left.) NASA / JPL / Space Science Institute. Edited by J. Major.

‘Sonic Booms’ in Space Linked to Star Formation

Dense filaments of gas in the IC5146 interstellar cloud. This image was taken by ESA’s Herschel space observatory at infrared wavelengths 70, 250 and 500 microns. Stars are forming along these filaments. Credits: ESA/Herschel/SPIRE/PACS/D. Arzoumanian (CEA Saclay) for the “Gould Belt survey” Key Programme Consortium.

[/caption]

Its true there is no sound in empty interstellar space, but the Herschel space observatory has observed the cosmic equivalent of sonic booms. Networks of tangled and tremendously large gaseous filaments seen within clouds of gas and dust between stars are likely to be remnants of slow shockwaves from supernovae, Herschel scientists say. And surprisingly, no matter what the length or density of these filaments are, the width is always roughly the same, about 0.3 light years across, or about 20,000 times the distance of Earth from the Sun. This consistency of the widths demands an explanation, scientists say.

And it’s possible these shockwaves could generate sound within an interstellar cloud – if something were there to hear it.

“Although the density in an interstellar cloud is lower than in a very good vacuum on Earth there are molecules in the order of 10^8 per cm^3” said Goeran Pilbratt, ESA’s Herschel mission scientist. “That should be enough for sound to propagate, apart from the fact that we do not have the instruments to measure it.”

Filaments like this have been sighted before by other infrared satellites, but they have never been seen clearly enough to have their widths measured. Herschel is seeing that the width of these filaments is nearly uniform across three nearby clouds: IC5146, Aquila, and Polaris. The Herschel team, lead by Doris Arzoumanian, Laboratoire AIM Paris-Saclay, CEA/IRFU, made observations of 90 filaments, and found all had nearly identical widths. “This is a very big surprise,” Arzoumanian said.

The network of interstellar filaments in Polaris as seen by Herschel. Credits: ESA/Herschel/SPIRE/Ph. André (CEA Saclay) 
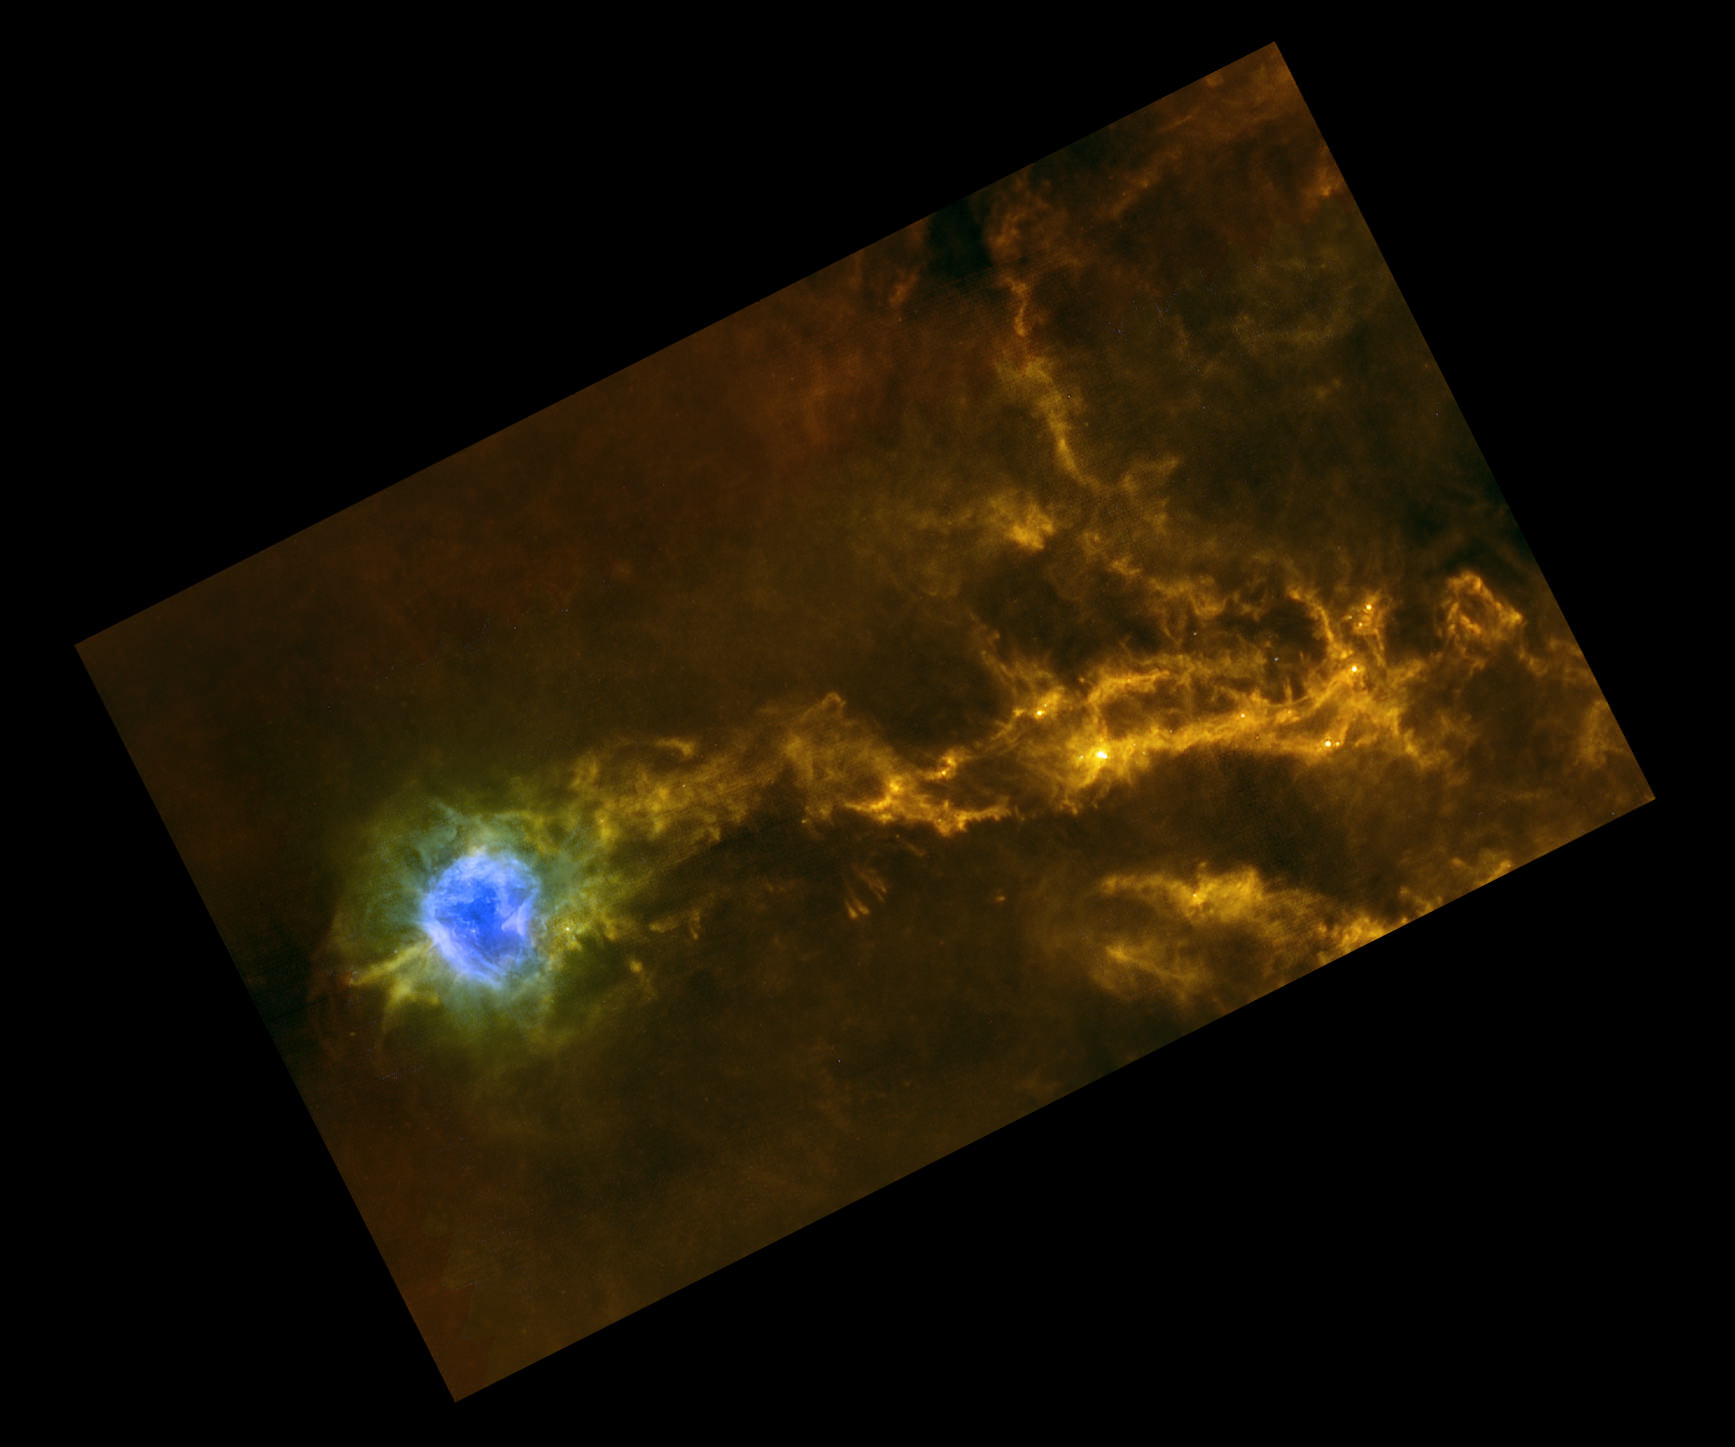
for the Gould Belt survey Key Programme Consortium and A. Abergel (IAS Orsay) for the Evolution of Interstellar Dust Key Programme Consortium.

Also, newborn stars are often found in the densest parts of these filaments. One filament imaged by Herschel in the Aquila region contains a cluster of about 100 infant stars.

The Herschel team said their observations provide strong evidence for a connection between interstellar turbulence, the filaments and star formation.

“The connection between these filaments and star formation used to be unclear, but now thanks to Herschel, we can actually see stars forming like beads on strings in some of these filaments,” said Pilbratt.

Comparing the observations with computer models, the astronomers suggest that filaments are probably formed when slow shockwaves dissipate in the interstellar clouds. These shockwaves are mildly supersonic and are a result of the huge amounts of turbulent energy injected into interstellar space by exploding stars.

They travel through the dilute sea of gas found in the galaxy, compressing and sweeping it up into dense filaments as they go. As these “sonic booms” travel through the clouds, they lose energy and, where they finally dissipate, they leave these filaments of compressed material.

Interstellar clouds are usually extremely cold, about 10 degrees Kelvin above absolute zero, and this makes the speed of sound in them relatively slow at just 0.2 km/s, as opposed to 0.34 km/s in Earth’s atmosphere at sea-level.

Sound travels in waves like light or heat does, but unlike them, sound travels by making molecules vibrate. So, in order for sound to travel, there has to be something with molecules for it to travel through. On Earth, sound travels to your ears by vibrating air molecules. In deep space, the large empty areas between stars and planets, there are no molecules to vibrate.

Read the team’s paper: Characterizing Interstellar Filaments with Herschel in IC5146

Sources: ESA email exchange with Pilbratt

Runaway Star Creates Quite a Shock

A fast-moving star, Alpha Camelopardalis, creates a stunning bow shock in this new image from WISE. Credit: NASA/JPL-Caltech/WISE Team

[/caption]

Faster than a speeding bullet, this supergiant star looks like it might be wearing a red cape. Alpha Camelopardalis, the bright star in the middle of this image, is a runaway star, moving at incredible speeds – astronomers believe could be zooming along at somewhere between 680 and 4,200 kilometers per second (between 1.5 and 9.4 million miles per hour). The speed of this star is so fast, a huge bow shock is being created as the star moves through space. Alpha Cam’s bow shock can’t be seen in visible light, but WISE’s infrared detectors allow us to see this arc of heated gas and dust around the star.

Runaway stars are kicked into motion either through the supernova explosion of a companion star or through gravitational interactions with other stars in a cluster. The WISE team explains the bow shock:

“Because Alpha Cam is a supergiant star, it gives off a very strong wind. The speed of the wind is boosted in the forward direction the star is moving in space. When this fast-moving wind slams into the slower-moving interstellar material, a bow shock is created, similar to the wake in front of the bow of a ship in water. The stellar wind compresses the interstellar gas and dust, causing it to heat up and glow in infrared.”

Just as astronomers aren’t quite sure about the speed Alpha Cam is traveling, its distance is also somewhat uncertain, but it is probably somewhere between 1,600 and 6,900 light-years away. It is located in the constellation Camelopardis, near Ursa Major. (Right ascension: 4h 54m 03.0113s, declination: +66° 20′ 33.641”)

The colors used in this image represent specific wavelengths of infrared light. Stars are seen primarily in blue and cyan (blue-green), because they are emitting light brightly at 3.4 and 4.6 microns. Green represents 12-micron light, primarily emitted by dust. The red of the blow shock represents light emitted at 22 microns.

Source: WISE

New Look at Messier 82 Reveals Superwind Source, Young Star Clusters

False color mosaic showing the Subaru COMICS image (red), a Hubble Space Telescope near-infrared image of stars (green) and a Chandra satellite X-ray image (blue) dominated by extremely hot gas and black holes. Credit: JAXA

[/caption]

Messier 82’s galactic windstorms emanate from many young star clusters, rather than any single source, say astronomers who released this new image today.

The international team of scientists, led by Poshak Gandhi of the Japan Aerospace Exporation Agency (JAXA), has used the Subaru Telescope to produce a new view of M 82 at infrared wavelengths that are 20 times longer than those visible to the human eye.

M 82 (09h 55m 52.2s, +69° 40′ 47″) is located close to the ladle of the Big Dipper in the constellation Ursa Major and is the nearest starburst galaxy, at a distance of about 11 million light years from Earth.

The combination of Subaru Telescope’s large 8.2 m primary mirror and its Cooled Mid-Infrared Camera and Spectrometer (COMICS) allowed the team to obtain a sharp, magnified view of the inner area of the galaxy.

Images of M 82. The bottom image from Subaru shows the superwind crossing the disk structure. Courtesy of JAXA.

Previous observations of M 82 with infrared telescopes, including the middle and bottom image in the three-part series, have found a very strong wind emanating from it — a ‘superwind’ that is composed of dusty gas and extends over many hundreds of thousands of light years. This high-powered windstorm ejects material from the galaxy at a speed of about a half a million miles per hour, sweeping it up from the central regions and depositing it far and wide over the galaxy and beyond. The contents of this material are seeds for solar systems like our own, and perhaps for life itself. The dusty superwind glows brightly in the infrared, because billions of bright, newly-formed stars heat it up.

With the new Subaru image, scientists have gained insight about the sources of the superwind.

“The wind is found to originate from multiple ejection sites spread over hundreds of light years rather than emanating from any single cluster of new stars. We can now distinguish ‘pillars’ of fast gas, and even a structure resembling the surface of a ‘bubble’ about 450 light years wide,” Gandhi explained.

COMICS has detectors particularly adept at indicating the presence of warm dust, which it found was more than 100 degrees hotter than the bulk of material filling the rest of the galaxy. The widespread, continuous flow of energy from young stars into the galactic expanse keeps the dust hot.

Further insights from the Subaru image emerge when it’s combined with previous images from Hubble and Chandra. Their integration produces a beautiful mosaic, represented in the lead image, that provides the first opportunity to isolate M 82’s infrared properties. Supported by these data, scientists can study the broad spectrum of radiation of different kinds of objects spread over the galaxy’s plane, including supernovae, star clusters, and black holes.

Many questions remain, such as how many more stars the galaxy contains — many could still be obscured by the dust of star formation — and whether or not M 82 hosts an actively growing supermassive black hole.

The results are reported in the article “Diffraction-limited Subaru imaging of M82: sharp mid-infrared view of the starburst core” by P. Gandhi, N. Isobe, M. Birkinshaw, D.M. Worrall, I. Sakon, K. Iwasawa & A. Bamba, in the Publications of the Astronomical Society of Japan, v. 63 (2011), in press.

Source: Subaru press release

Spitzer Captures a Pink Sunflower in Space

Classifying Galaxies
This image from NASA's Spitzer Space Telescope shows infrared light from the Sunflower galaxy, otherwise known as Messier 63. Spitzer's view highlights the galaxy's dusty spiral arms. Image credit: NASA/JPL-Caltech

[/caption]

Looking out my own window this morning provides a gloomy overcast view, so this new image from the Spitzer Space Telescope provides a day-brightener: a pink sunflower! This is the Sunflower galaxy, also known as Messier 63, and with Spitzers’ infrared eyes, the arms of the galaxy show up vividly. Infrared light is sensitive to the dust lanes in spiral galaxies, which appear dark in visible-light images. Spitzer’s view reveals complex structures that trace the galaxy’s spiral arm pattern.

Source: JPL
This galaxy is about 37 million-light years away from Earth, and lies close to the well-known Whirlpool galaxy and the associated Messier 51 group of galaxies.

Galaxy Size Matters … And This is Not a Rorschach Test

False color image of the Lockman-hole area of the sky at infrared wavelengths as imaged by the Herschel Space Observatory. Credit: ESA/SPIRE Consortium/HerMES Consortium

[/caption]

When it comes to forming stars, the size of a galaxy does matter, according to research out today in the online version of Nature.

But it doesn’t have to be as massive as we once thought.

Alexandre Amblard, an astrophysicist at the University of California, Irvine, and his colleagues used new data from the Herschel Space Observatory to peer into Lockman Hole area of the sky, where extragalactic light comes from star-forming galaxies out of reach for even the world’s most powerful telescopes.

The Lockman Hole is a patch of the sky, 15 square degrees, lying roughly between the pointer stars of the Big Dipper.

Called submillimetre galaxies, the study subjects emit light at wavelengths between the radio and infrared parts of the spectrum, so studying them requires novel approaches borrowing from both radio and optical astronomy. The galaxies by themselves are too blurry to be resolved with individual far-infrared telescopes – but their average properties can be observed and analyzed, which is exactly what Amblard and his colleagues did.

The authors measured variations in the intensity of extragalactic light at far-infrared wavelengths, and derived statistics for the level of clustering of light halos. They assume that the clustering reflects the underlying distribution of dark matter, and fit the data to a halo model of galaxy formation, which connects the spatial distribution of galaxies in the Universe to that of dark matter.

Distribution of dark matter when the Universe was about 3 billion years old, obtained from a numerical simulation of galaxy formation. The left panel displays the continuous distribution of dark matter particles, showing the typical wispy structure of the cosmic web, with a network of sheets and filaments, while the right panel highlights the dark matter halos representing the most efficient cosmic sites for the formation of star-bursting galaxies with a minimum dark matter halo mass of 300 billion times that of the Sun. Credit: VIRGO Consortium/Alexandre Amblard/ESA

Amblard and his colleagues discovered an enormous fact: the ‘haloes’ of dark matter that surround the Universe’s most active star-forming galaxies are each more massive than about 300 billion solar masses.

What’s even more interesting is that the new threshold for star formation is actually smaller than some previous estimates.

“I think there was one prediction that put the number around 5000 billion times that of the sun, but that was just a prediction from a theory of galaxy formation.“ said Asantha Cooray, also an astrophysicist at UC Irvine and second author on the new paper. The general consensus was that it may be between 100 to 1000 billion times the sun. We now have a more precise answer from this work.”

Cooray said he’s most excited “that we can look at a detailed image of the sky showing distant, star-forming galaxies and infer not only details about the stars and gas in those galaxies but also about the amount of dark matter needed to form such galaxies. Beyond inferring the presence, we still don’t know exactly what dark matter is.”

The results appear online ahead of print today on Nature’s website.

Gallery: WISE’s Greatest Hits

WISE First Light image. Image credit: NASA/JPL-Caltech/UCLA

[/caption]

The WISE mission is now over, with the spacecraft taking its final image on Feb. 1, 2011. WISE was a “cool” infrared mission, with the optics chilled to less than 20 degrees centigrade above absolute zero (20 Kelvins). In its low Earth orbit (523 km above the ground), the spacecraft explored the entire Universe and collected infrared light coming from everywhere in space and studied asteroids, the coolest and dimmest stars, and the most luminous galaxies. Expect to hear and see more from WISE, however in the future. More images will be released from the team in April and in the spring of 2012. Here’s a look back at some of the great images from WISE’s 13 months in space:

The red dot at the center of this image is the first near-Earth asteroid discovered by NASA's Wide-Field Infrared Survey Explorer, or WISE Image credit: NASA/JPL-Caltech/UCLA
The red smudge at the center of this picture is the first comet discovered by NASA's Wide-Field Infrared Survey Explorer, or WISE. Image credit: NASA/JPL-Caltech/UCLA
The immense Andromeda galaxy, also known as Messier 31 or simply M31, is captured in full in this February 2010 image from WISE. credit: NASA/JPL-Caltech/UCLA
NGC 3603, as seen by WISE. credit: NASA/JPL-Caltech/UCLA
NGC 1514, sometimes called the Crystal Ball nebula shows a new double ring feature in an image from WISE. Image credit: NASA/JPL-Caltech/UCLA
This image from WISE shows the Tadpole nebula. Image credit: NASA/JPL-Caltech/UCLA
The Heart and Soul nebulae are seen in this infrared mosaic from WISE. Image credit: NASA/JPL-Caltech/UCLA
An image released in August 2010 from WISE image of the Small Magellanic Cloud. Image credit: NASA/JPL-Caltech/WISE Team
This oddly colorful nebula is the supernova remnant IC 443 as seen by WISE. Image credit: NASA/JPL-Caltech/UCLA
The last image that will ever be taken by the WISE spacecraft. Credit: NASA/JPL-Caltech/WISE Team

And if you want to see how it all started, here’s a video of WISE’s launch:

End of the Line for WISE

What is space made of
The last image that will ever be taken by the WISE spacecraft. Credit: NASA/JPL-Caltech/WISE Team

[/caption]

First light images from telescopes and spacecraft are exciting – there is the exhilaration that the equipment is working and the anticipation of all the great observations to come. This image has a little different feel to it. On February 1st, 2011, NASA’s Wide-field Infrared Survey Explorer, or WISE, took its last snapshot of the sky. This “last light” image comes after just 13 months of service in space.

This short lifetime was expected: the WISE team knew the cryogen would only last 10 months. WISE launched on Dec. 14, 2009 and there was a 1 month in-orbit check out period, then the 6–month survey, so the team is happy to have had the little extra time with the telescope that they did.

This “last light” image, however, is highly reminiscent of its “first light” image, and shows thousands of stars in a patch of the Milky Way Galaxy, covering an area 3 times the size of the full Moon, in the constellation Perseus. In the upper left corner, a faint wispy cloud can be seen bending around a pulsating variable star called EV Persei.

In the short 13 months that WISE surveyed, it produced millions of infrared images covering the whole sky in its four bands, and covering it twice at 3.4 and 4.6 microns. It studied asteroids, the coolest and dimmest stars, and the most luminous galaxies.

Now that the survey is complete, WISE is being put into hibernation. While the satellite sleeps and circles more than 500 kilometers above the Earth’s surface, the WISE team is busily preparing its data for two big public releases: one this April, and the final release in the spring of 2012. Even though WISE has taken its last picture, the project will continue to feature some of the best imagery from the survey on a regular basis.

The coolant for the spacecraft ran out in October of 2010 and WISE warmed up from -260 degrees to -200 degrees C (-436 to -328 degrees Fahrenheit). This image contains data from the two detectors largely unaffected by the warm-up: 3.4 and 4.6 microns (the 12 and 22 micron detectors are no longer useful at the warmer temperatures).

So long, WISE, and we thank you (but look forward to the public release of your data and more images to come.)