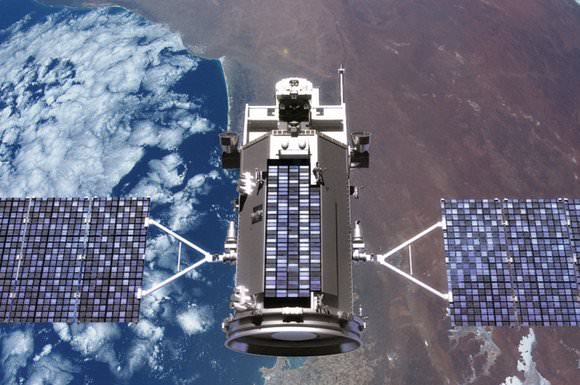
NASA’s Glory mission launched from Vandenberg Air Force Base in California Friday at 5:09:45 a.m. EST failed to reach orbit. Telemetry indicated the fairing, the protective shell atop the Taurus XL rocket, did not separate as expected about three minutes after launch. The failure represents a $420 million loss for NASA, and the loss of two important investigations related to climate change: ongoing data collection to monitor the sun’s energy reaching Earth, and a study of how aerosols move through Earth’s atmosphere and may influence climate.
This is the second time a Taurus XL rocket has failed to separate. NASA’s $273 million Orbiting Carbon Observatory crashed into the ocean in February 2009 due to a similar mishap. After that failure, Orbital Sciences redesigned the system. It has worked three times since on the company’s Minotaur rocket.
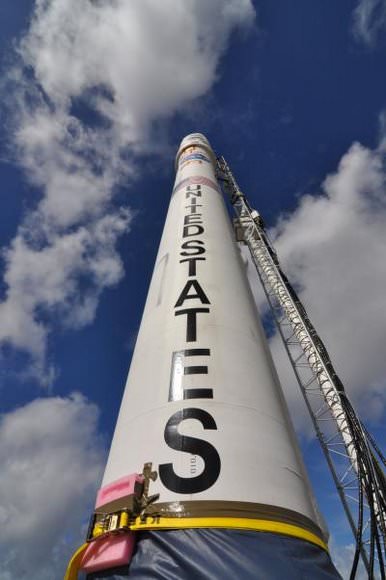
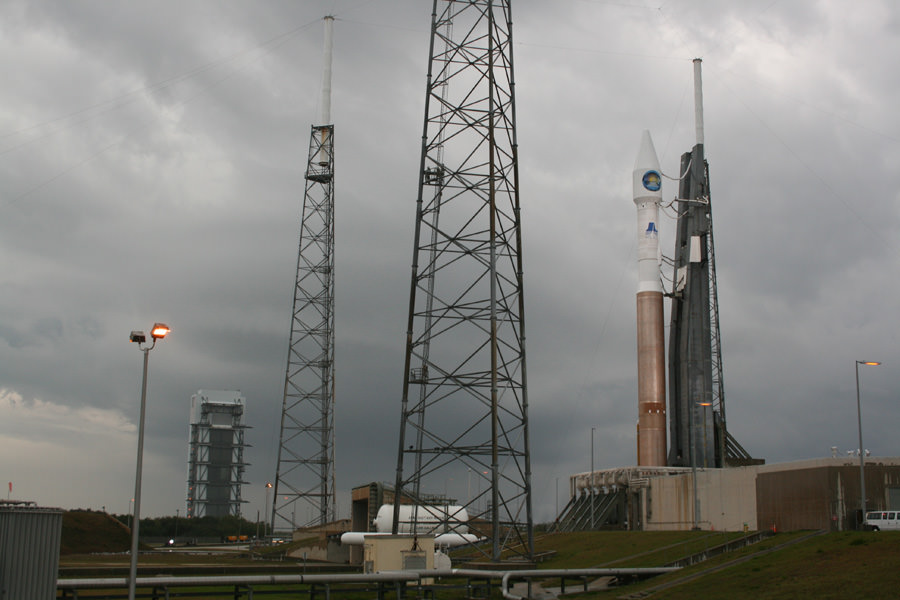
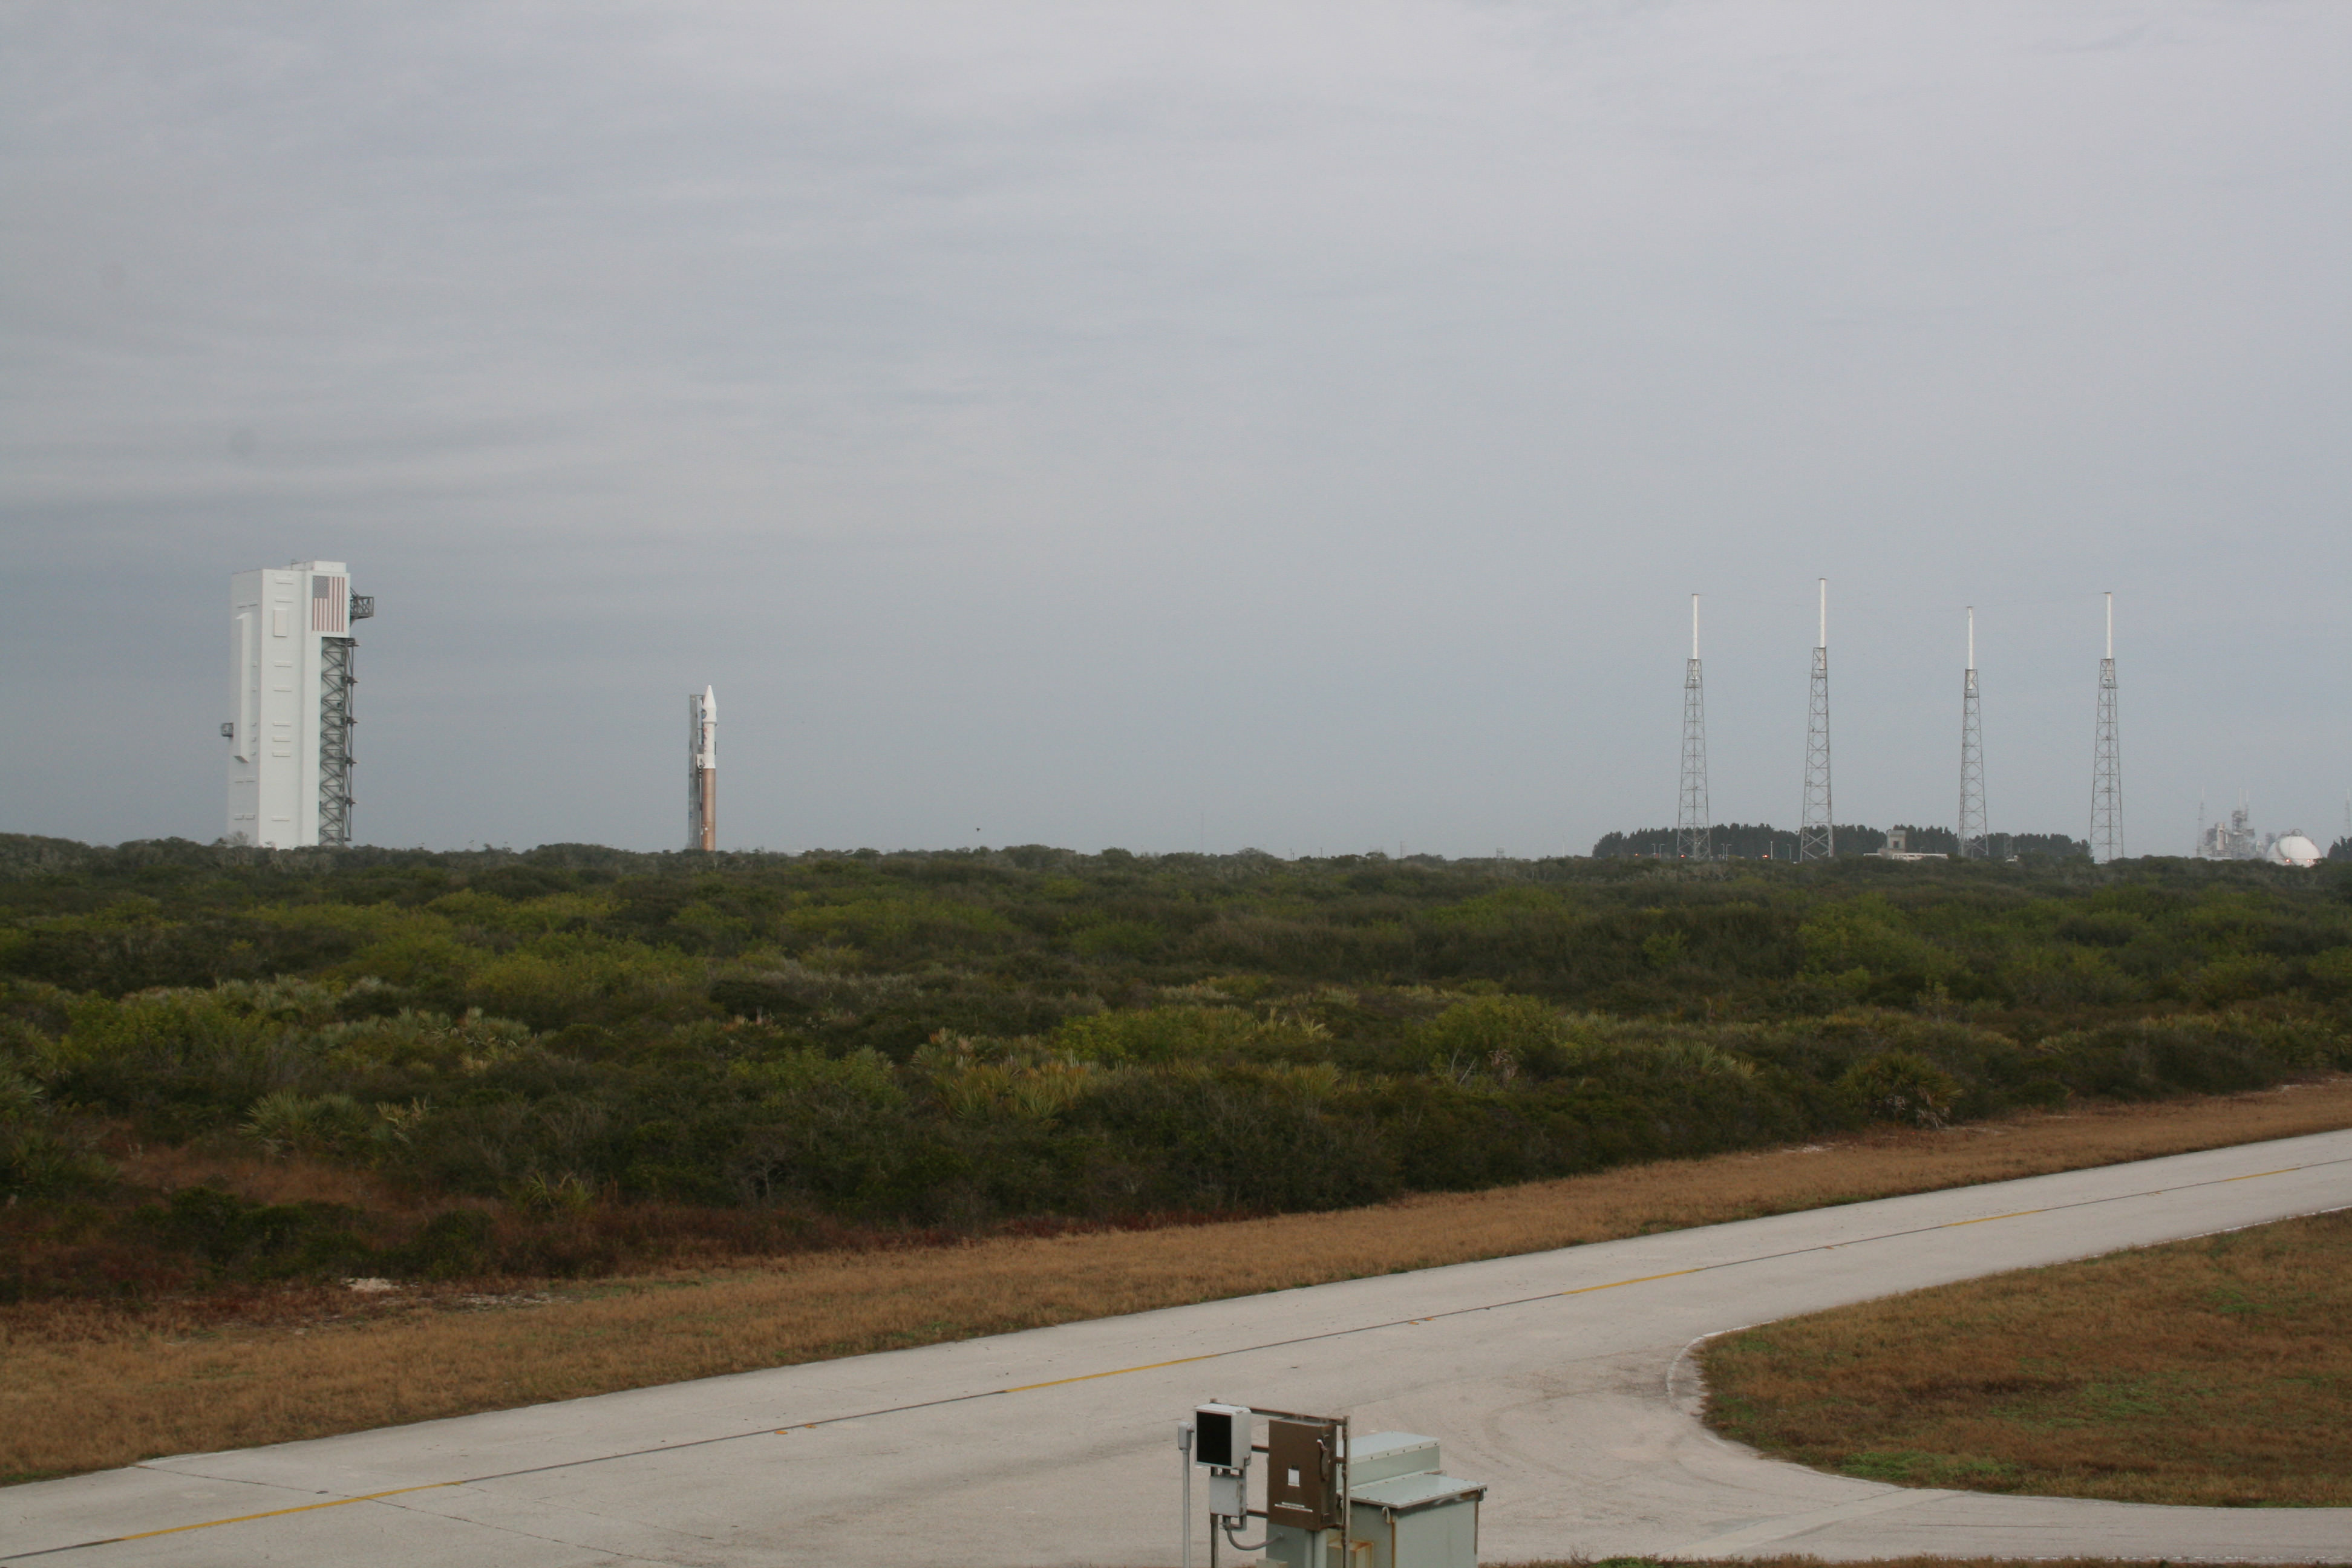
NASA will try again to launch its “climate change satellite” on Friday, following an attempt that was scrubbed on Feb. 23 due to technical issues with ground support equipment for the Taurus XL launch vehicle, shown at right.
The March 4 liftoff is targeted for just after 2 a.m. local time at the Vandenberg Air Force Base in California (5:09:43 a.m. eastern).
Two instruments aboard Glory will help address influences on Earth’s climate. The Total Irradiance Monitor led by Greg Kopp at the Boulder, Colorado-based Laboratory for Atmospheric and Space Physics will continue a decades-long measurement of the sun’s energy reaching Earth, and Raytheon’s Aerosol Polarimetry Sensor will track aerosols in Earth’s atmosphere. See a more detailed story about the mission.
NASA will stream coverage of the launch starting at 3:30 a.m. eastern time on March 4. Real-time updates of countdown and launch milestones will also be posted on NASA’s launch blog.
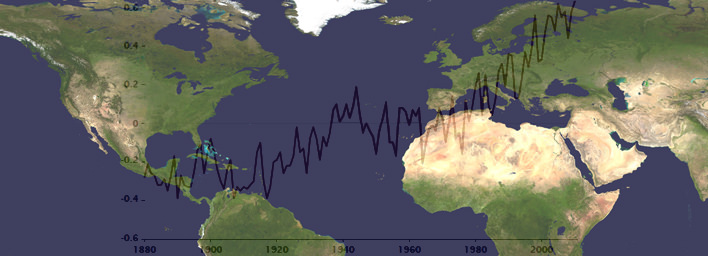
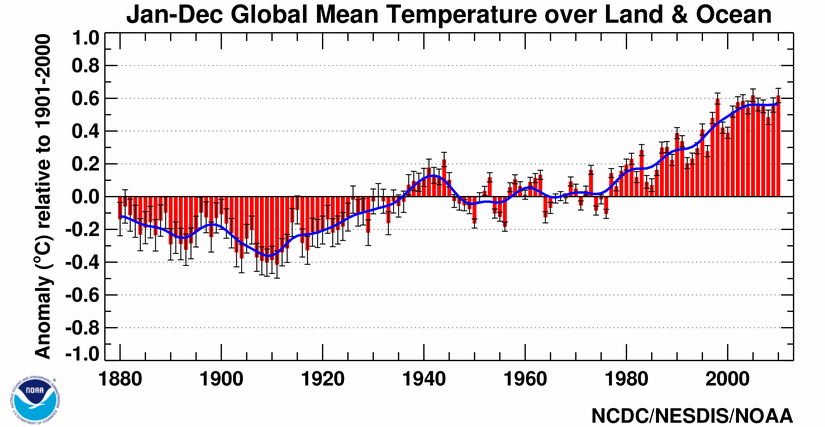
World map with global temperature changes from 1880 to 2010. Credit: NASA GISS
[/caption]
Newly released scientific data shows that 2010 equals 2005 as the Earths warmest year on record over the last 131 years, say researchers from NOAA and NASA. Temperature measurements from instrumented monitoring stations date back to 1880.
The past decade from 2001 to 2010 was the warmest on record and includes 9 of the 10 hottest years. A NOAA ranking of the 15 hottest years globally shows they all occurred in the last 15 years since 1995.
2010 was the 34th consecutive year with global temperatures above the 20th century average of 57.0 F (13.9°C), according to NOAA data. 1976 was the last year with a below average global temperature. Updated.
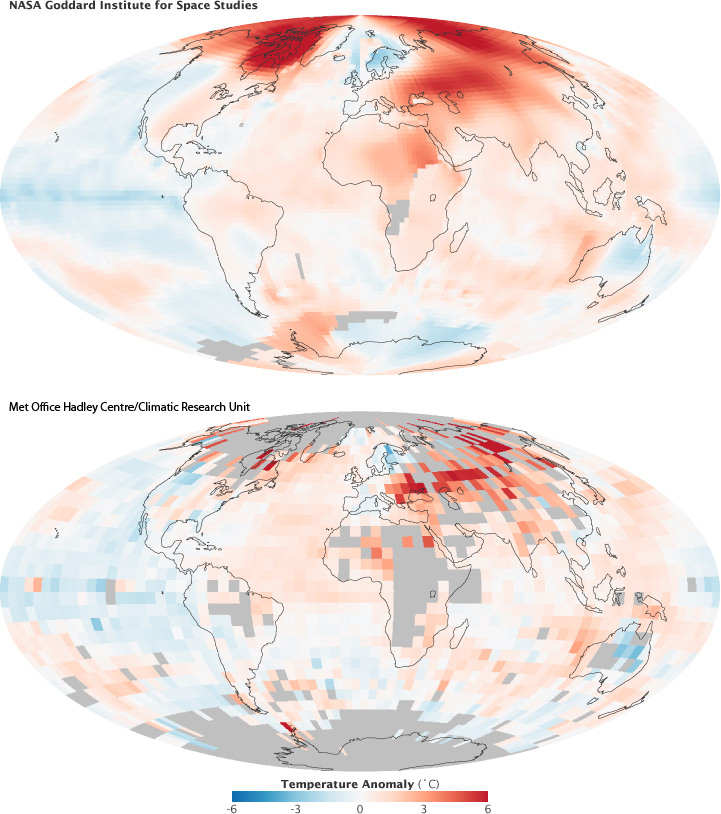
Global surface temperature anomalies for 2010. Credit: NOAA
Overall, the combined global land and ocean surface temperatures for 2010 and 2005 has risen 1.12 F (0.62 C) compared with the 20th century average, according to NOAA. The average global temperature in 2010 was 58.12 degrees compared to 57.0 F (13.9°C) as the average for all of 20th century. 2010 was also the wettest year on record.
The rise in Earths’ global temperature has been accompanied by a decline in arctic sea ice. Specifically, surface air temperatures in the arctic were warmer than normal during the summer of 2010. The sea ice extent measured in September 2010, was the 3rd lowest on record since accurate monitoring began in 1979, states NOAA in the annual Arctic report card. See Video below.
Scientists from NOAA’s National Climatic Data Center (NCDC) in Asheville, N.C. and NASA’s Goddard Institute for Space Studies (GISS) in New York City announced the findings on Jan 12. The temperature data are collected by weather stations that span across the globe.
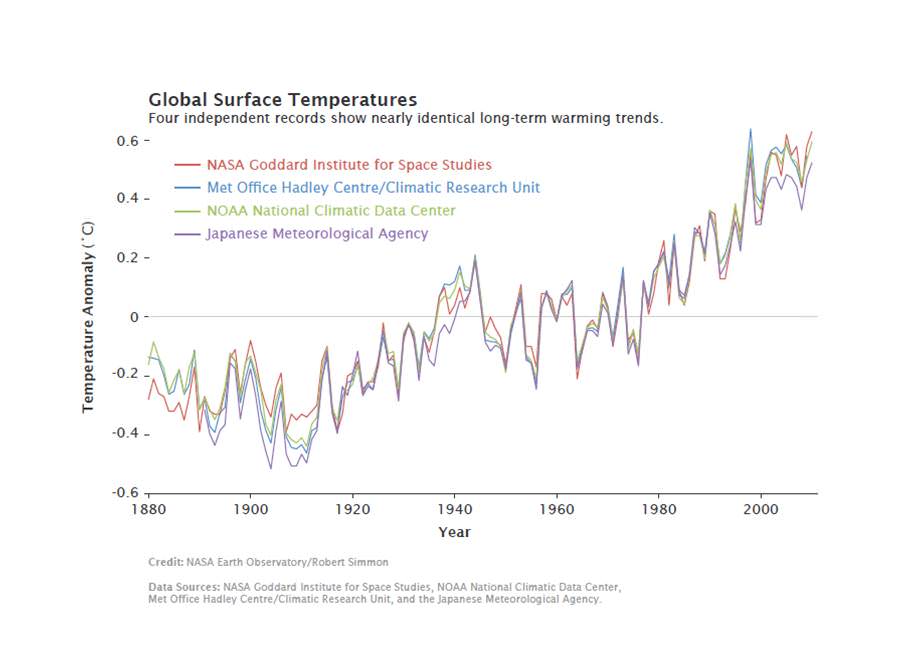
Global measurements by independent researchers in the UK at the Met Office Hadley Centre and at the Japanese Meteorological Agency closely match the trend of warming temperatures gathered by NOAA NCDC and NASA GISS.
The graphic below combines the actual temperature data collected independently by the four research agencies. The temperature trend lines are remarkably consistent.
Multiple institutions monitor global surface temperatures. Despite subtle differences in the ways the scientists perform their analyses, these four widely referenced records show remarkable agreement. Credit: NASA Earth Observatory/Robert Simmon
Much of the rise in global temperatures has taken place since the late 1970’s, says NASA. The rate of increase has been about 0.36 F per decade. The NASA GISS weather data were collected using over 1000 meteorological stations around the world, satellite observations of sea surface temperature and Antarctic research station measurements.
2010 average annual temperature ranks by state in the US. Credit: NOAA
The data are fed into a computer program which then calculates temperature anomalies — the difference between surface temperature in a given month and the average temperature for the same period during 1951 to 1980. NASA GISS uses that three-decade period as the baseline for analysis against which climate change can be tracked. NOAA uses the entire 20th century.
For the contiguous United States, NOAA analysis shows that “2010 was the 14th consecutive year with an annual temperature above the long-term average. Since 1895, the temperature across the US has increased at an average rate of approximately 0.12 F per decade.”
There are large areas in the Arctic without weather stations. NASA GISS approaches the problem by filling in gaps with data from the nearest land stations. The Climatic Research Unit at the University of East Anglia, which works jointly with the Met Office Hadley Centre, leaves much of the region out of its global temperature analysis. Credit: NASA Earth Observatory/Robert Simmon2010 Global Significant Weather and Climate Events. Credit: NOAA Global Temperatures.
The year 2010 tied with 2005 as the warmest year since records began in 1880. The annual global combined land and ocean surface temperature was 0.62°C (1.12°F) above the 20th century average. The range associated with this value is plus or minus 0.07°C (0.13°F). The 2010 combined land and ocean surface temperature in the Northern Hemisphere was also the warmest on record, while the combined land and ocean surface temperature in the Southern Hemisphere was the sixth warmest such period on record. Credit: NOAA
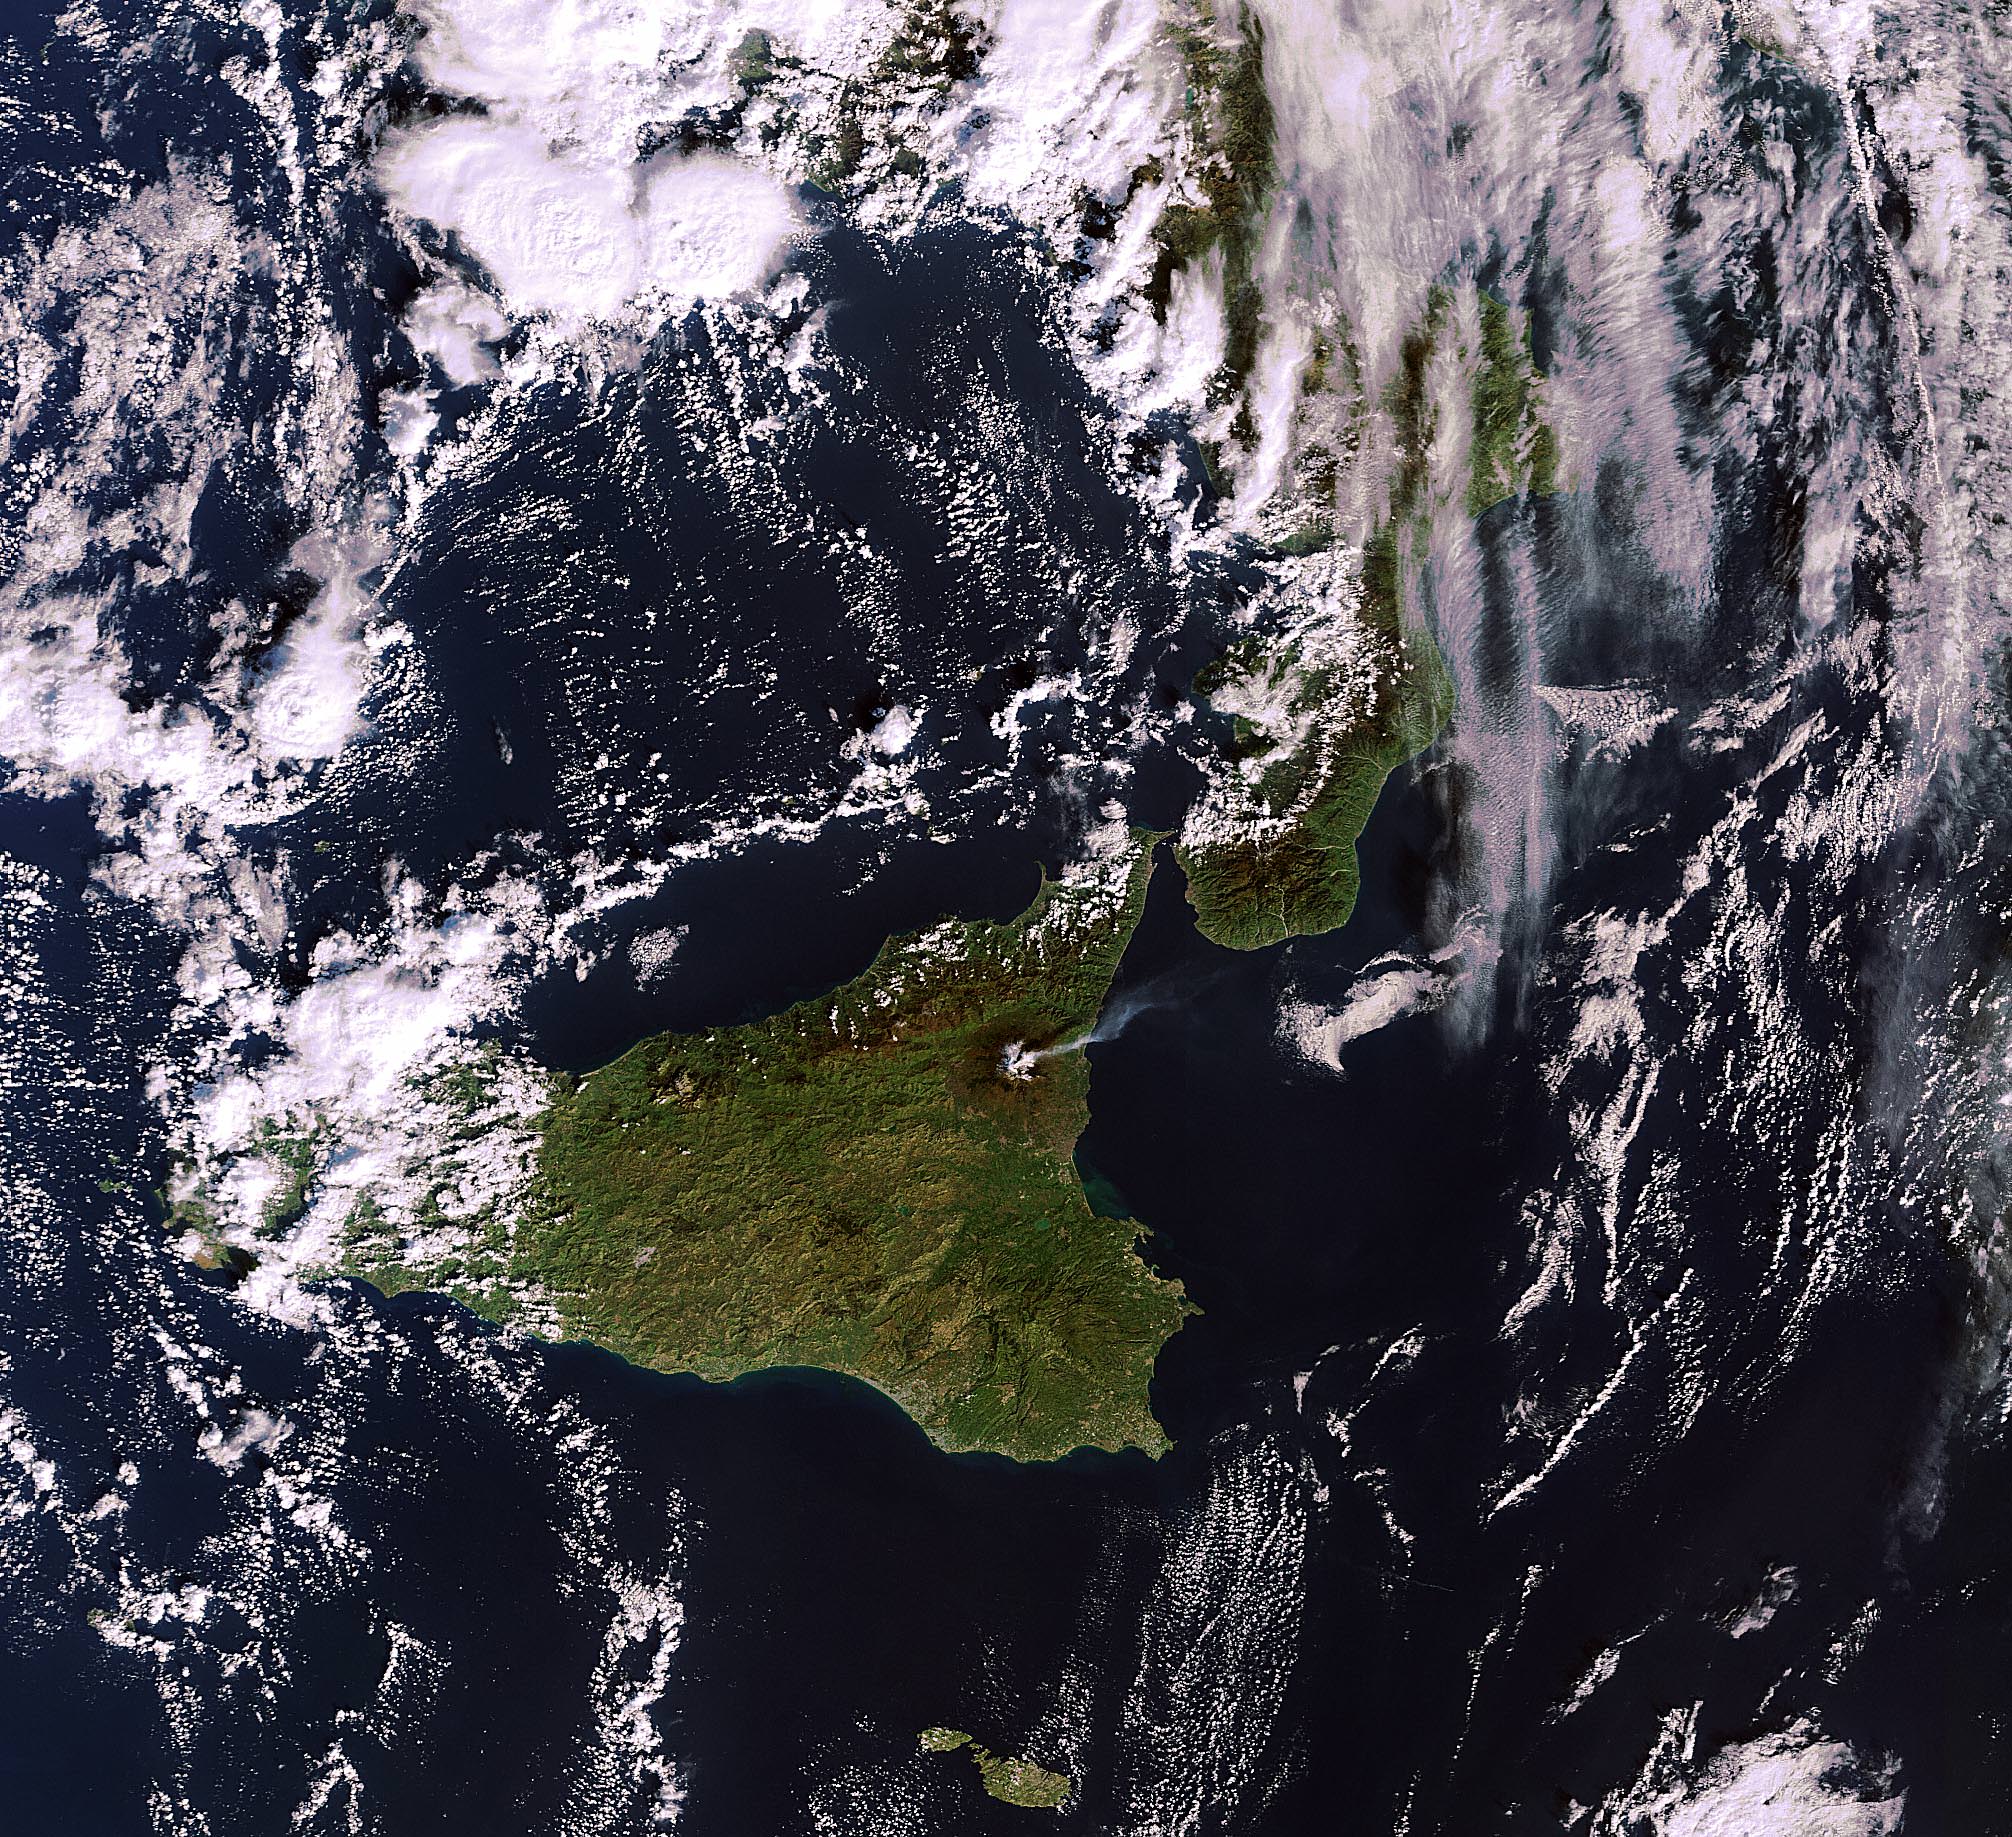
Volcanic eruptions at Mt. Etna from orbiting NASA Terra Satellite. Acquired on January 11, 2011. NASA Earth Observatory Image of the Day on January 15, 2011. Credit: NASA Terra Satellite
[/caption]
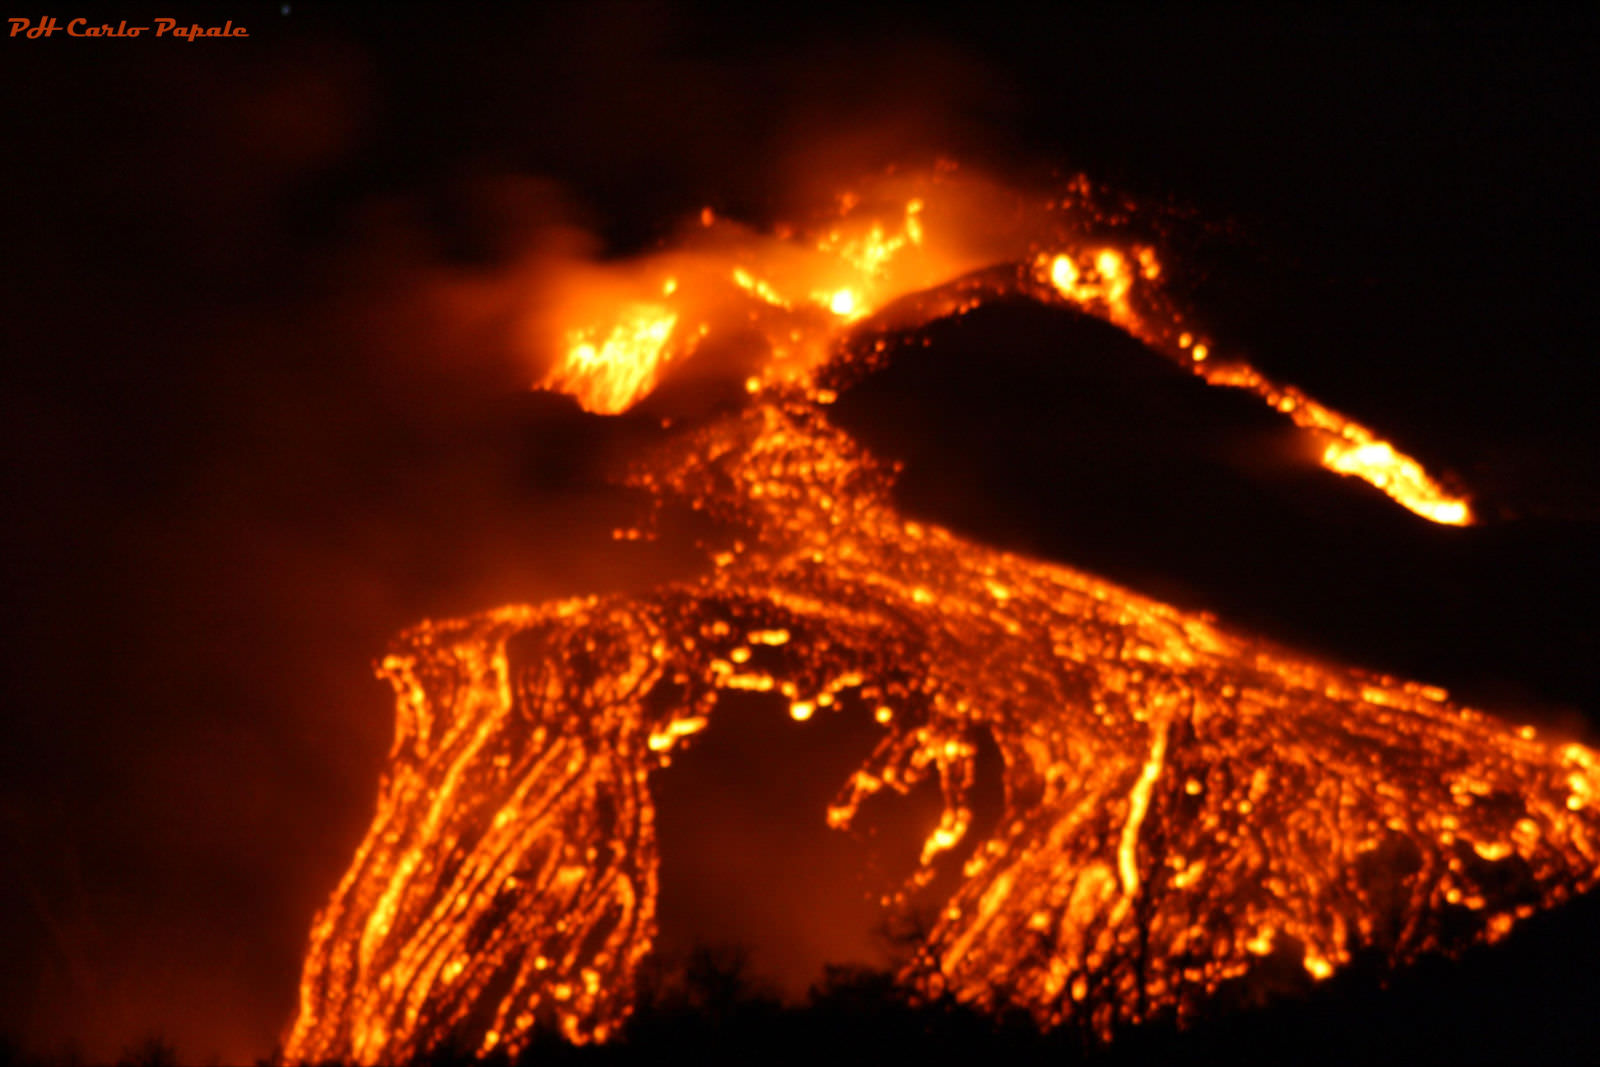
Spectacular eruptions from Mt Etna are spewing massive quantities of lava, smoke and ash many hundreds of meters high into the skies above the island of Sicily. Mt Etna is the most active volcano in Europe and one of the most active on all of Earth. The volcano rumbled to life again this week on the evening of January 12, 2011 and lit up the night sky. Mt Etna is 3350 meters high and located on the northeast coast of Sicily near the boot of Italy (see above, below).
Updated: comment or send me your Etna erupting photos/accounts to post below.
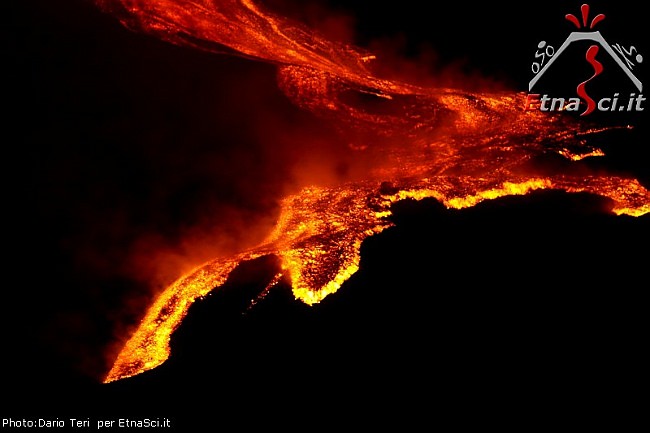
This fearsome natural wonder is providing an awe inspiring show from both Earth and Space. Local residents and lucky tourists nearby took stunning videos and photos (below) showing fountains of brilliant lava eruptions streaming mightily from the volcano.
This Envisat MERIS image, acquired on 11 January 2011, shows the plume of smoke billowing into the atmosphere from Mount Etna, Sicily, Italy. Activity gradually increased the following day, peaking in the evening. Credits: ESA
Click to Enlarge all images
Amazing photos from space were captured by Earth orbiting satellites from NASA and ESA. NASA’s Terra satellite took the above image on Jan. 11 as Mt Etna was spewing forth smoke or ash just prior to the volcanic eruptions on Jan. 12. The photo of Etna is NASA’s Earth Observatory Image of the Day, today, Jan. 15, 2011.
ESA’s Envisat likewise snapped a gorgeous view of the billowing plume of smoke rising to space (photo at left) and the international crew aboard the ISS, which currently includes Italian astronaut Paolo Nespoli. Perhaps he’ll send us a shot !
Local news and eyewitness accounts say that tremors from the volcano began increasing on Jan. 11. Emissions of volcanic gases and water vapor have been ongoing since late September 2010. The sounds of explosive tremors from deep inside were also detected months ago.
This sizzling hot video – “Etna at Maximum Activity” – is set to music and records the magnificent flowing streams of lava and the thunderous sounds of the crackling, explosive eruptions. Be sure to view at full screen, then just sit back and enjoy !
Plumes of volcanic ash from the eruptions spread across Sicily and forced the closure of the local Fontanarossa airport – nearby to the city of Catania, which is 24 kilometers away.
Rumblings of Mt Etna have been recorded in historical documents dating back to about 1500 BC.
Another short, dramatic video with the raw sounds of the eruption from a group of German tourists visiting the beautiful city of Taormina, Sicily
Eyewitness Description:
“Mount Etna erupted in the evening of January 12, 2011 for around four hours, providing an amazing scenery. We shot this unique video from Taormina on January 12, 2011 at 11.45 p.m. and uploaded it on YouTube.
On the evening of 11th January 2011 an increase in volcanic tremor was recorded at the summit of the volcano. The recorded seismic activity reached a peak at 7 a.m. on 12th January when the source moved from north of NE crater to the SE crater. The eruption started with strombolian explosive activity at SE crater at around 9.p.m. Lava overflowed the eastern rim of SE crater and fed a flow that moved toward the western wall of the Valle del Bove (Valley of the oxen), an ancient huge uninhabited depression on the NE side of the volcano.
The Sicilian communities near the volcano were not threatened by this latest fascinating eruption. Best place to watch the fascinating eruptions of Mount Etna is the town of Taormina, nestled on a hill at 220 meters / 722 feet above the sea level and at a safe linear distance of approx. 28 Km / 17,4 miles from the top craters of the Sicilian volcano.” Fearsome lava eruptions spewing from Mt Etna on Jan. 11, 2011
A few years back, I visited Mt Etna and was incredibly lucky to witness this spectacle of nature myself. It was an unforgettable experience to see the glowing red-orange colored lava flowing out from the bowels of the Earth. It was like a living being with circulating blood.
In the excitement, I did something that in retrospect was incredibly stupid. I stood on a ledge, perhaps 50 cm thick, right above the porthole of the scalding hot lava erupting from the earth beneath my feet. Many others did too.
Sicily is a lovely place of manmade and natural wonders. Don’t pass up an opportunity to see Etna aflame
Look at Etnaweb (in Italian, but Universal) for a fantastic collection of local photos and webcams of the eruption.
Volcanic eruptions are breathtaking events to behold. The residual plumes of smoke and ash can stay aloft for many years and can also effect how we see other astronomical events such as our view of solar and lunar eclipses.
For a more tranquil view of Earth and inspiration from Carl Sagan, click here
NASA’s Spirit robot is positioned next to an ancient and extinct volcanic feature on Mars. Learn more here
Can you envision a place hotter than Etna ? … A scorching, molten hellish world where the temperatures are unimaginably hot
Comment or send me your photos and eyewitness accounts of erupting Mt Etna
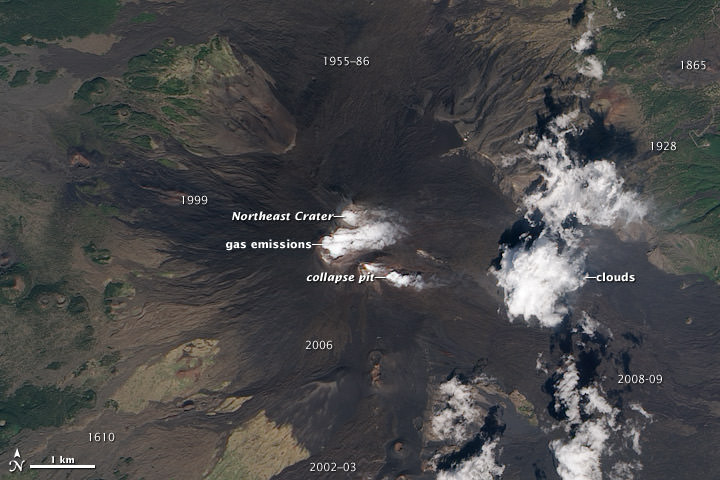
Signs of activity at the summit of Mount Etna, Europe’s most active volcano.
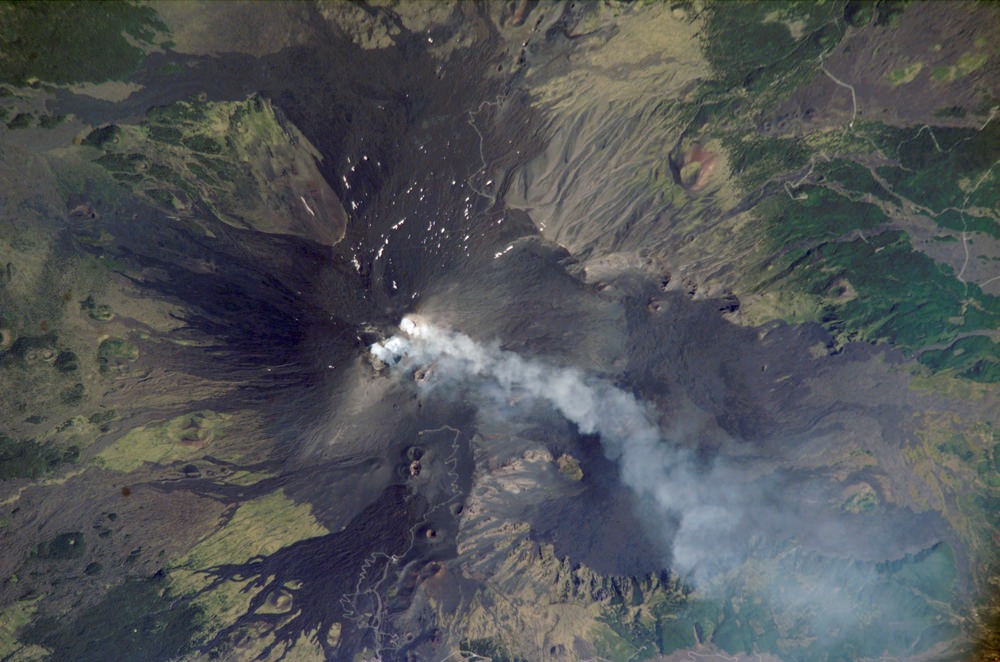
Water vapor and other volcanic gases overflow Etna’s summit craters, spilling out over the volcano’s upper slopes. A steam plume rises from a collapse pit that formed in late 2009, the newest volcanic feature on Etna. Dark lava flows from recent eruptions cover the peak, overlaying lighter, weathered flows from hundreds or thousands of years ago. (Numbers on the image indicate when a flow was erupted.) The oldest lavas are covered by green vegetation. Eruptive cones and fissures also dot the landscape. Frequent explosions deep within the Northeast Crater, which may presage an upcoming eruption, are audible at the summit. These explosions were occurring sporadically every few minutes, as recorded by nearby seismometers. This natural-color satellite image was acquired by the Advanced Land Imager (ALI) aboard (EO-1) on September 26, 2010.Mt Etna photographed by astronauts aboard the International Space Station on August, 2, 2006.
One of the most consistently active volcanoes in the world, Sicily’s Mount Etna has a historical record of eruptions dating back to 1500 BC. This astronaut photograph captures plumes of steam and possibly ash originating from summit craters on the mountain: the Northeast Crater and Central Crater, which includes two secondary craters (Voragine and Bocca Nuova). Locals heard explosions coming from the rim of the Northeast Crater on July 26, 2006, and the plumes shown in this image are likely a continuation of that activity. Credit: NASA.
Ars Electronica made its debut on September 18, 1979. This festival of art, technology and society spotlighted the emerging Digital Revolution. In his preface to what was going on then, Mayor Franz Hillinger wrote (with specific reference to music): “Ars Electronica is giving rise to a new tonal coloration in which state-of-the-art technology is dovetailing with the intellectual spirit of the age to open up undreamt-of expressive possibilities. […] I am absolutely convinced that this new melodic parlance will ultimately be widely understood. After all, with the help of electronic music, it can even be made visible, be implemented in color, contour, line and rhythm that can be followed onscreen.” He would be proven correct.
Within a few years, Ars Electronica developed into one of the world’s foremost media art festivals. And its growing success was paralleled by the expansion of its annual lineup of events. The 1979 festival proudly presented 20 artists and scientists; in 2008, no fewer than 484 speakers and artists from 25 countries were in attendance. Don’t miss this year’s Live Stream on September 6 at 14:00 UT!
For more than three decades now, this world-renowned event has provided an annual setting for artistic and scientific encounters with social and cultural phenomena that are the upshot of technological change. Symposia, exhibitions, performances and interventions carry these inquiries beyond the confines of conventional conference spaces and cultural venues and take them out into the public sphere and throughout the cityscape. In this process of pervading public spaces and staging festival activities in interesting and appropriate physical settings, Ars Electronica has consistently displayed extraordinary imaginativeness. From the harbor to the mines, from factories to outlying monasteries, unusual locations have repeatedly served as sites of performances and interventions, and have, in turn, been reinterpreted by them.
But the attractiveness of Ars Electronica isn’t attributable solely to participation by renowned scientists and artists from all over the world. Or to remarkable venues. Above all, it’s the international audience that makes the biggest contribution to the festival spirit: the colorful mix of old friends and new faces who conjure up extraordinary circumstances – a “fruitful state of emergency” – every September in Linz.
Be sure to tune in on Monday, September 6th when the Ars Electronica Festival will be featuring Repair dealing with the issues of light pollution!
Can’t get enough of “Avatar?” Now, you can see James Cameron and scenes from the 3-D epic on NASA TV and elsewhere, promoting the many contributions of NASA’s Earth science program that helps enable exploration of our home planet, as well as making the public more environmentally aware. NASA has 14 science satellites in orbit making cutting-edge global observations of the entire global system including the atmosphere, oceans, land surface, snow and ice.
“When NASA ventures into space, it remembers to keep a steady eye on home,” Cameron said. “Its fleet of Earth-orbiting satellites constantly reveals our whole planet: its remotest places, its mysteries and the powerful influence of humans.”
The movie “Avatar,” depicts the fictional planet of Pandora and is coming back to theaters this week. The story centers on a beautiful planet threatened by forces that want to exploit its natural resources.
Launch Complex 41: Atlas rocket was rolled from VIF at left to pad at right on Feb 9, 2010. Credit: Ken Kremer
[/caption]
(Editor’s Note: Ken Kremer is at the Kennedy Space Center for Universe Today covering the launch of SDO and Endeavour.)
NASA’s nearly $1 Billion hi tech sun probe, the Solar Dynamics Observatory or SDO, was rolled out today (Feb 9) to Launch Pad 41 on a rainy day here in Florida at 1 day from blast off. SDO will be carried aloft atop an Atlas V rocket at 10:26 AM EST on Feb 10 at Cape Canaveral Air Force Station. The launch window extends for 1 hour. The current weather prediction is only 40% “GO”. The primary concerns for launch day are ground winds with gusts and thick clouds.
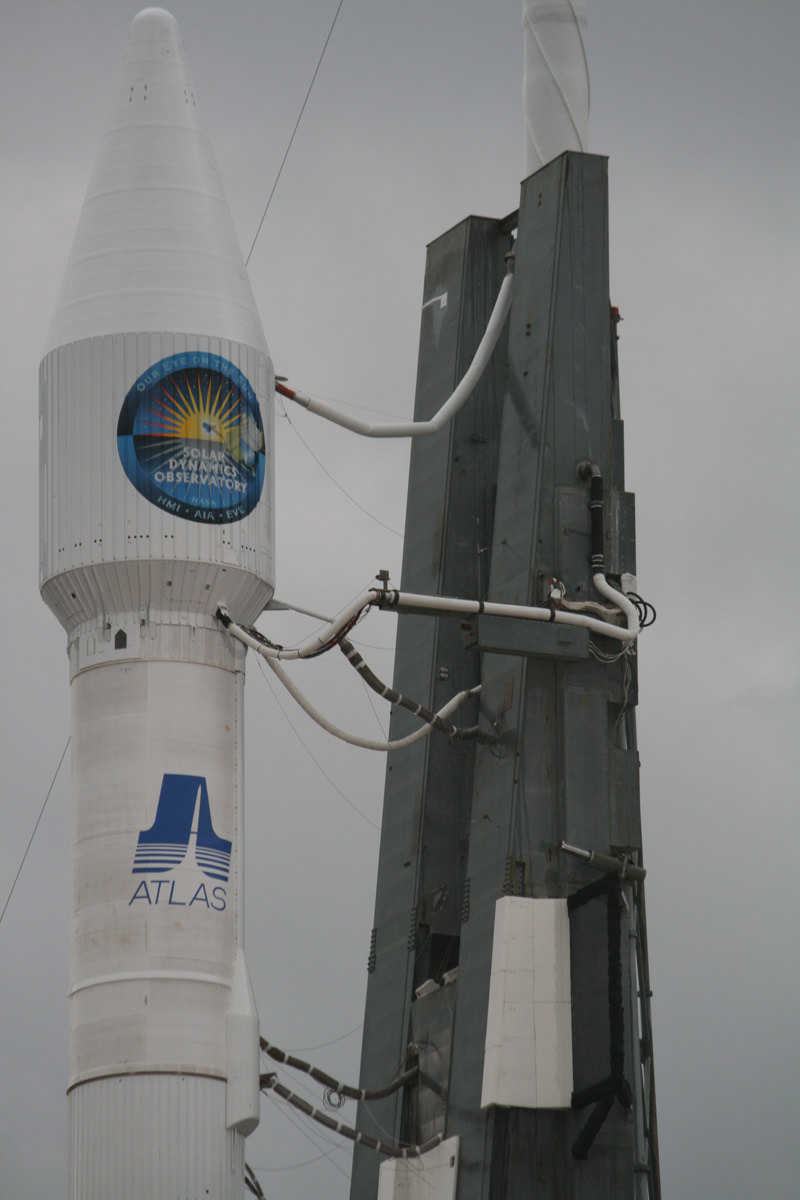
NASA’s SDO sun explorer is encapsulated inside 4 meter payload fairing and is bolted atop Centaur Upper Stage of Atlas V rocket at Launch Complex 41. Umbilical lines at right carry cryogenic propellants, electrical power and purge gases. Credit: Ken KremerAt the Kennedy Space Center, I was thrilled to watch the rocket rollout to the pad this morning as part of a NASA Media event along with Universe Today Senior Editor Nancy Atkinson. We were accompanied by a group of SDO managers and science investigators from across the country. The rollout started from inside the 30 story gantry known as the VIF, or Vertical Integration Facility, and ended at the launch pad. It took approximately 35 minutes for the twin “trackmobiles” to push the Atlas rocket about 1800 ft along railroad tracks.
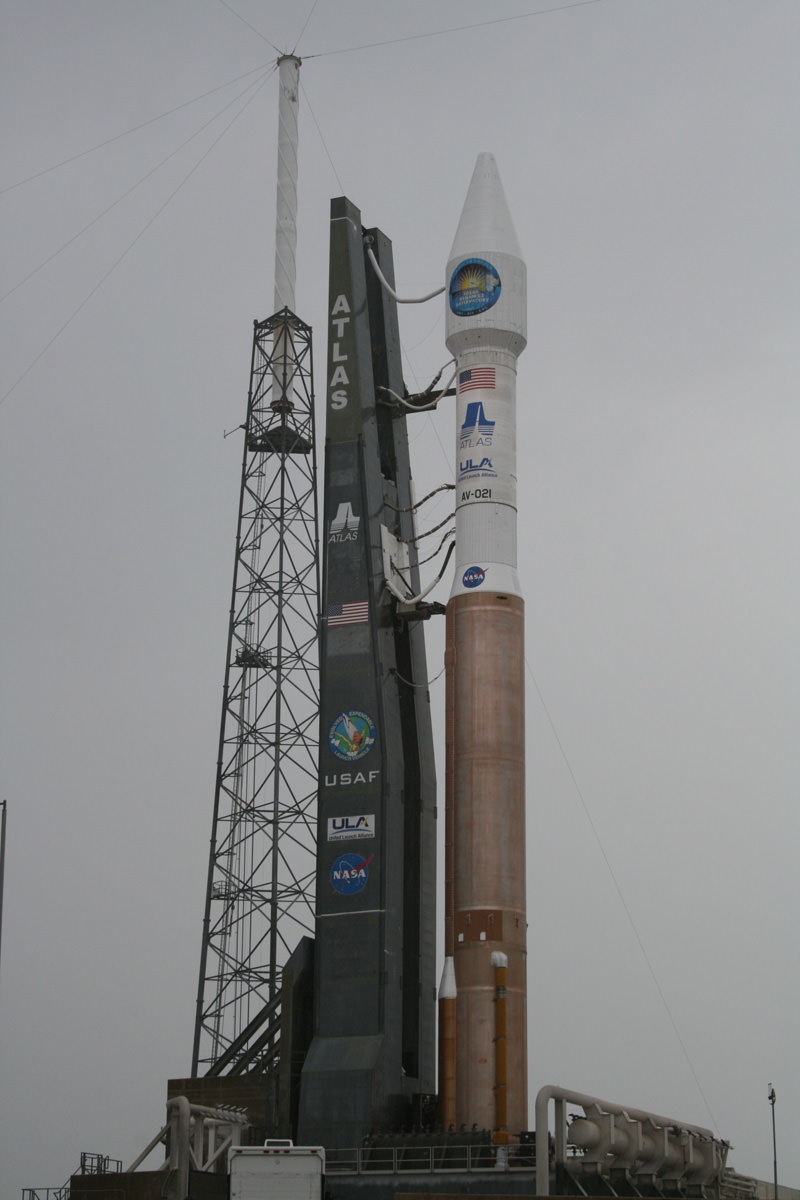
Atlas V booster is 12.5 ft in diameter and 106.5 ft in length. Centaur Upper Stage is 10 ft in diameter and 41.5 ft long. SDO payload fairing is 14 ft in diameter. Total Vehicle height is about 189 ft. Credit: Ken KremerThis afternoon I traveled directly inside the highly restricted security zone which surrounds Launch Complex 41 for a photo shoot to observe the assembled Atlas V rocket and SDO spacecraft directly at the pad. Fantastic experience despite the rainstorm.
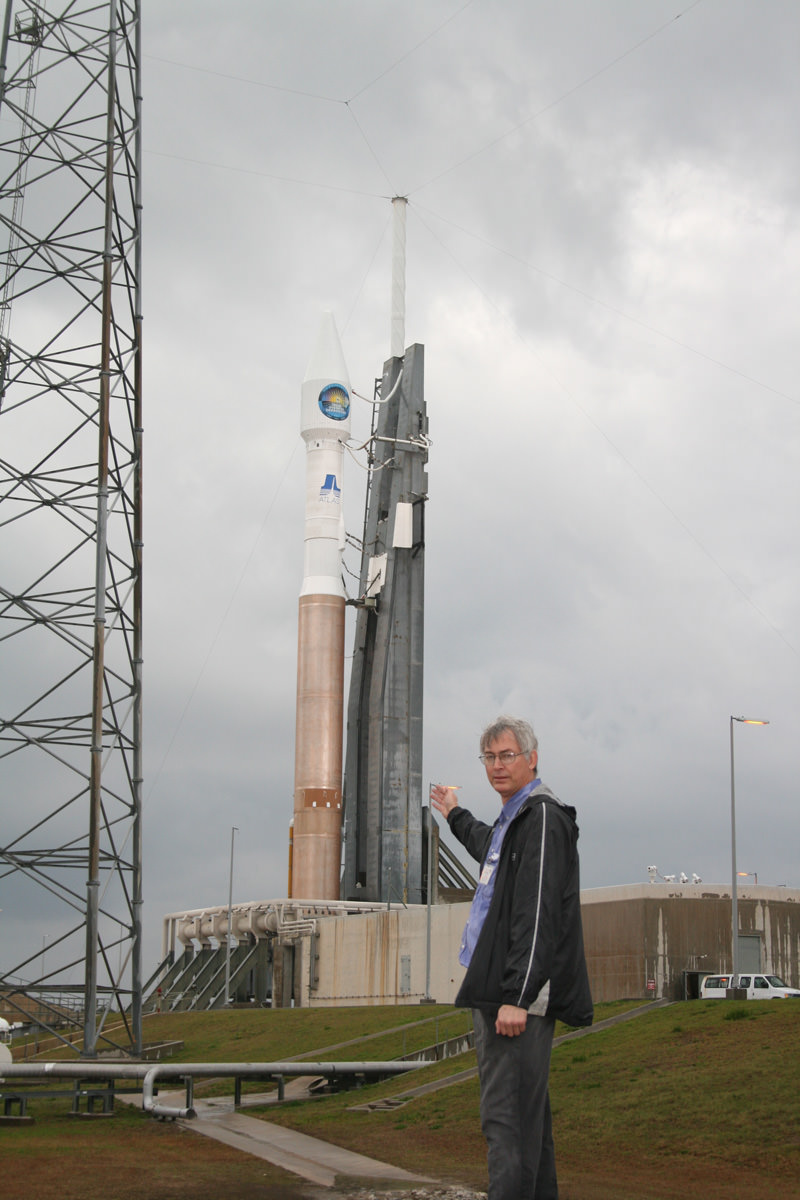
SDO, Atlas V and Ken in ditch below rocket less than 24 hours from blast off. Credit: Ken Kremer
SDO project scientist Dean Pesnell told me in an interview today that “SDO will acquire movies of the entire surface of the Sun on a 24/7 basis with 10 times greater resolution than High Definition. That’s about equivalent in size to an IMAX movie”. The three science instruments will collect a staggering 1.5 terabytes of data per day which is equivalent to downloading 500,000 songs. The data will be beamed back continuously to two dedicated ground stations in New Mexico which were specially constructed for SDO. There are no on board recorders due to the huge volume of data.
“It’s perfect timing to launch and study the sun as it starts the rise to a solar maximum,” according to Pesnell. “The sun patiently waited for us to be ready to launch as we waited for a launch opportunity. After a long period of inactivity, Sun spots recently started appearing at the North Pole. And they also just started at the South Pole”.
“SDO was conceived by the scientists around 1996 and formally approved by NASA in 2002”, Prof. Phillip Scherrer said to me. He is the Principal Investigator for the Helioseismic and Magnetic Imager (HMI) instrument.
“The primary mission phase will last 5 years and hopefully extend out to 10 and perhaps even longer. The longevity depends on the health of the science instruments. Remember SOHO was projected to last 2 years and has now operated for over 15 years ! “
HMI will study the origin of solar variability and attempt to characterize and understand the Sun’s interior and magnetic activity.
Both HMI, and the Atmospheric Imaging Assembly, or AIA, will allow scientists to see the entire disc of the sun in very high resolution — 4,096 by 4,096 mm CCDs. In comparison, a standard digital camera uses a 7.176 by 5.329 mm CCD sensor.
AIA also will image the outer layer of the sun’s atmosphere, while the Extreme ultraviolet Variability Experiment, or EVE, measures its ultraviolet spectrum every 10 seconds, 24 hours a day.
We are now less than 12 hours from launch of SDO, NASA’s “New Eye on the Sun”.
Read my earlier SDO reports, including from on site at the KSC launch pads for both SDO and STS 130.
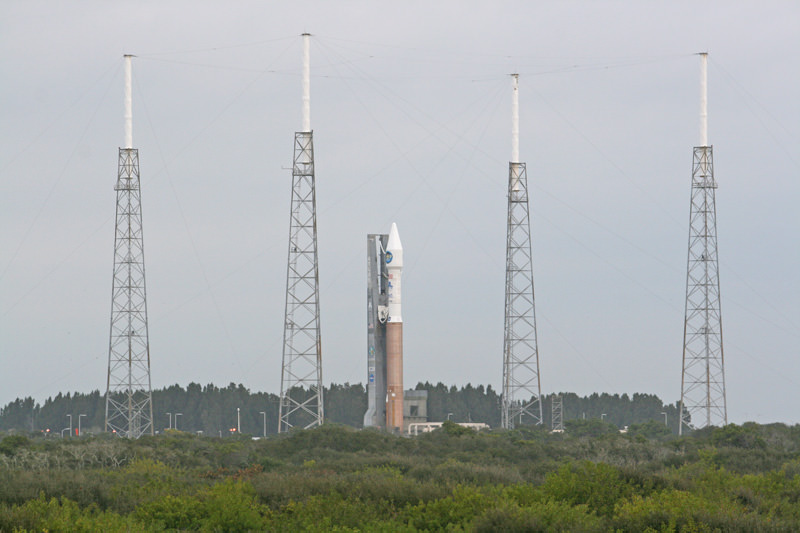
Atlas rocket has been rolled to pad 41 on Feb 8, 2010 and is locked in place surrounded by four lightening masts. Credit: Ken KremerAtlas V rocket begins the 1800 ft rollout from VIF to Pad 41. Credit: Ken Kremer
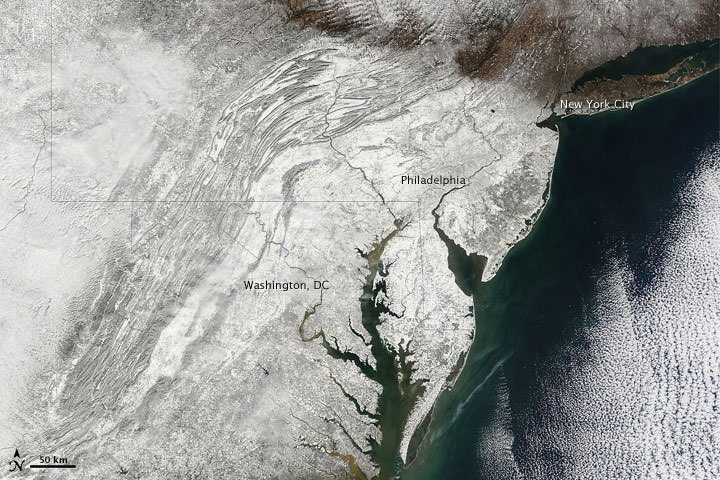
The big snowfall of February 2010 as seen from space. Credit: MODIS Rapid Response Team at NASA GSFC.
[/caption]
Did you live through what has been called “snowmageddon” or “snowpocalypse?” Here’s a satellite’s-eye view of the exceptionally severe winter storm in the Eastern US that dropped several feet of snow on Feb. 6 and 7. Reports of crashed and abandoned cars and hundreds of cancelled flights were interspersed with stories of massive snowball fights. The huge snowfall may hinder highway traffic into midweek, and hundreds of thousands lost electricity. The image comes from the Moderate Resolution Imaging Spectroradiometer (MODIS) on NASA’s Terra satellite. Snow blankets the area hundreds of kilometers inland from the Atlantic coastline.
It happens every winter, and even more so during the recent cold snap here in the US: frequently people say, “Well, so much for global warming! Guess that’s not an issue anymore!” But there’s only one way to respond to that: “WRONG.”
I was going to write an article about the difference between climate and weather, but I came across a great video series on You Tube called Climate Denial Crock of the Week, put together by Peter Sinclair, a longtime advocate of environmental awareness and energy alternatives, and Sinclair says everything better than I could. This video takes the 10-second sound bites used by those who deny climate change is occurring, and intelligently breaks them down one by one. Continue reading “Climate Vs. Weather Video”
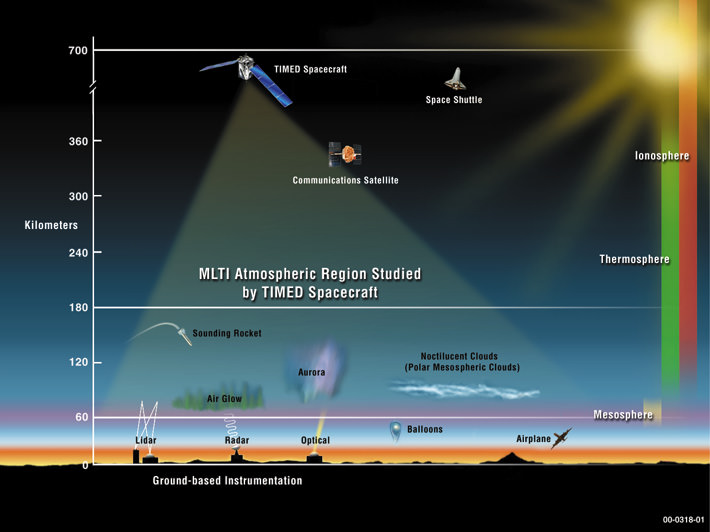
New measurements from a NASA satellite show a dramatic cooling in the upper atmosphere that correlates with the declining activity of the current solar cycle. For the first time, researchers can show a timely link between the Sun and the climate of Earth’s thermosphere, the region above 100 km, an essential step in making accurate predictions of climate change in the high atmosphere. This finding also correlates with a fundamental prediction of climate change theory that says the upper atmosphere will cool in response to increasing carbon dioxide.
Earth’s thermosphere and mesosphere have been the least explored regions of the atmosphere, in fact some have called it the “ignorosphere.” The NASA Thermosphere-Ionosphere-Mesosphere Energetics and Dynamics (TIMED) mission was developed to explore the Earth’s atmosphere above 60 km altitude and was launched in December 2001. One of four instruments on the TIMED mission, the Sounding of the Atmosphere using Broadband Emission Radiometry (SABER) instrument, was specifically designed to measure the energy budget of the mesosphere and lower thermosphere. The SABER dataset now covers eight years of data and has already provided some basic insight into the heat budget of the thermosphere on a variety of timescales.
The extent of current solar minimum conditions has created a unique situation for recent SABER datasets. The end of solar cycle 23 has offered an opportunity to study the radiative cooling in the thermosphere under exceptionally quiescent conditions.
“The Sun is in a very unusual period,” said Marty Mlynczak, SABER associate principal investigator and senior research scientist at NASA Langley. “The Earth’s thermosphere is responding remarkably — up to an order of magnitude decrease in infrared emission/radiative cooling by some molecules.”
The TIMED measurements show a decrease in the amount of ultraviolet radiation emitted by the Sun. In addition, the amount of infrared radiation emitted from the upper atmosphere by nitric oxide molecules has decreased by nearly a factor of 10 since early 2002. These observations imply that the upper atmosphere has cooled substantially since then. The research team expects the atmosphere to heat up again as solar activity starts to pick up in the next year.
While this warming has no implications for climate change in the troposphere, a fundamental prediction of climate change theory is that the upper atmosphere will cool in response to increasing carbon dioxide. Emissions of carbon dioxide may warm the lower atmosphere, but they cool the upper atmosphere, because of the density of the atmospheric layer.
As the atmosphere cools the density will increase, which ultimately may impact satellite operations through increased drag over time.
The SABER dataset is the first global, long-term, and continuous record of the Nitric oxide (NO) and Carbon dioxide (CO2) emissions from the thermosphere.
“We suggest that the dataset of radiative cooling of the thermosphere by NO and CO2 constitutes a first climate data record for the thermosphere,” says Mlynczak.
The TIMED data provide a fundamental climate data record for validation of upper atmosphere climate models which is an essential step in making accurate predictions of climate change in the high atmosphere. SABER provides the first long-term measurements of natural variability in key terms of the upper atmosphere climate. As the TIMED mission continues, these data derived from SABER will become important in assessing long term changes due to the increase of carbon dioxide in the atmosphere.
The findings were presented at the American Geophysical Union fall meeting in San Francisco.