A green laser was used to guide the invisible infrared beam from La Palma to Tenerife as part of an experiment to test a new satellite concept for measuring atmospheric greenhouse gases and turbulence. Credits: ESA
[/caption]
It may have looked like a futuristic scene from Star Wars, but ESA’s latest technique for aiding space exploration might shed some “green light” on greenhouse gases. A recent experiment involving the Spanish Canary Islands was conducted by shooting laser beams from a peak on La Palma to Tenerife. The two-week endeavor not only increased the viability of using laser pulses to track satellites, but increased our understanding of Earth’s atmosphere.
ESA runs an optical ground station in Tenerife for communications links with satellites. The facility is part of a larger astronomical installation Observatorio del Teide run by Instituto de Astrofisica de Canarias. Credit: ESAKnown as infrared differential absorption spectroscopy, the laser method is an accurate avenue to measure trace gases such as carbon dioxide and methane. It is accomplished by linking two Earth-orbiting satellites – one a transmitter and the other a receiver – and examining the atmosphere as the beam passes between the two. As satellites orbit, they both rise and set behind Earth and radio occultation occurs. It’s a time-honored way of employing microwave signals to measure Earth’s atmosphere, but new wave thinking employs shortwave infrared laser pulses. When the correct wavelength is achieved, the atmospheric molecules impact the beam and the resultant data can then be used to establish amounts of trace gases and possibly wind. By different angular repetitions, a vertical picture can be painted which stretches between the lower stratosphere to the upper troposphere.
While it all sounded good on paper – the proof of a working model is when it is tested. Enter ESA’s optical ground station on Tenerife – a facility built on a peak 2390 meters above sea level and part of a larger astronomical installation called the Observatorio del Teide run by the Instituto de Astrofisica de Canarias (IAC).With equipment placed on two islands, the Tenerife location offered the perfect setting to install receiver hardware grafted to the main telescope. The transmitter was then assigned to a nearly identical peak on La Palma. With nothing but 144 kilometers of ocean between them, the scenario was ideal for experimentation.
Over the course of fourteen days, the team of researchers from the Wegener Center of the University of Graz in Austria and the Universities of York and Manchester in the UK were poised to collect this unique data.
The Observatorio del Roque de los Muchachos on the island of La Palma housed the equipment to transmit the infrared signal and green guidance laser across the Atlantic Ocean to the receiving station in Tenerife. The experiment was carried out to test a new satellite mission concept for measuring concentrations of atmospheric carbon dioxide and methane. Credit: ESAWhile the infrared beam wasn’t visible to the unaided eye, the green guidance laser lit up the night during its runs to record atmospheric turbulence. Gottfried Kirchengast from the Wegener Center said, “The campaign has been a crucial next step towards realising infrared-laser occultation observations from space. We are excited that this pioneering inter-island demonstration for measuring carbon dioxide and methane was successful.”
Armin Loscher from ESA’s Future Mission Division added, “It was a challenging experiment to coordinate, but a real pleasure to work with the motivated teams of renowned scientists and young academics.” The experiment was completed within ESA’s Earth Observation Support to Science Element.
NASA put out this video last week and we missed covering it, but this is a very interesting little video that takes you on a narrated global tour of tens of millions of fires detected from space between July 2002 and July 2011. Yes, that’s right, tens of millions of fires on Earth, and these aren’t tiny little campfires — they are big enough to be seen from space. The video was created from new satellite data visualizations, and is combined with satellite views of vegetation and snow cover to show how fires relate to seasonal changes. The research helps scientists understand how fire affects our environment on local, regional and global scales. Continue reading “As the World Burns: Satellites Watch Fires Around the World”
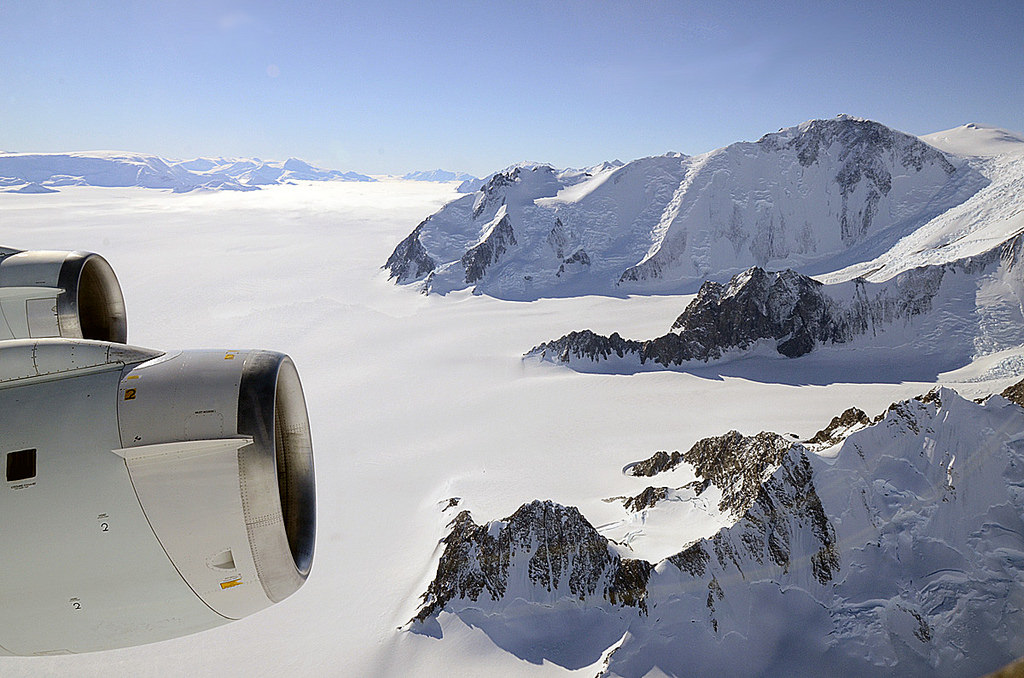
Ice-coated mountaintops of Alexander Island, one of the largest islands off Antarctica. Credit: Michael Studinger/NASA.
[/caption]
Views from the window of NASA’s DC-8 reveal sweeping expanses of ice and rock as part of the ongoing 2011 Operation IceBridge survey of Antarctica’s ice cover.
Now in its third season, Operation IceBridge is a six-year-long mission to study the dynamics of the Antarctic and Arctic ice sheets. It’s the largest ever aerial survey of the polar ice and will yield valuable data on the state of Earth’s vast reservoirs of frozen water, including the land and sea underneath and how they are being affected by today’s rapidly changing climate.
The ridges of the Shackleton Range cast shadows onto Antarctica's ice. Credit: Michael Studinger/NASA.
Researchers – like Michael Studinger, who took the incredible photos seen here – fly over Greenland during the months of March through May and over Antarctica in October and November. NASA’s instrument-laden DC-8 flies over these remote locations at a low altitude of about 1,500 feet, often with little or no advance weather data.
98 percent of Antarctica is covered with ice. Information obtained by Operation IceBridge will be combined with satellite data to create the most accurate models possible of Antarctic ice loss and how it will affect future sea level rise.
Mountains piled with snow and ice rise above the clouds on Alexander Island. Credit: Michael Studinger/NASA.
This season’s Antarctic IceBridge campaign features NASA’s DC-8, at 157 feet long the largest plane in the agency’s airborne research fleet, and will also feature the debut of the Gulfstream V (G-V) operated by the National Science Foundation and National Center for Atmospheric Research.
While the DC-8 flies at low altitudes, the G-V will fly above 30,000 feet to utilize its Land, Vegetation and Ice Sensor (LVIS), which makes detailed topographic studies of the surface.
“With IceBridge, our aim is to understand what the world’s major ice sheets could contribute to sea-level rise. To understand that you have to record how ice sheets and glaciers are changing over time.”
– Michael Studinger, IceBridge project scientist at NASA’s Goddard Space Flight Center in Greenbelt, Md.
The wing of NASA's DC-8 cuts across the frozen expanse of the Brunt Ice Shelf, with its 100-foot-high cliff face. Credit: Michael Studinger/NASA.
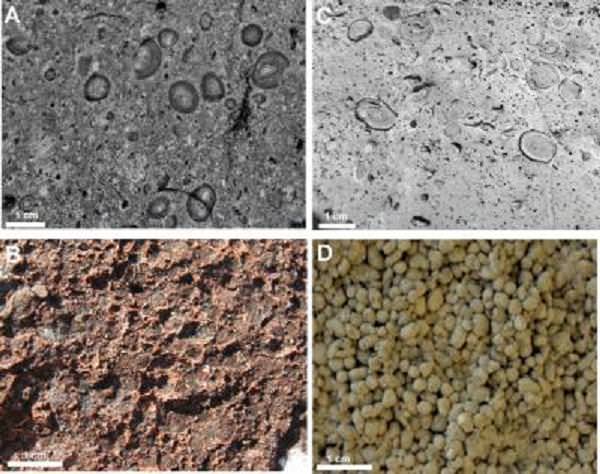
Meteorite impact ejecta (left) compared with volcanic deposits (right) showing closely similar structures made of dust particles. The top two photos show accretionary lapilli in density current deposits, whereas bottom two photos show pellets that formed when dust in the atmosphere clumped together and simply fell onto the land surface. Credit: From Branney and Brown 2011 (Journal of Geology 199, 275-292
[/caption]
Over the last several years, we’ve been treated to television programs which have awakened us to how a crime scene is investigated. It’s a very precise science and one that could very well deepen our understanding of other types of occurrences. Now, new research done by Mike Branney, of the University of Leicester’s Department of Geology, and Richard Brown, University of Durham, are giving us insights as to how massive meteorite strikes in Earth’s past may have reacted much like certain types of volcanic activity.
The two volcanologists have forensically reconstructed an impact event to determine how the ejecta registered on the environment surrounding the scene. Although meteorite strikes are common, direct observation isn’t. However, by carefully sifting through the remains of an event that hasn’t been completely eroded, the scientists were able to forensically reconstruct what happened. Brown and Branney’s findings revealed that a large encounter may have behaved like pryroclastic flow – a devastating cloud of gas and debris from an explosive volcano which speeds across the landscape.
“In particular, the way that ash and dust stick together seems identical. Moist ash from explosive volcanoes sticks together in the atmosphere to fall out as mm-sized pellets.” explains Dr. Branney. “Where these drop back into a hot pyroclastic density current, they grow into larger layered structures, known as accretionary lapilli.”
In this case, the meteorite impact CSI investigation took place in northwest Scotland. There a well-preserved deposit still exists from an event which occurred about a billion years ago. It is very fortunate the site was so pristine, because it still held evidence of both ‘volcanic’ particles – pellets and lapilli. Findings like these will help us to further understand the ramifications of these type of events and how it could affect us, either in the past or the future.
Dr. Brown added: “This reveals that that the 10 meter-thick layer, which has been traced for over 50 km along the Scottish coast, was almost entirely emplaced as a devastating density current that sped outwards from the point of impact – just like a density current from a volcano. Only the uppermost few centimetres actually fell out through the atmosphere.”
Image of the Harding Ice Field on Alaska’s Kenai Peninsula. Credit: US Fish and Wildlife Service
[/caption]
Thanks to a grant from the National Science Foundation, a University of Washington doctoral student named Adam Campbell has been conducting a research on photosynthetic algae. While this simple, light-loving form of life might not seem very important, it very well could have survived the global ice age by hiding in an area similar to the Red Sea.
“Under those frigid conditions, there are not a lot of places where you would expect liquid water and light to occur in the same area, and you need both of those things for photosynthetic algae to survive,” said Campbell.
How could this slice of ice endure against the massive force of a glacier? If there was a thin body of water about six and half times longer than it was wide, it would be possible for it to create enough physical resistance to stop a moving ice sheet. Chances are good that the ice would vaporize before it reached the end of the sea. This means at least enough open water for algae to survive.
“The initial results have shown pretty well that these kinds of channels could remain relatively free of thick glacial ice during a ‘snowball Earth’ event,” Campbell elucidates.
Through the use of an analytical model that simulates environmental conditions theorized to exist somewhere between 800 million and 550 million years ago, Campbell and his team of Edwin Waddington and Stephen Warren, UW professors of Earth and space sciences, were able to simulate ten million years of deep freeze. Their timeline began before the Cambrian explosion about 530 million years ago when Earth quickly changed tactics and became more heterogeneous. However, simple photosynthetic plankton have made their presence known in the records both before and after this studied time period… a presence which made scientists wonder how it could happen if the Earth had been totally covered in ice.
Campbell said it is assumed the algae survived these episodes, “unless they re-evolved each time, which creates a whole different problem for evolutionary biology.”
Why chose the Red Sea as an example? Quite simply put, because it’s perfect. It formed from a tectonic process called continental rifting, existed in the right time line and was correctly globally positioned. Campbell also noted that in a snowball Earth event, the exposed sea would have quickly evaporated if there weren’t a method of refill – such as created by a dam of glacial ice. Just a small amount… like enough to last 10 million years for the algae to take hold.
“Over 10 million years, you could evaporate the deepest lake in the world,” Campbell said. “If you’re in a desert, you’d have to have a supply of sea water.”
Original Story Source: University of Washington News.
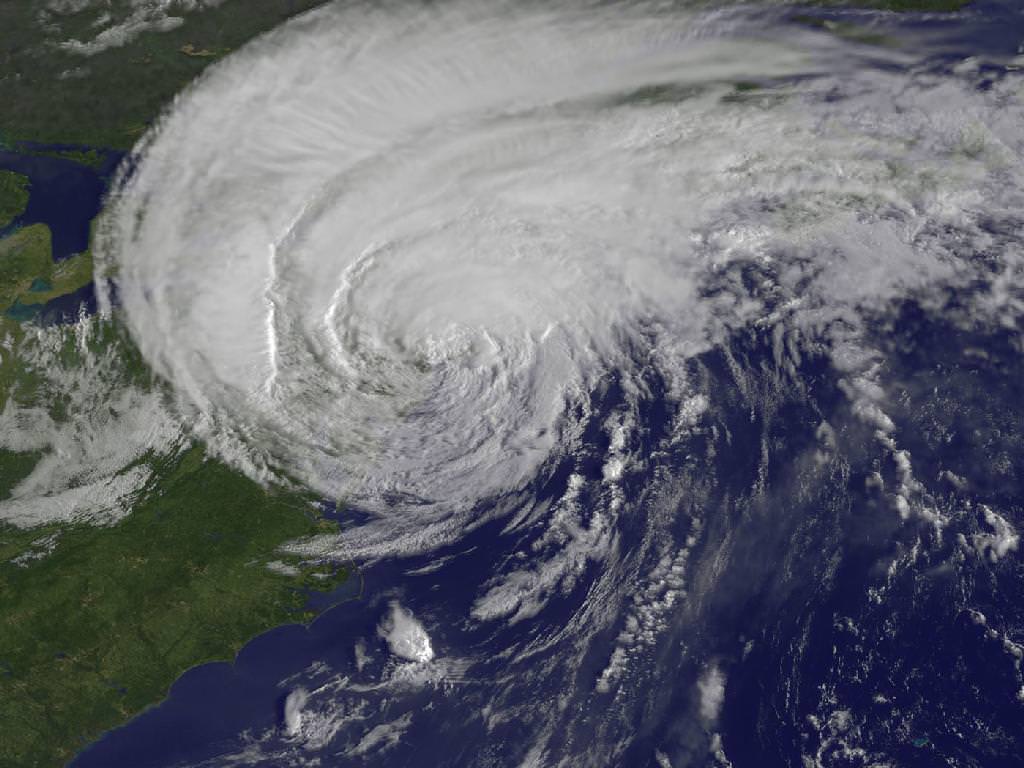
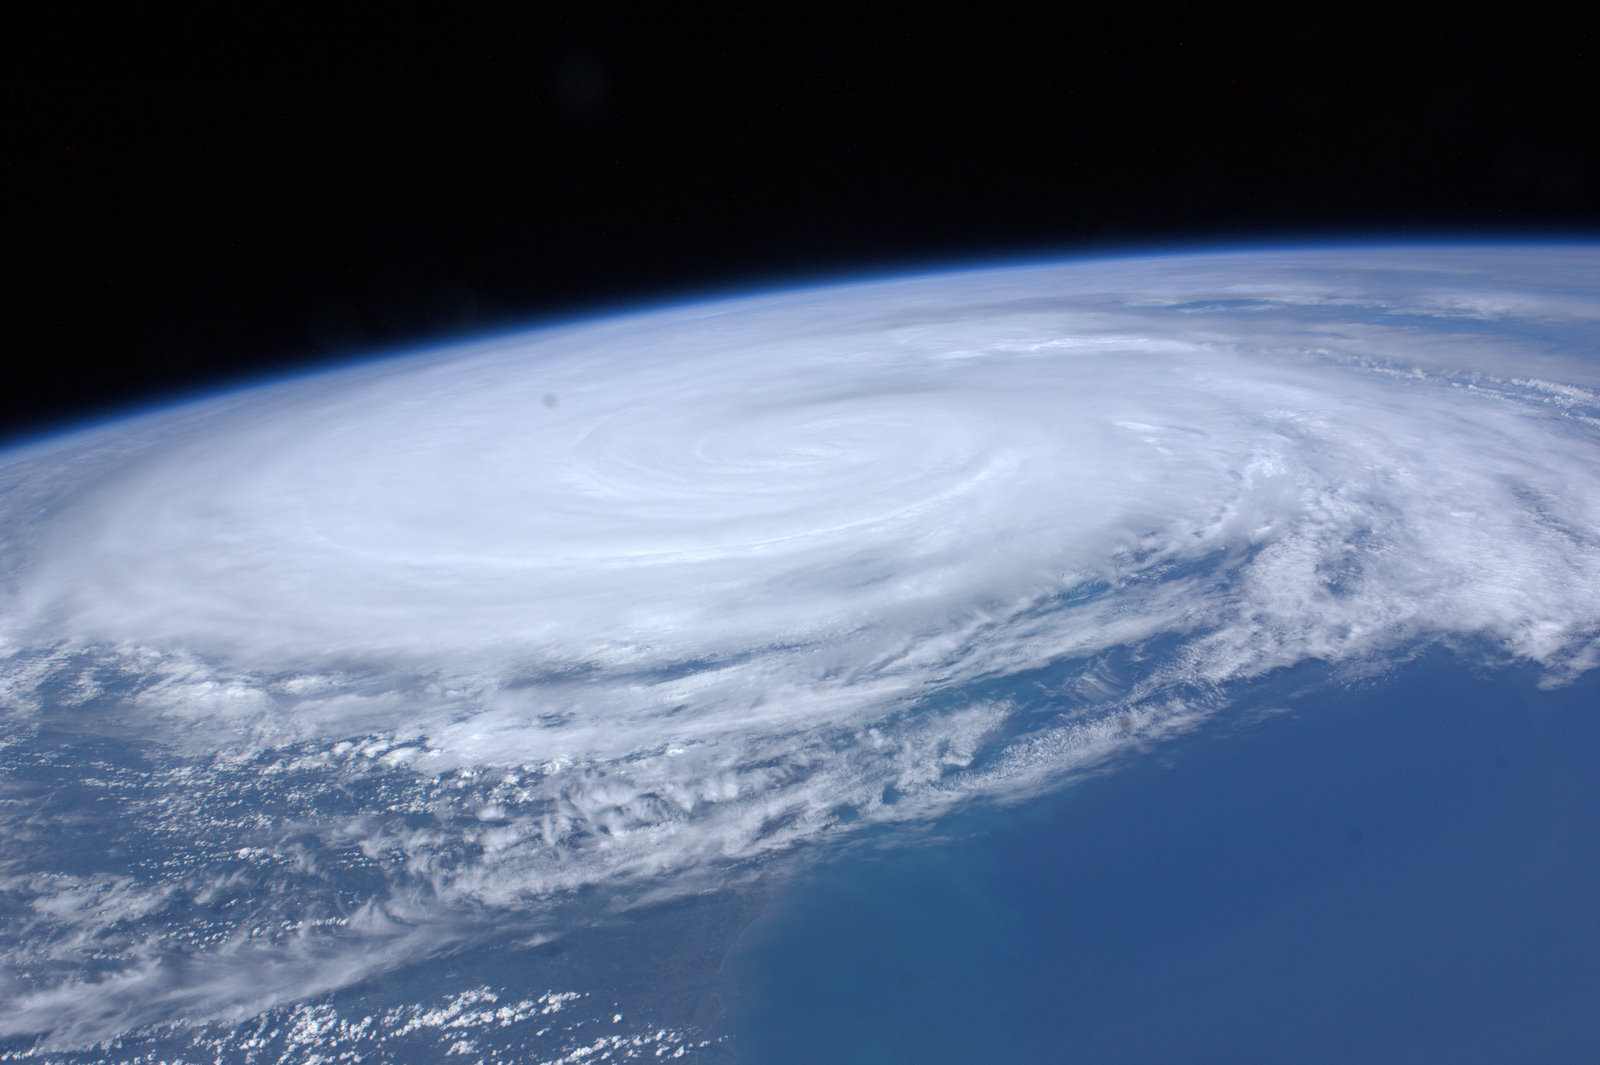
Irene Makes Landfall Over New York. This GOES-13 satellite image is of Hurricane Irene just 28 minutes before the storm made landfall in New York City. The image shows Irene's huge cloud cover blanketing New England, New York and over Toronto, Canada. Shadows in Irene's clouds indicate the bands of thunderstorms that surrounded the storm. Credit: NASA/NOAA GOES Project
NASA Video Caption: The Life of Hurricane Irene from the Caribbean to Canada from August 21 through August 29 seen by NASA/NOAA satellites. Credit: NASA/NOAA/GOES/MODIS
The new NASA animation above shows the birth and subsequent destructive and deadly path followed by Hurricane Irene from August 21 through August 29, 2011 starting in the Caribbean, and then tracking along the US East Cost and up into Canada. The observations combine images taken by NASA and NOAA Earth orbiting satellites.
The cloud images were captured by the NASA/NOAA GOES-13 satellite and overlaid on a true-color NASA MODIS map. Irene followed a lengthy course over Puerto Rico, Hispaniola, the Bahamas, and then along the entire US East with landfalls over North Carolina, New Jersey and New York.
NASA ISS astronaut Ron Garan and cameras flying overhead aboard the International Space Station (ISS) also photographed vivid images showing the magnitude of Irene slamming into the US East coast.
Irene caused widespread property damage. Massive and raging flooding in several US states destroyed houses, crushed businesses and washed away bridges and roads and more. The worst flooding is yet to come to some inland portions of Vermont, New Jersey, New York, Pennsylvania and elsewhere as uncontrollable waters continue to rise at numerous rivers, lakes and even ponds, threatening even more misery in their wake.
[/caption]
So far 41 fatalities in 12 states have been attributed to Irene and more may be expected as searches continue. Some communities have been entirely cut off due to washed out access. Airlifts of food and water have begun. More people are being evacuated from New Jersey towns today, Aug 30.
Brave emergency rescue workers have put their own lives at peril and saved the lives of countless others of all ages from babies to the elderly. Some 8 million customers, including my area, lost power due to extensive flooding, downed trees and electrical wires, and devastated infrastructure.
Hurricane Irene twitpic from the International Space Station on 8/27/11 by NASA Astronaut Ron Garan
Irene From Space and the ISS as it crossed the coast on August 27, 2011 at 3:32pm EST. Hope everyone is OK wrote NASA Astronaut Ron Garan with his twitpic from the ISS. Credit: NASA/Ron Garan aboard the ISS
Emergency crews are hard at work to restore power as quickly as possible, but many thousands of homes and businesses could be without power for up to a week or more. About 3.3 million customers are still without power today.
NASA’s GOES-13 satellite captured a dramatic view of Hurricane Irene just 28 minutes prior to making landfall over New York City. Today’s NASA Image of the day shows the humongous cloud cover spanning the US East coast from the Mid-Atlantic States up to New Jersey, New York, Pennsylvania, and New England and into Toronto, Canada.
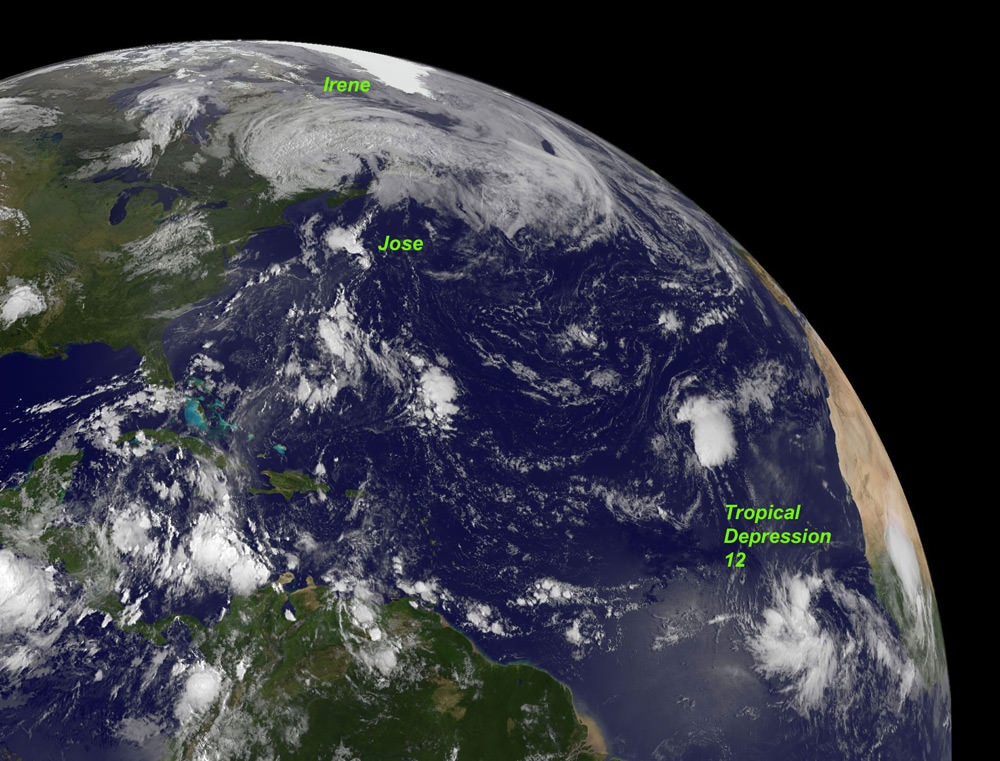
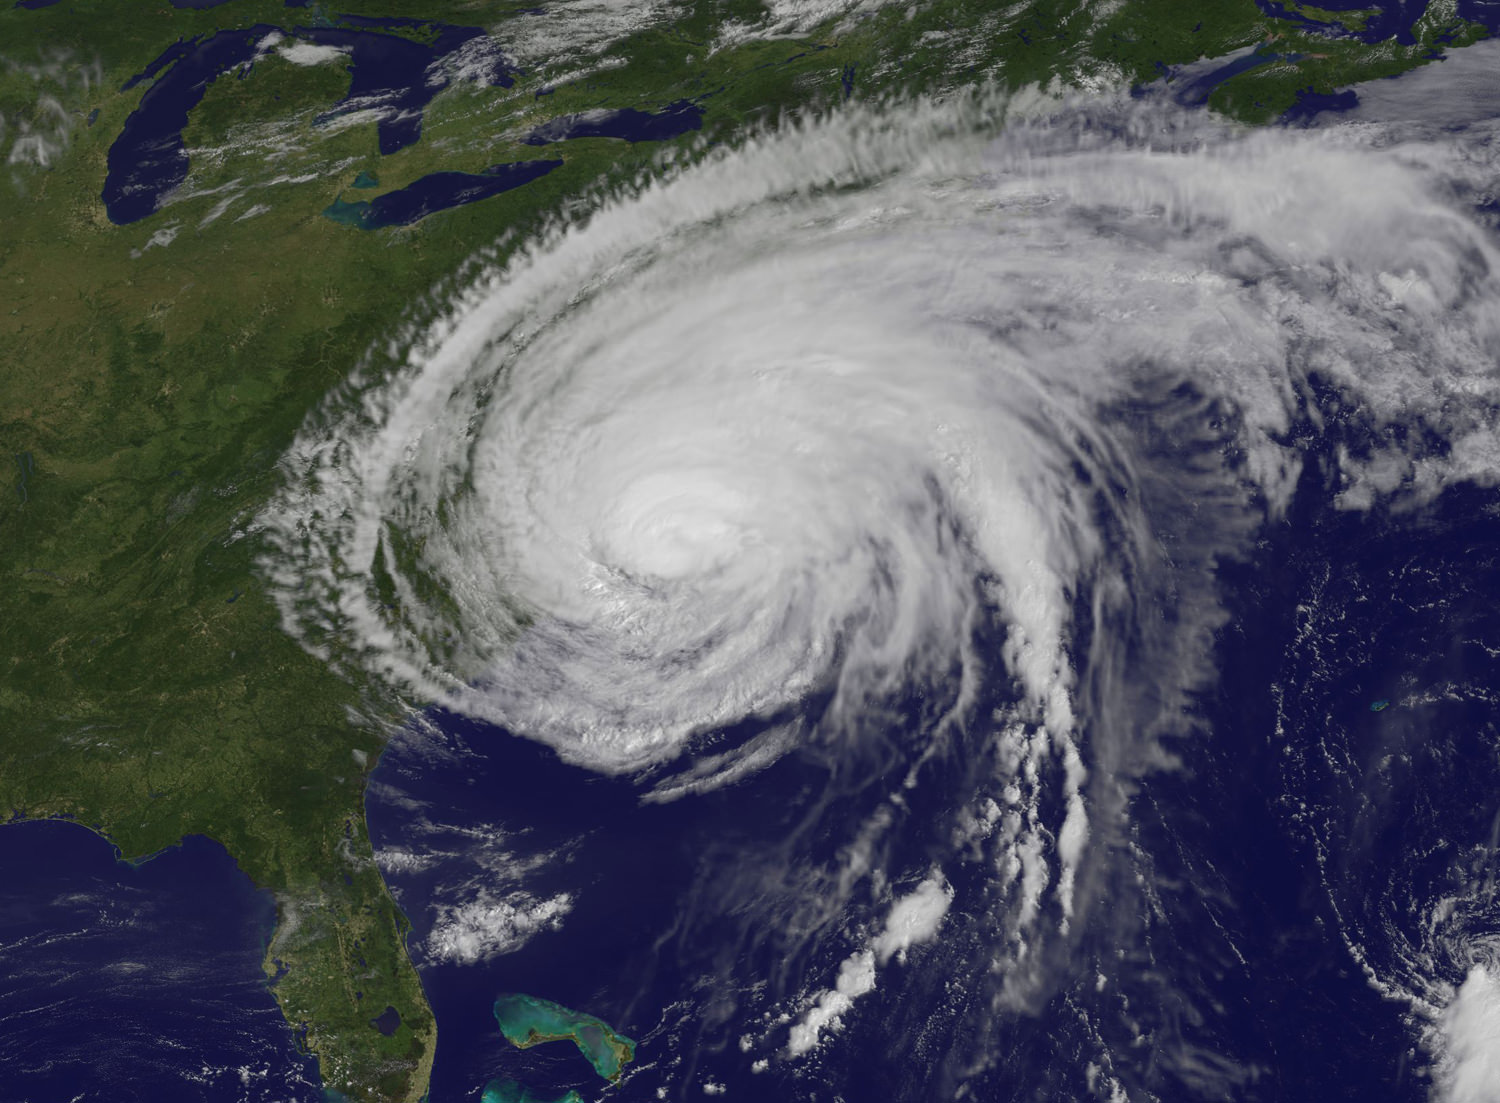
This GOES-13 image from Monday, August 29 at 7:45 a.m. EDT shows an active Atlantic Ocean with the remnants of Hurricane Irene moving into Quebec and Newfoundland (left), Tropical Storm Jose (center) and newly formed Tropical Depression 12 (right). Credit: NASA/NOAA GOES ProjectIrene slams into North Carolina. The GOES-13 satellite saw Hurricane Irene on August 27, 2011 at 10:10 a.m. EDT after it made landfall at 8 a.m. in Cape Lookout, North Carolina. Irene's outer bands had already extended into New England. Credit: NASA/NOAA GOES Project
Many transit systems and airports in Irene’s path were shutdown ahead of the storm.
Send me your photos of Irene’s destruction to post at Universe Today.
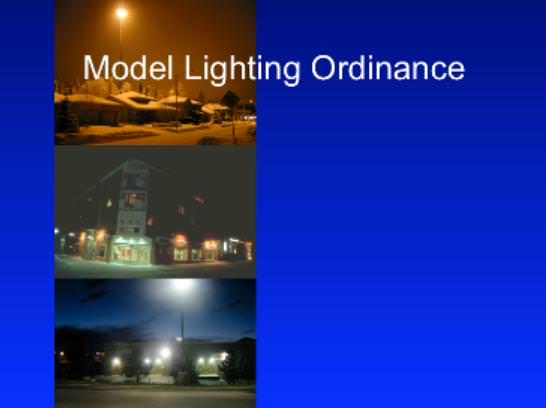
For every astronomer everywhere – and even naturalists – the need to preserve dark skies has been an issue tackled by the International Dark Skies Association for over two decades. It’s more than just asking your neighbor to turn off their porch light while you’re observing. It’s about light pollution as a whole – from government to community lighting. In the past the IDA has relied on education, but now things could be getting a whole lot better.
“IDA and the Illuminating Engineering Society (IES) proudly announce public release of the Model Lighting Ordinance (MLO) as a valuable guide for environmentally responsible outdoor lighting in North America.” says the organization. “Developed jointly by the IDA and the IES over a period of seven years, the IDA/IES partnership will encourage broad adoption of comprehensive outdoor lighting ordinances without devoting extensive staff time and resources to their development.”
In a time of budget cuts and pressure on volunteer time, such programs like the MLO are absolutely invaluable. This guide will enable communities to make responsible decisions about outdoor lighting standards… effectively reducing glare, light trespass, and skyglow. Studies have shown these three culprits of light pollution wreak havoc on more than just astronomy – it affects our own human biorhythms, wildlife and more. By having a standard that’s easy and cost effective to follow, things can be changed.
“The MLO offers several innovations to outdoor lighting regulation, including the use of five lighting zones to classify land use with appropriate lighting levels for each. Zones range from LZ0, designed for pristine natural environments and limited outdoor lighting, to LZ4, for limited application in areas of extensive development in the largest cities. The second innovation limits the amount of light used for each property.” says the group. “Third, the MLO uses the IES’s new TM-15 -11 “BUG” (Backlight, Uplight and Glare) classification of outdoor lighting fixtures to ensure that only well-shielded fixtures are used. No uplight for area and street lighting is allowed in any zone. The MLO will be revised on a regular basis to include new information, feedback from municipalities using it and changes to IES standards.”
Will these new guidelines be adopted by government and industry? You might be surprised at just how well concepts of this type can be accepted when you can show how they are not only cost effective, but energy saving as well. Not everyone around the world reacts in a negative way when asked to cut lighting – especially when they realize a group is tackling major concerns such as security and safety.
Bob Parks, executive director of IDA, hopes for widespread application. “The MLO will give communities the tool they need to control outdoor lighting and the assurance that the outcome will meet the international standards developed by the IES,” states Parks. “The MLO will accelerate adoption of quality outdoor lighting practices in municipalities of all sizes and show planners how to improve the quality of outdoor lighting while saving energy and reducing operating cost.”
Robert Horner, director of public policy for the IES, expresses similar expectations, stating, “The IES is proud to have produced, in partnership with the IDA, the first Model Lighting Ordnance. This will give states and municipalities the ability to enact effective outdoor lighting legislation and codes, while maintaining the necessary lighting quality for a safe and secure lighted environment and meeting all relevant IES standards and practices.”
In the meantime, get involved with your community and the IDA. Our dark skies future starts with you…
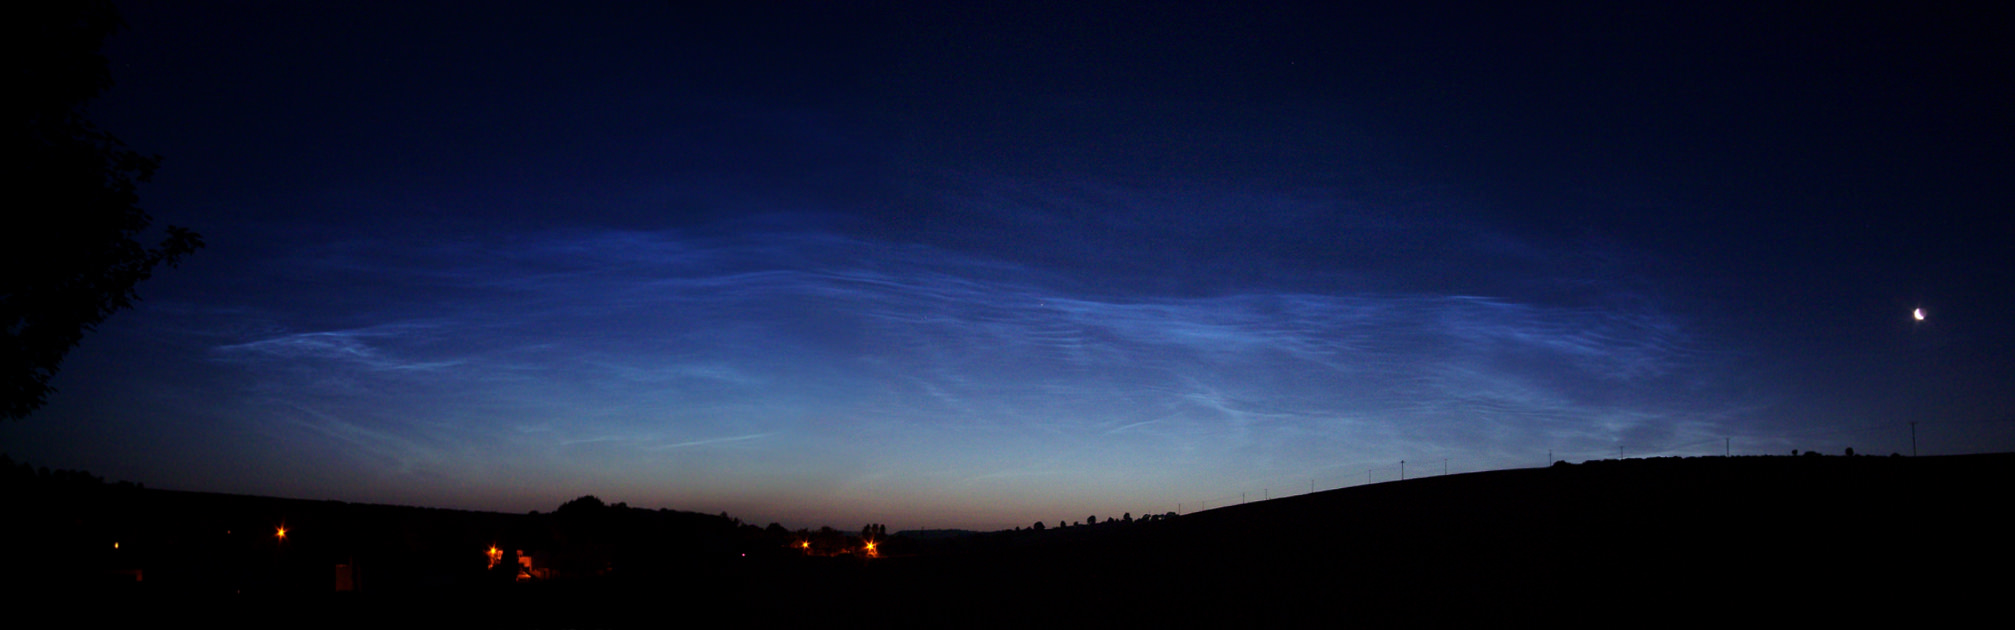
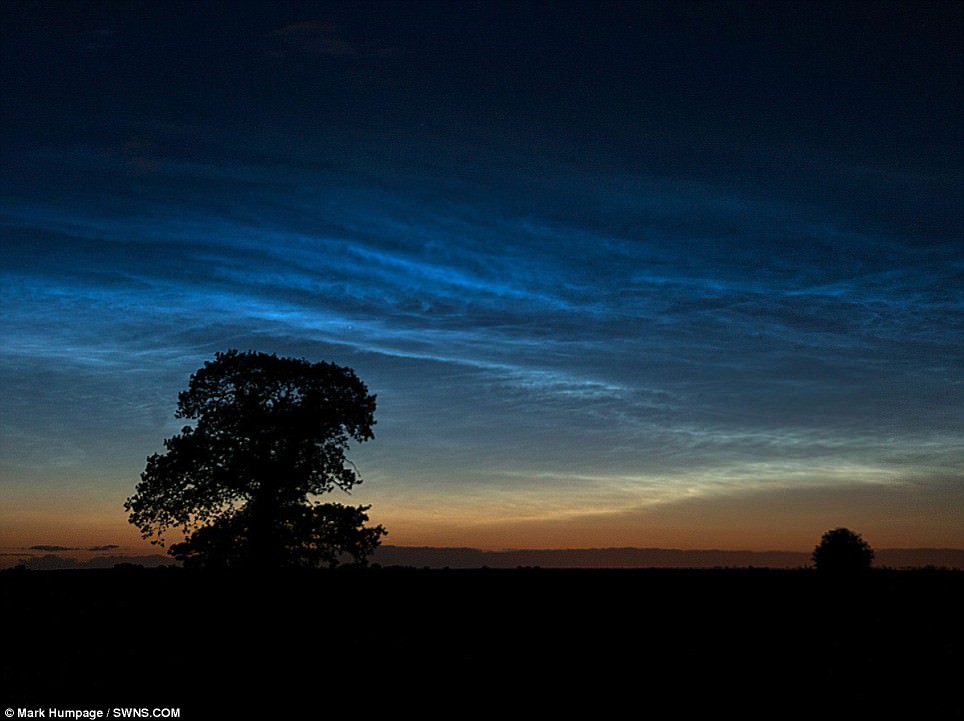
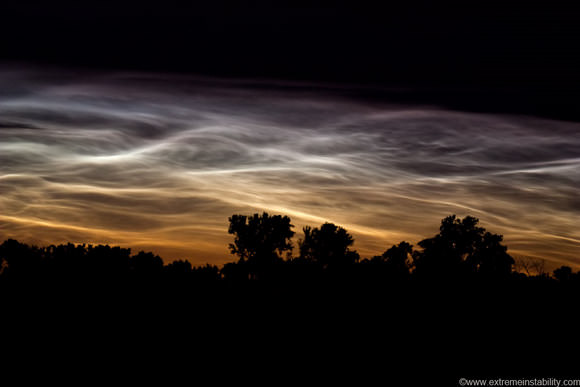
Soon you may see an eerie spectacle on clear summer nights if you are located at latitudes between 50° and 70° north and south of the equator: Noctilucent Clouds.
These ghostly apparitions are a delight to see and are quite rare. It is incredibly difficult to predict exactly when they will appear, but we do know they should begin to appear soon.
The season for Noctilucent Clouds (Noctilucent = Latin for “Night Shining”) starts early June and continues into late July. They are seen just after dusk, or before dawn and an apparition can last around an hour.
These mysterious clouds, with their bizarre tenuous wispy shapes reminiscent of ripples in sand or the changing surface of a pool of water, spread like a glowing web across the northern sky. Colours can range from brilliant whites, with tinges of blue, pink and orange.
Formed by tiny ice crystals, they are the highest clouds in the Earth’s atmosphere, located in the mesosphere at altitudes of around 76 to 85 kilometers (47 to 53 miles) almost at the edge of space.
They are normally too faint to be seen, and are visible only when illuminated by sunlight from below the horizon, while the lower layers of the atmosphere are in the Earth’s shadow. Noctilucent clouds are not fully understood and are a recently discovered meteorological phenomenon, only being recorded for about 120 years.
Noctilucent clouds can only form under very restrictive conditions, and their occurrence can be used as a guide to changes in the upper atmosphere. Since their relatively recent classification, the occurrence of noctilucent clouds appears to be increasing in frequency, brightness and extent.
There is evidence that the relatively recent appearance of noctilucent clouds and their gradual increase, may be linked to climate change. Another recent theory is that some of these bright displays come from particulates and water vapour in the atmosphere left over from Space Shuttle launches.
How can you see them? Over the next couple of months look north during dusk and dawn and try and spot this mysterious and elusive phenomenon. They are best seen when the sun is between 6 and 16 degrees below the horizon, and seem to occur more frequently in the Northern hemisphere than the Southern.
Good luck!
Noctilucent clouds over Blair, Nebraska, USA. Credit: Mike Hollingshead
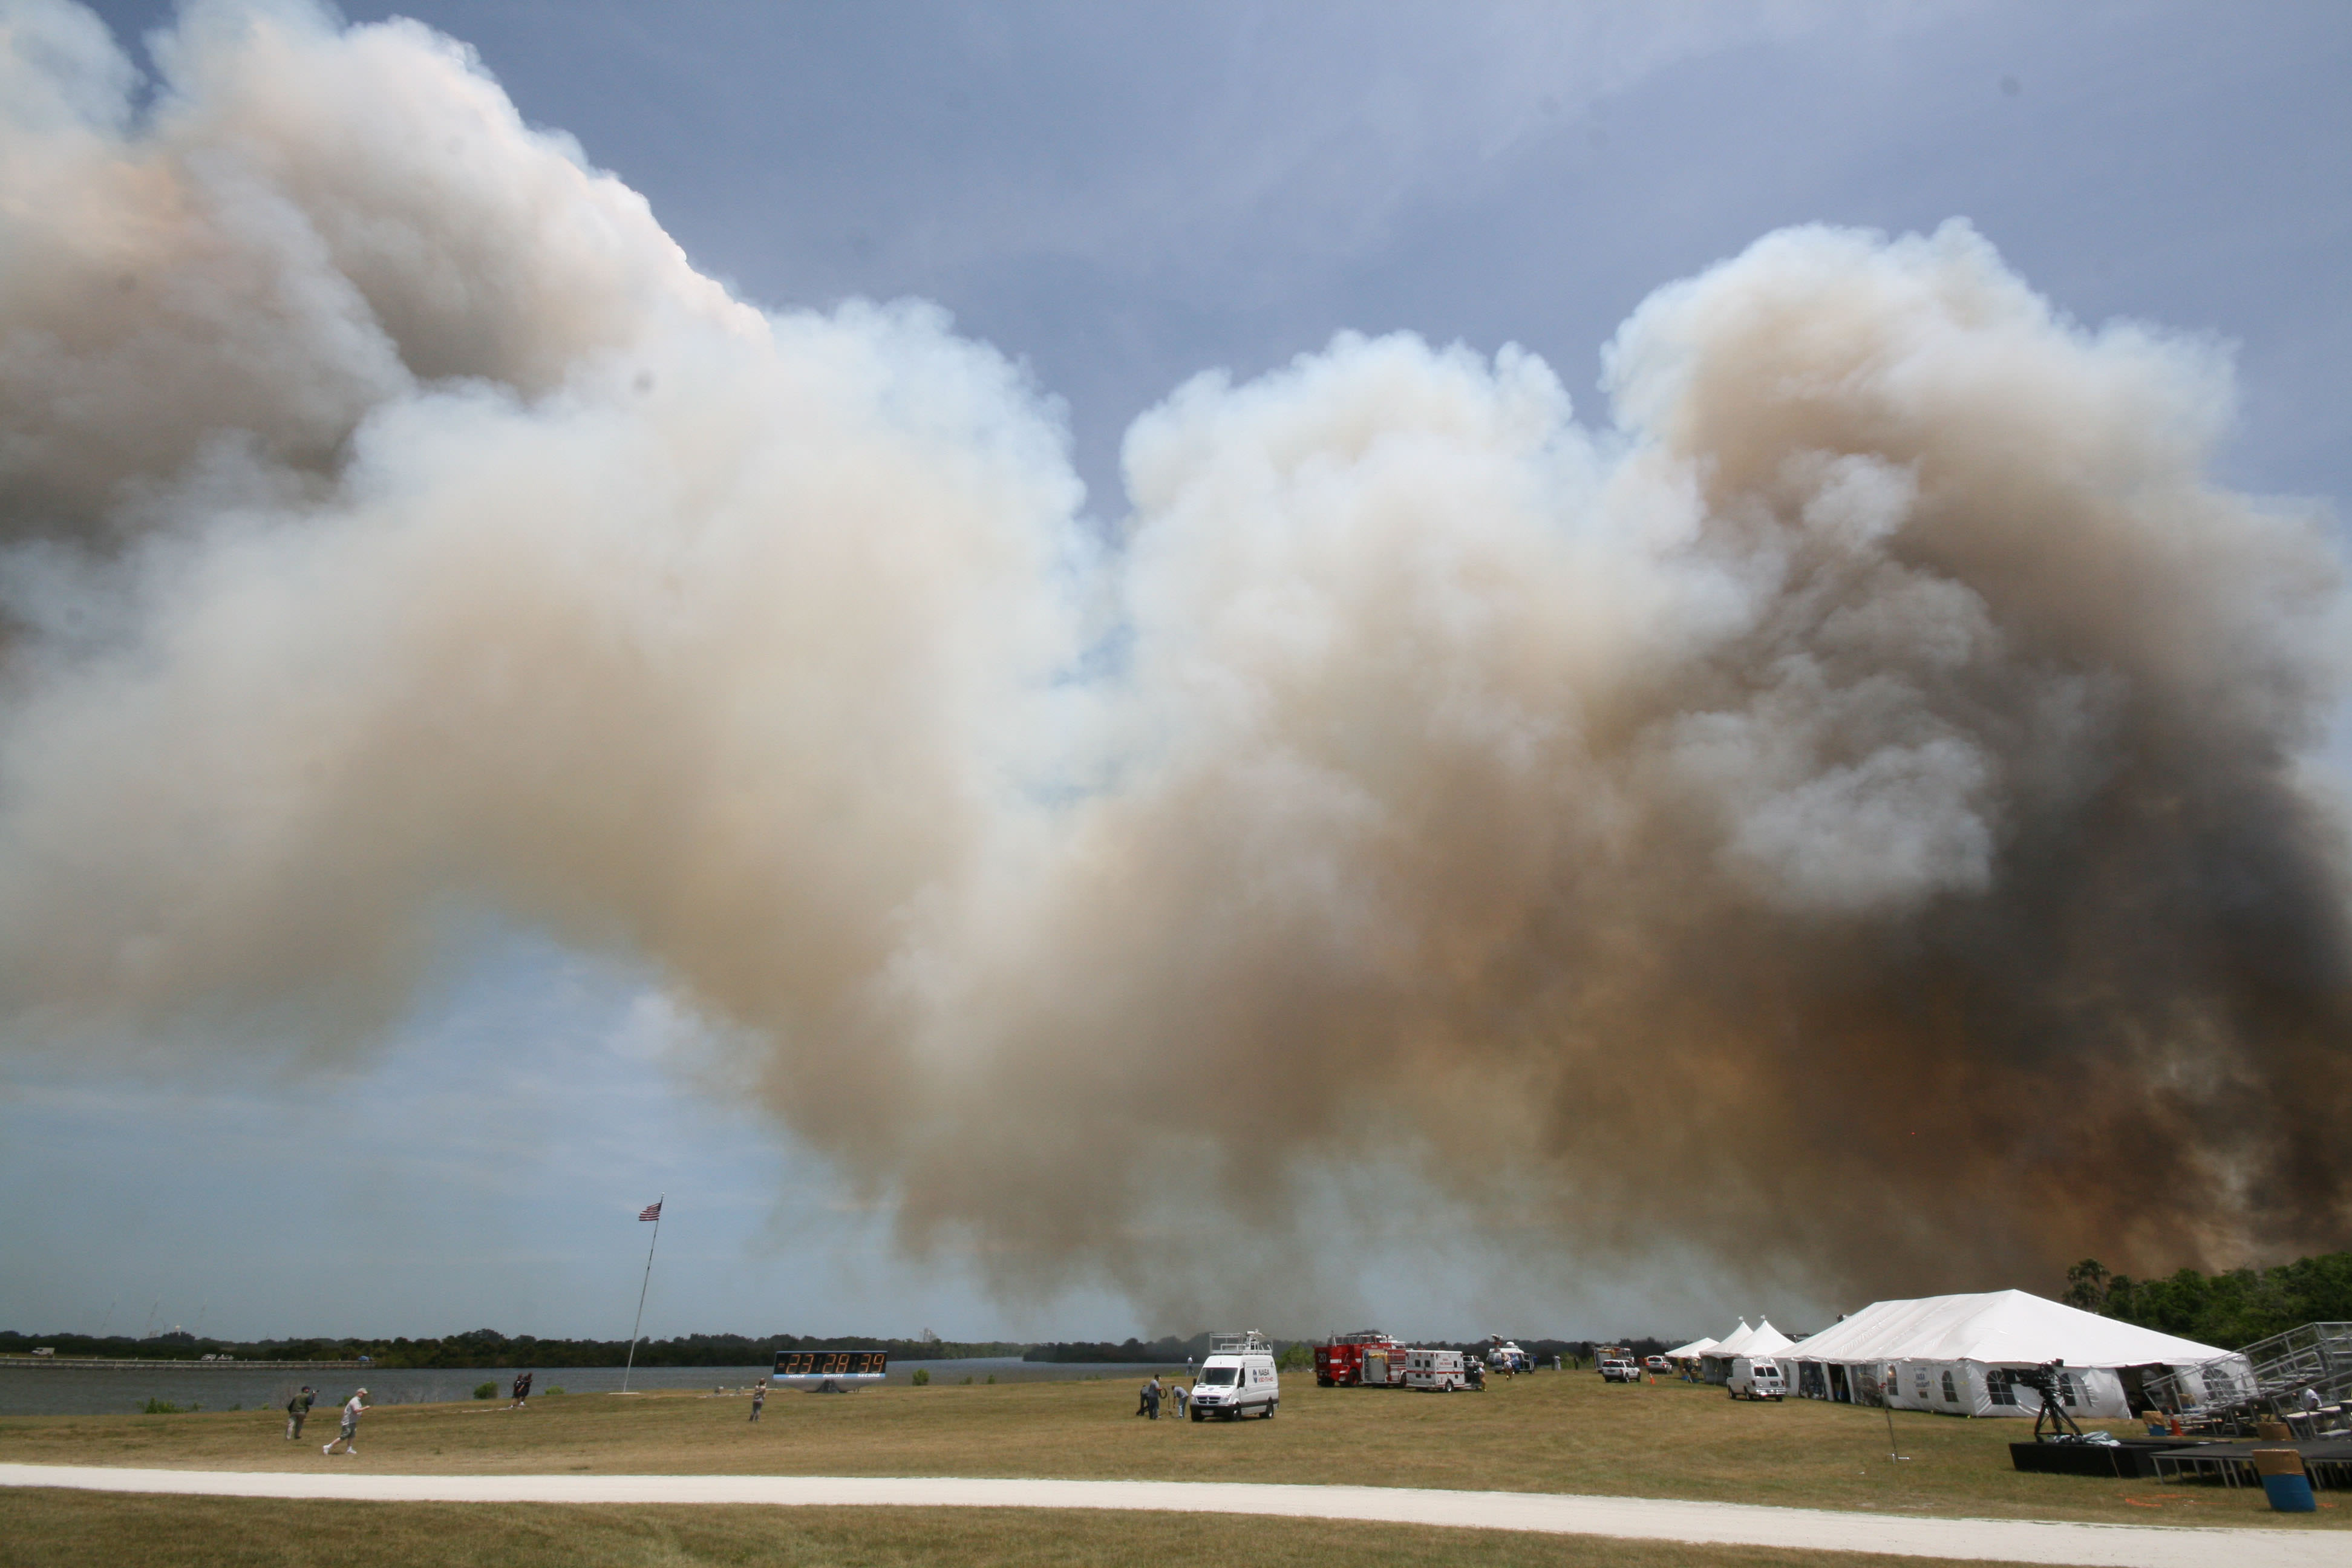
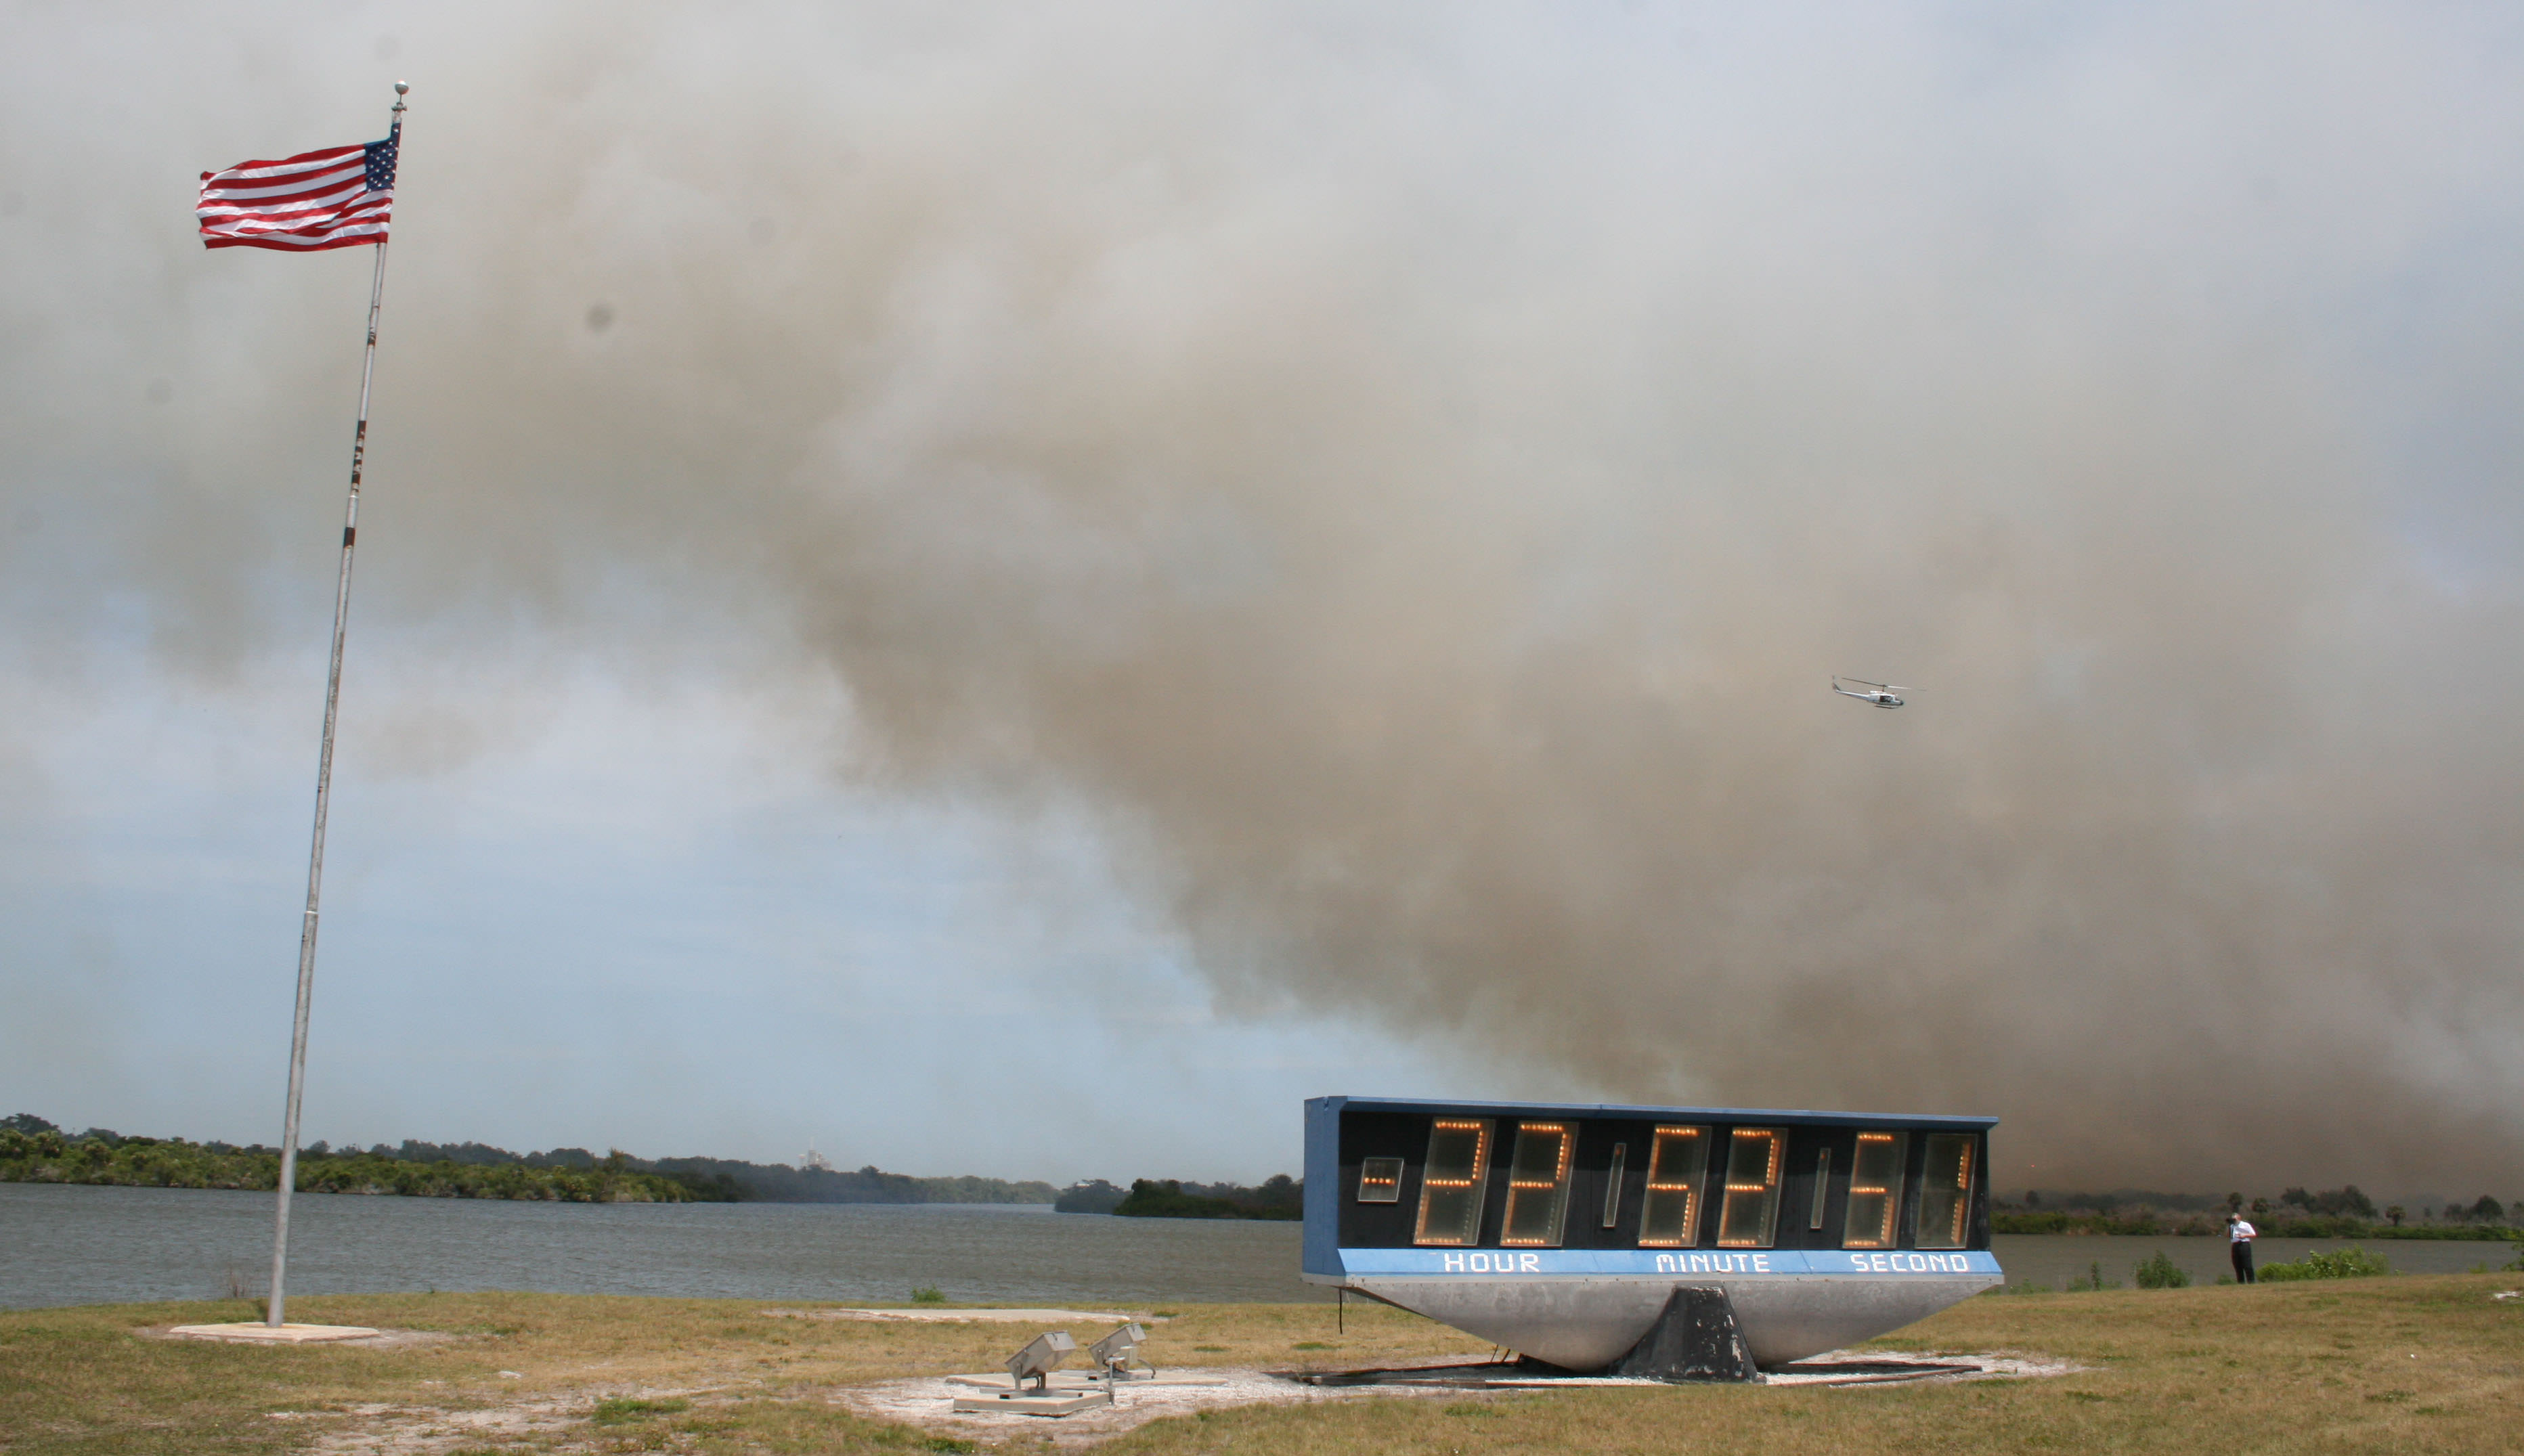
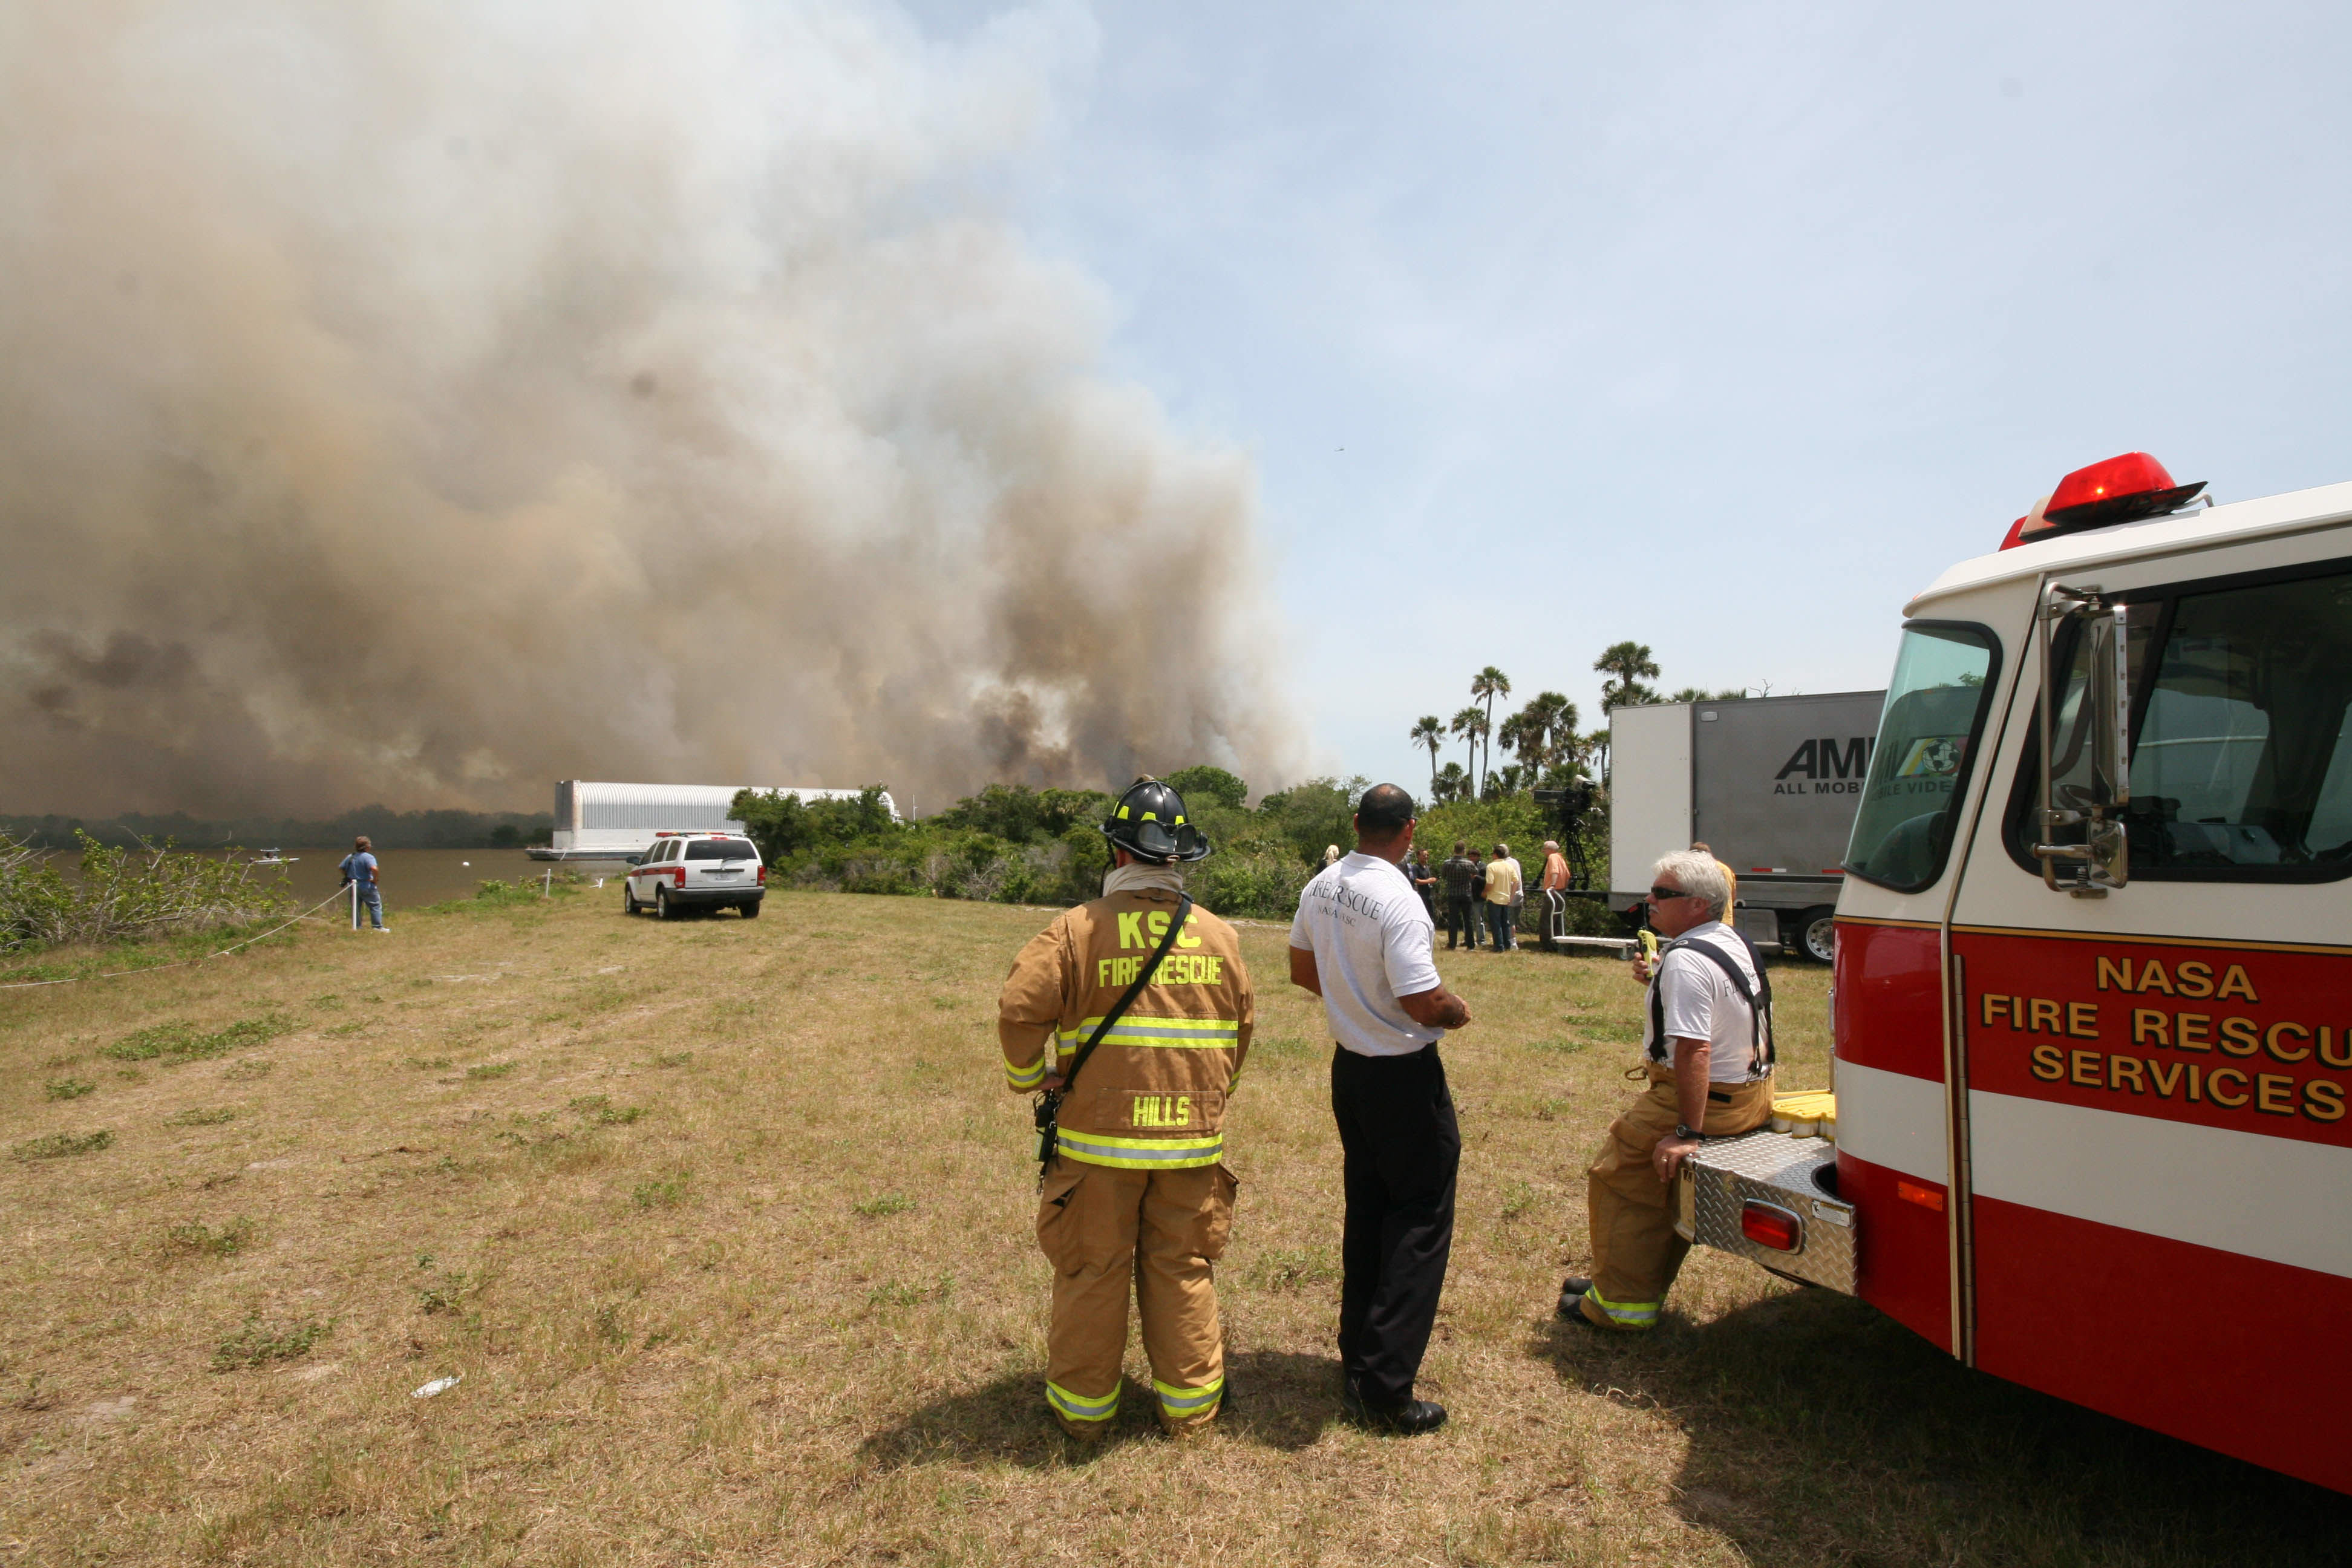
Brush fires send billowing smoke skywards at the Kennedy Space Center on April 27, just 2 days before the last launch of Shuttle Endeavour. Credit: Ken Kremer
[/caption]
KENNEDY SPACE CENTER – A large brush fire suddenly broke out this today (April 27) less than 1 mile fom the Kennedy Space Center (KSC) Press Site in the midst of the countdown to Space Shuttle Endeavour’s last launch, set for this Friday, April 29.
Huge plumes of billowing smoke were sent skyward over the spaceport starting around 1 p.m. from the fires and were spread out over more than 100 acres. The fires erupted at some distance behind the NASA Tweeters tent erected at the press site and were located just 3 miles from the shuttle launch pad. The cause of the fires is unknown but occurred after a long spell of dry weather at KSC.
Brush fire view from the countdown clock at press site at the Kennedy Space Center on April 27. Helicopters dumped water from buckets to bring the fire under control. Credit: Ken Kremer
Helicopters and NASA Firefighters were called in to put out the fires. Fire trucks careened past the countdown clock towards the nearby fire. The helicopters flew back and forth all afternoon dumping buckets of seawater onto the wildfires trying to bring it under control.
“The shuttle launch pad was never in any danger due to the Turn basin in between and it hasn’t impacted any launch operations,” KSC spokesman Allard Beutel told Universe Today.
The Universe Today team of Alan Walters and Ken Kremer witnessed the spectacular and potentially frightening scene first hand and onsite.
It looked like Armageddon all afternoon long and was finally contained tonight. Nothing like this ever occurred so close to a launch and its not clear if the fire would have caused a scrub on launch day. Check out our up close photo album.
NASA Fire truck at the Countdown clock during brushfires at KSC. Credit: Ken KremerNASA Fire brigade responds to KSC brush fire. Credit: Ken KremerFirefighters at KSC brush fire. Credit: Ken KremerA member of the KSC fire crew assesses the fire situation. Credit: Alan Walters.A helicopter flies through the smoke and haze at KSC on April 27 during the brushfire. Credit: Alan Walters.Photographers set up in attempt to photograph Endeavour on the launchpad, but smoke hinders their view. Credit: Alan Walters.Fire at Kennedy Space Center, April 27, 2011. Credit: Alan Walters.
At 8:30 PM on Saturday 26th March 2011, lights will switch off around the globe for Earth Hour and people will commit to actions that go beyond the hour. We need you…
Earth Hour started in 2007 in Sydney, Australia when 2.2 million individuals and more than 2,000 businesses turned their lights off for one hour to take a stand against climate change. Only a year later and Earth Hour had become a global sustainability movement with more than 50 million people across 35 countries/territories participating. Global landmarks such as the Sydney Harbour Bridge, CN Tower in Toronto, Golden Gate Bridge in San Francisco, and Rome’s Colosseum, all stood in darkness, as symbols of hope for a cause that grows more urgent by the hour.
In March 2009, hundreds of millions of people took part in the third Earth Hour. Over 4000 cities in 88 countries/territories officially switched off to pledge their support for the planet, making Earth Hour 2009 the world’s largest global climate change initiative.
On Saturday, March 27th, Earth Hour 2010 became the biggest Earth Hour ever. A record 128 countries and territories joined the global display of climate action. Iconic buildings and landmarks from Asia Pacific to Europe and Africa to the Americas switched off. People across the world from all walks of life turned off their lights and came together in celebration and contemplation of the one thing we all have in common – our planet.
Earth Hour 2011 will take place on Saturday 26 March at 8.30PM (local time). This Earth Hour we want you to go beyond the hour, so after the lights go back on think about what else you can do to make a difference. Together our actions add up.
“All over the world individuals, communities, businesses and governments are creating new examples for our common future – new visions for sustainable living and new technologies to realize it,” said UN Secretary General Ban Ki-moon. “Tomorrow, let us join together to celebrate this shared quest to protect the planet and ensure human well-being. Let us use 60 minutes of darkness to help the world see the light.”