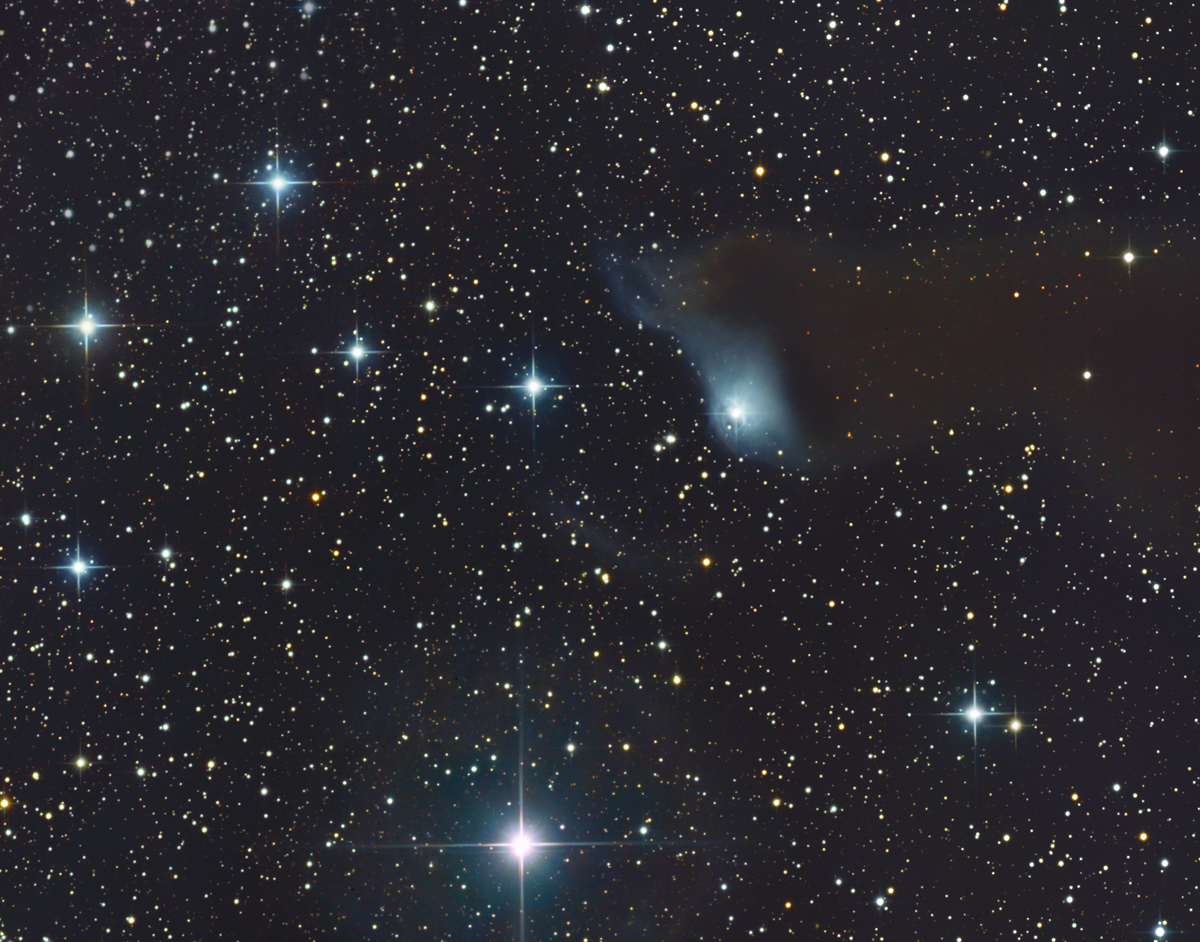
If glancing at this image takes your attention immediately, it should. Not only is it ethereally beautiful and aesthetically pleasing – but it’s shrouded in bizarre cosmological coincidences. Not only do we see a dazzling array of multi-colored stars, but within this single area of space is a hidden an ancient planetary nebula, a reflection nebula, a dark dust cloud, a Bok globule, a peculiar low-mass protostar, the edges of a massive X-ray bubble and the fringes of a supernova remnant. Hold on to the light of the Cepheus Flare and let’s step inside Wolf’s Cave…
In the northern fringe of Cepheus lay an enigmatic gathering of cosmic dust clouds that first gained the attention of astronomers in 1908 when Max Wolf and August Kopff first noticed its complex structure. Using a 28-inch reflector, Wolf took a 2.5 hour exposure of the dusty area which he described as a “long, dark lacuna” and positively identified the reflection nebula cataloged as Sh2-155. His assistant, Kopff, using the same photographic plate, was the first to note the Bok globule which later became cataloged by E.E. Barnard as B175.
Those were wonderful years for astronomy – years when poetic descriptions were still acceptable to the general consensus and Wolf dubbed the area the “Cave Nebula”. But this isn’t a spelunker’s dream, because the radiation emitted from the nearby bright, young OB star would would obliterate any explorer into this thick knot of interstellar dust. But there was one traveler, who dared – a main sequence star whose course took it through the dust maul at nearly 12 km per second. Running headlong into the obscuring mass at nearly supersonic speeds, the star slammed into Bok globule B175, sending shockwaves rippling through the structure and producing collisional excitation and ultraviolet pumping. The result of this cosmic crash was, of course, noted by Wolf in 1908 on his photographic records, but it was while searching high above the Milky Way’s galactic plane in 1934 that this dusty molecular cloud was was spied by Edwin Hubble and became known as the Cepheus Flare.
Together, reflection nebula Cederblad 201 and Bok globule B175 are referred to as van den Berg 152, and sometimes called Lynds Bright Nebula 524. Yet, it is Cederblad 201 itself that so interests modern science. Why? According to studies done by Goicoechea (et al) with the Spitzer Space Telescope, “We present the detection and characterization of a peculiar low-mass protostar (IRAS 22129+7000) located 0.4 pc from the Cederblad 201. The cold circumstellar envelope surrounding the object has been mapped through its 1.2 mm dust continuum emission with IRAM 30 m/MAMBO. The deeply embedded protostar is clearly detected with Spitzer. Given the large near- and mid-IR excess in its spectral energy distribution, but large submillimeter-to-bolometric luminosity ratio (it) must be a transition Class 0/I source and/or a multiple stellar system. Targeted observations of several molecular lines from CO, 13CO, C18O, HCO+, and DCO+ have been obtained. The presence of a collimated molecular outflow mapped with the CSO telescope in the CO line suggests that the protostar/disk system is still accreting material from its natal envelope. Indeed, optically thick line profiles from high-density tracers such as HCO+ show a redshifted absorption asymmetry reminiscent of inward motions. We construct a preliminary physical model of the circumstellar envelope (including radial density and temperature gradients, velocity field, and turbulence) that reproduces the observed line profiles and estimates the ionization fraction. The presence of both mechanical and (nonionizing) far-ultraviolet (FUV) radiative input makes the region an interesting case to study triggered star formation.”
Star formation? Not surprising deep inside the cave of a molecular cloud, but – if you’ll pardon the pun – the plot thickens. The entire complex is about 1400 light years away from us at the perimeter of yet another massive molecular cloud and at the same time it is situated on the frontier of a massive X-ray bubble located between the constellations of Cepheus and Cassiopeia. And that’s not all. Thanks to hydrogen-alpha imaging, the whisper thin strands of an ancient supernova remnant near Cederblad 201 have also been detected.
Like a radioactive roomba, the interstellar dust is being swept up as the expanding debris field moves toward where the Cepheus Flare lights the entrance to Wolf’s Cave. These shocked molecular gas filaments were discovered in 2001 by John Bally and Bo Reipurth and belong to SNR 110.3+11.3 – a unfathomably huge supernova remnant positioned only 1300 light years way – one of the closest known. Add to that the output of ancient planetary nebula Dengel-Hartl 5 and the celestial stew thickens even more. It is estimated all the elements will combine in about a thousand years and the product could very well ignite an incredible burst of star formation.
But, a thousand years is merely a blink of an eye in the grand scheme of things, isn’t it? According to the 2007 studies done of the Wolf’s Cave region by Edwin Bergin and Mario Tafalla; “Cold dark clouds are nearby members of the densest and coldest phase in the Galactic interstellar medium, and represent the most accessible sites where stars like our Sun are currently being born. Newly discovered IR dark clouds are likely precursors to stellar clusters. At large scales, dark clouds present filamentary mass distributions with motions dominated by supersonic turbulence. At small, subparsec scales, a population of subsonic starless cores provides a unique glimpse of the conditions prior to stellar birth. Recent studies of starless cores reveal a combination of simple physical properties together with a complex chemical structure dominated by the freeze-out of molecules onto cold dust grains. Elucidating this combined structure is both an observational and theoretical challenge whose solution will bring us closer to understanding how molecular gas condenses to form stars.”
Carbonates from the planetary nebula, dust, exciting energy, photoelectric heating, polycyclic aromatic hydrocarbons, molecular gas… Where will it all end? What we do know is massive, bright star clusters are created from the giant molecular clouds. Will the Cepheus Torch one day ignite a brilliant stellar display from the mouth of Wolf’s Cave? I wonder…
The awesome photo for this story was provided by AORAIA member, Kent Wood. We thank you for the use of this splendid image!
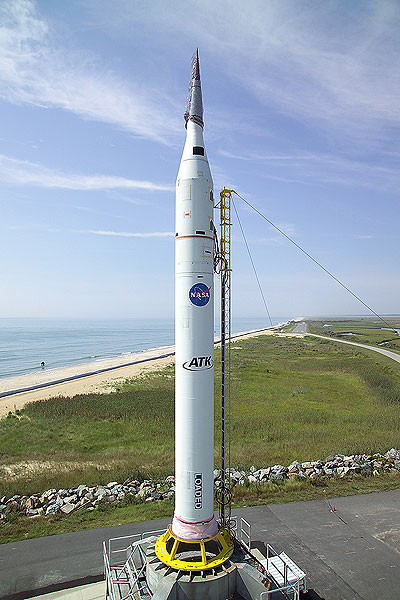
This ATK rocket exploded shortly after liftoff on Friday. Credit: Jacob Owen | NASA Wallops Flight Facility
[/caption]
Update: NASA said at a press conference this morning that launch officials were forced to destroy the rocket less than 30 seconds after it’s 5:10 a.m. launch. The rocket had veered off-course, although they couldn’t say how far, and they had to terminate the flight at about 12,000 feet.
A suborbital rocket carrying experiments conducted by NASA exploded early Friday morning 27 seconds after launch on Wallops Island in Virginia. The ATK (Alliant Tech Systems) rocket lifted off with no apparent problems at 5:10 a.m. NASA said no property damage or injuries have occurred, but there were conflicting reports as to whether debris had been sighted on land. NASA said it believes that most of the debris landed in the Atlantic Ocean.
NASA said the debris potentially could be hazardous. People who spot debris are being asked to call Wallops Emergency Operations Center at 757-824-1300.
“NASA is very disappointed in this failure but has directed its focus on protecting public safety and conducting a comprehensive investigation to identify the root cause,” the agency said in a statement. NASA is assembling a multidiscipline team, along with ATK of Salt Lake City, Utah to begin the investigation promptly.
The payload was a 5-in-1 experiment on hypersonic flight, air breathing engines and a rocket recovery system.
Space Spa on Galactic Suite Hotel. Credit: Galactic Suite
[/caption]
The space tourism company Galactic Suite already has 38 reservations made by tourists who, the company says, in 2012 will travel on board a magnetically levitated spacecraft to an orbiting luxury hotel, complete with a floating spa, pictured here. The trip, which costs 3 million Euros, will provide four days in orbit 450 kilometers above the earth and includes 18 weeks of training on a Caribbean island for the tourists to prepare for their spaceflight. The Galactic Suite Spaceport is being built on the island and features the first maglev rocket where the spacecraft will accelerate to speeds up to 1,000 km/h (620 mph) in 10 seconds and lift off from a vertical runway.
Galactic Suite Spaceport. Credit: Galactic Suite
After reaching approximately the speed of sound, the spaceship will detach from its maglev carrier and accelerator, and will ascend to orbit using rocket or air-breathing engines. The maglev accelerator will then brake to a stop and return to its starting point for the next launch. The launch track will be about 3 kilometers long.
According to Xavier Claramunt and Marsal Gifra, founders of Galactic Suite, “Maglev launch assist technology will enable space tourists to travel to our space resorts in orbit on a commercial basis. The most expensive part of any space travel to low-Earth orbit is the first few seconds – getting off the ground. This technology is cost competitive with other forms of space transportation, environmentally friendly and inherently safeâ€.
The stay at the hotel will “offer a mixed programme of reflection and exercise to seize the unique physical conditions encountered in space,” said Claramunt.
One of the most innovative experiences that tourists can experience is the bathroom in zero gravity. Galactic Suite has developed the space spa. Inside the spa, tourists can float with 20 liters of water bubbles. According to Galactic Suite materials, “The tourist, already trained to avoid the effects of water in a state of weightlessness, can play with the bubble dividing it into thousands of bubbles in a never-ending game. In addition, the transparent sphere may be shared with other guests.”
Galactic Suite is a private space tourism company, founded in Barcelona in 2006. The company hopes to make space tourism available to the general public and “will combine an intensive program of training astronauts to relax with a programme of activities on a tropical island as a process preparation to space travel.”
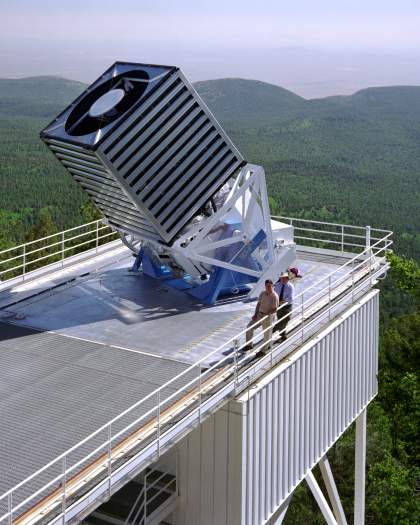
The 2.5 meter SDSS telescope at Apache Point Observatory in New Mexico. Credit: SDSS
Recently we’ve had articles on Universe Today that have discussed the outer Milky Way Galaxy, dark matter, and the discovery of a new minor planet. These articles have a common thread: The discoveries all come from the Sloan Digital Sky Survey (SDSS). If you aren’t familiar with SDSS, it encompasses a comprehensive survey lasting more than eight years, which has so far covered more than one-quarter of the sky.
Using a dedicated 2.5 meter telescope equipped with a 125- megapixel digital camera and spectrographs that can observe 640 stars and galaxies at a time, the SDSS has created terabytes of data that include thousands of deep, multi-color images. It’s also measured the distances to nearly one million galaxies and over 100,000 quasars to create the largest ever three-dimensional maps of cosmic structure.
The SDSS archive represents a thousand-fold increase in the total amount of data that astronomers have collected to date. But almost equally impressive is the easy-to-use interface that allows anyone in the world to access the SDSS data online. Whether you are a research astronomer looking for information to help solve a cosmological puzzle or an armchair astronomy enthusiast who just likes looking at pretty pictures of the universe, SDSS is at your disposal.
Astronomers gathered in Chicago earlier this week to celebrate the accomplishments and look ahead to the future of SDSS. “What amazes me is the huge range of the discoveries that have come from SDSS data,” said SDSS-II Director Richard Kron, an astronomer at the University of Chicago and Fermilab. “We designed it primarily as a survey to map the distribution of galaxies and quasars, but it’s also had a huge impact on the study of stars, the structure of our own Galaxy, and even solar system objects.”
SDSS has found new dwarf companion galaxies to the Milky Way, confirmed Einstein’s prediction of cosmic magnification, and observed the largest known structures in the universe. The new survey, SDSS-III, will continue to expand our horizons with new studies of the structure and origins of the Milky Way Galaxy and the nature of dark energy.
SDSS was undertaken to update the database of information about the sky with current technology. The previous comprehensive guide to the heavens was the Palomar Sky Survey that was conducted in the 1950’s and used glass photographic plates to store the data.
Not only has SDSS updated the technology, but it has changed the way astronomers do business. Astronomers who are doing research or have a question can look at the existing data in SDSS rather than having to pore through the sky, taking their own data with hard-to-get telescope time.
Dr. Pamela Gay, professor at Southern Illinois University Edwardsville and host of the Astronomy Cast podcast said SDSS not only helps her research, but enhances her work in the classroom. “It’s a wonderful project,” she said. “I’m at a small state university and while I did my dissertation on galaxies, when I landed at a state school, I thought I’d never be able to do this (study galaxies) again because I don’t have access to a large telescope. But because of the Sloan Digital Sky Survey, and because of the easy to use tools where I can say to my undergraduate students, ‘go find all the data on these clusters,’ it’s possible for people at small schools to do amazing, amazing research and explore the entire universe.”
SDSS also powers the popular Galaxy Zoo website, where anyone in the world can help classify galaxies via the internet. From the work done by the public from their home computers, Galaxy Zoo has submitted peer reviewed research articles to astronomical journals.
Visit the SDSS website to take a look at the images and discoveries made possible by this comprehensive survey. The Sky Server interface on the SDSS website provides the tools you need to start perusing the universe, and has educational activities for teachers and students as well.
Jim Gunn, SDSS Project Scientist from Princeton University, who has guided the project since its inception said that more than any single discovery, he is proud of the quality and scope of the SDSS data sets. “Visible light is where we understand the universe best, but when we began the SDSS, there were no sensitive, well characterized, visible-light catalogs that covered a large area of sky,” he said. “Now we have multi-color images of 300 million celestial objects, 3-dimensional maps and detailed properties of well over a million of them, and it’s all publicly available online. That changes everything.”
[/caption]
The Sun and the Moon are the two objects in the Solar System that influence Earth the most. Let’s take a look at all the different was we experience these two objects, how they’re similar, and how they’re mostly different.
The Size of the Sun and the Moon
In absolute terms, the Sun and the Moon couldn’t be more different in size. The Sun measures 1.4 million km across, while the Moon is a mere 3,474 km across. In other words, the Sun is roughly 400 times larger than the Moon. But the Sun also happens to be 400 times further away than the Moon, and this has created an amazing coincidence.
From our perspective, the Sun and the Moon look almost exactly the same size. This is why we can have solar eclipses, where the Moon passes in front of the Sun, just barely obscuring it from our view.
And this is just a coincidence. The gravitational interaction between the Moon and the Earth (the tides) are causing the Moon to slowly drift away from the Earth at a rate of 3.8 centimeters per year. In the ancient past, the Moon would have looked much larger than the Sun. And in the far future, the Moon will look much smaller. It’s just a happy coincidence that they look the same size from our perspective.
Gravity from the Sun and the Moon
Once again, the Sun is much larger and has a tremendous amount of mass. The mass of the Sun is about 27 million times more than the mass of the Moon. It’s this gravitational interaction that gives the Earth its orbit around the Sun, and the tiny pull of the Moon just causes the Earth to wobble a bit in its movements.
When the Sun and the Moon are pulling on the Earth from the same direction, their gravity adds up, and we get the largest spring tides. And then, when they’re on opposite sides of the Earth, their forces cancel out somewhat, and we get neap tides.
Light from the Sun and the Moon
This is a bit of a trick, since the Sun is the only object in the Solar System actually giving out light. With its enormous mass, the Sun is able to fuse hydrogen into helium at its core, generating heat and light. This light shines in the Solar System, and bounces off the Moon so we can see it in the sky.
Astronomers measure brightness using a measurement called magnitude. The star Vega was considered 0 magnitude, and the faintest star you can see with the unaided eye is about 6.5 magnitude. Venus can get as bright as -3.7, the full Moon is -12.6, and the Sun is -26.73. These numbers sound similar, but it’s a logarithmic scale, where each value is twice the amount of the previous one. 1 is twice as bright as 2, etc.
So the Sun is actually 450,000 times brighter than the Moon. From our perspective.
Composition of the Sun and the Moon
Now here’s where the Sun and the Moon differ. The Sun is almost entirely composed of hydrogen and helium. The Moon, on the other hand, was formed when a Mars-sized object crashed into the Earth billions of years ago. Lighter material from the collision collected into an object in orbit – the Moon. The Moon’s crust is primarily oxygen, silicon, magnesium, iron, calcium, and aluminium. Astronomers think the core is metallic iron with small amounts of sulfur and nickel. And it’s at least partly molten.
[/caption]
We’ve all wondered at some point or another what mysteries our Solar System holds. After all, the eight planets (plus Pluto and all those other dwarf planets) orbit within a very small volume of the heliosphere (the volume of space dominated by the influence of the Sun), what’s going on in the rest of the volume we call our home? As we push more robots into space, improve our observational capabilities and begin to experience space for ourselves, we learn more and more about the nature of where we come from and how the planets have evolved. But even with our advancing knowledge, we would be naive to think we have all the answers, so much still needs to be uncovered. So, from a personal point of view, what would I consider to be the greatest mysteries within our Solar System? Well, I’m going to tell you my top ten favourites of some more perplexing conundrums our Solar System has thrown at us. So, to get the ball rolling, I’ll start in the middle, with the Sun. (None of the following can be explained by dark matter, in case you were wondering… actually it might, but only a little…)
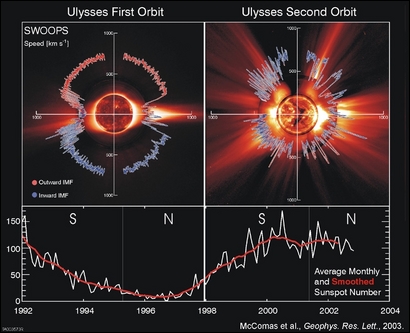
10. Solar Pole Temperature Mismatch
Data from Ulysses (D. McComas)
Why is the Sun’s South Pole cooler than the North Pole? For 17 years, the solar probe Ulysses has given us an unprecedented view of the Sun. After being launched on Space Shuttle Discovery way back in 1990, the intrepid explorer took an unorthodox trip through the Solar System. Using Jupiter for a gravitational slingshot, Ulysses was flung out of the ecliptic plane so it could pass over the Sun in a polar orbit (spacecraft and the planets normally orbit around the Sun’s equator). This is where the probe journeyed for nearly two decades, taking unprecedented in-situ observations of the solar wind and revealing the true nature of what happens at the poles of our star. Alas, Ulysses is dying of old age, and the mission effectively ended on July 1st (although some communication with the craft remains).
However, observing uncharted regions of the Sun can create baffling results. One such mystery result is that the South Pole of the Sun is cooler than the North Pole by 80,000 Kelvin. Scientists are confused by this discrepancy as the effect appears to be independent of the magnetic polarity of the Sun (which flips magnetic north to magnetic south every 11-years). Ulysses was able to gauge the solar temperature by sampling the ions in the solar wind at a distance of 300 million km above the North and South Poles. By measuring the ratio of oxygen ions (O6+/O7+), the plasma conditions at the base of the coronal hole could be measured.
Mars, just a normal planet. No mystery here... (NASA/Hubble)
Why are the Martian hemispheres so radically different? This is one mystery that had frustrated scientists for years. The northern hemisphere of Mars is predominantly featureless lowlands, whereas the southern hemisphere is stuffed with mountain ranges, creating vast highlands. Very early on in the study of Mars, the theory that the planet had been hit by something very large (thus creating the vast lowlands, or a huge impact basin) was thrown out. This was primarily because the lowlands didn’t feature the geography of an impact crater. For a start there is no crater “rim.” Plus the impact zone is not circular. All this pointed to some other explanation. But eagle-eyed researchers at Caltech have recently revisited the impactor theory and calculated that a huge rock between 1,600 to 2,700 km diameter can create the lowlands of the northern hemisphere (see Two Faces of Mars Explained).
Bonus mystery: Does the Mars Curse exist? According to many shows, websites and books there is something (almost paranormal) out in space eating (or tampering with) our robotic Mars explorers. If you look at the statistics, you would be forgiven for being a little shocked: Nearly two-thirds of all Mars missions have failed. Russian Mars-bound rockets have blown up, US satellites have died mid-flight, British landers have pock-marked the Red Planet’s landscape; no Mars mission is immune to the “Mars Triangle.” So is there a “Galactic Ghoul” out there messing with our ‘bots? Although this might be attractive to some of us superstitious folk, the vast majority of spacecraft lost due to The Mars Curse is mainly due to heavy losses during the pioneering missions to Mars. The recent loss rate is comparable to the losses sustained when exploring other planets in the Solar System. Although luck may have a small part to play, this mystery is more of a superstition than anything measurable (see The “Mars Curse”: Why Have So Many Missions Failed?).
8. The Tunguska Event
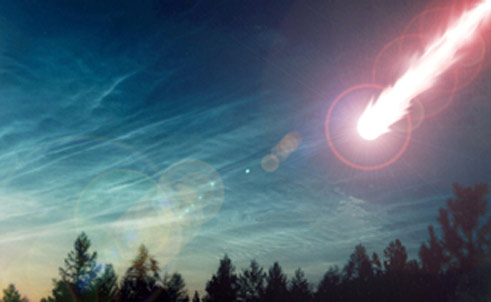
Artist impression of the Tunguska event (www.russianspy.org)
What caused the Tunguska impact? Forget Fox Mulder tripping through the Russian forests, this isn’t an X-Files episode. In 1908, the Solar System threw something at us… but we don’t know what. This has been an enduring mystery ever since eye witnesses described a bright flash (that could be seen hundreds of miles away) over the Podkamennaya Tunguska River in Russia. On investigation, a huge area had been decimated; some 80 million trees had been felled like match sticks and over 2,000 square kilometres had been flattened. But there was no crater. What had fallen from the sky?
This mystery is still an open case, although researchers are pinning their bets of some form of “airburst” when a comet or meteorite entered the atmosphere, exploding above the ground. A recent cosmic forensic study retraced the steps of a possible asteroid fragment in the hope of finding its origin and perhaps even finding the parent asteroid. They have their suspects, but the intriguing thing is, there is next-to-no meteorite evidence around the impact site. So far, there doesn’t appear to be much explanation for that, but I don’t think Mulder and Scully need be involved (see Tunguska Meteoroid’s Cousins Found?).
7. Uranus’ Tilt
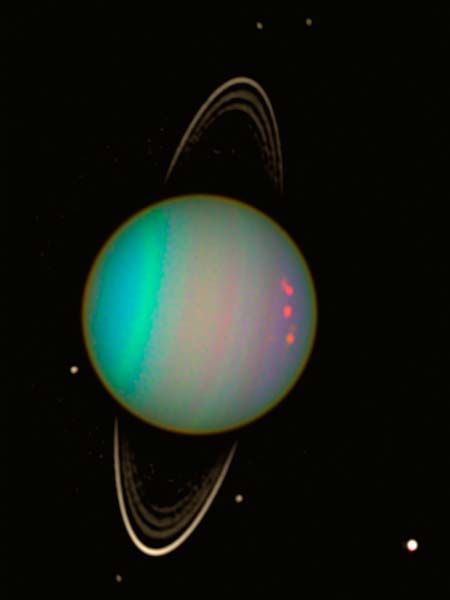
Uranus. Does it on its side (NASA/Hubble)
Why does Uranus rotate on its side? Strange planet is Uranus. Whilst all the other planets in the Solar System more-or-less have their axis of rotation pointing “up” from the ecliptic plane, Uranus is lying on its side, with an axial tilt of 98 degrees. This means that for very long periods (42 years at a time) either its North or South Pole points directly at the Sun. The majority of the planets have a “prograde” rotation; all the planets rotate counter-clockwise when viewed from above the Solar System (i.e. above the North Pole of the Earth). However, Venus does the exact opposite, it has a retrograde rotation, leading to the theory that it was kicked off-axis early in its evolution due to a large impact. So did this happen to Uranus too? Was it hit by a massive body?
Some scientists believe that Uranus was the victim of a cosmic hit-and-run, but others believe there may be a more elegant way of describing the gas giant’s strange configuration. Early in the evolution of the Solar System, astrophysicists have run simulations that show the orbital configuration of Jupiter and Saturn may have crossed a 1:2 orbital resonance. During this period of planetary upset, the combined gravitational influence of Jupiter and Saturn transferred orbital momentum to the smaller gas giant Uranus, knocking it off-axis. More research needs to be carried out to see if it was more likely that an Earth-sized rock impacted Uranus or whether Jupiter and Saturn are to blame.
6. Titan’s Atmosphere
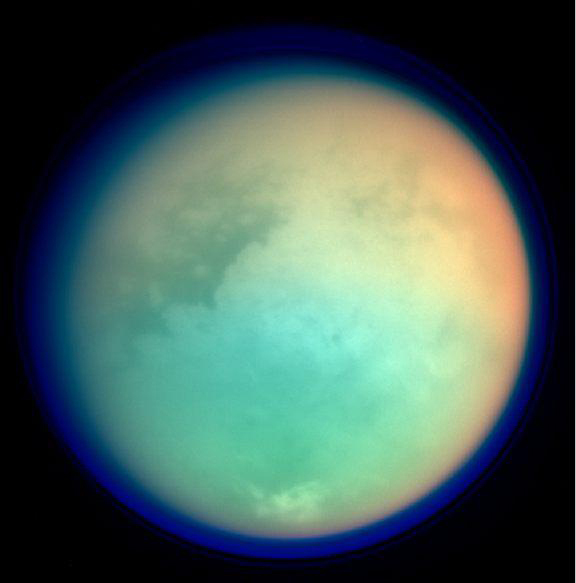
False colour image of Titan's atmosphere. Credit: NASA/JPL/Space Science Institute/ESA
Why does Titan have an atmosphere? Titan, one of Saturn’s moons, is the only moon in the Solar System with a significant atmosphere. It is the second biggest moon in the Solar System (second only to Jupiter’s moon Ganymede) and about 80% more massive than Earth’s Moon. Although small when compared with terrestrial standards, it is more Earth-like than we give it credit for. Mars and Venus are often cited as Earth’s siblings, but their atmospheres are 100 times thinner and 100 times thicker, respectively. Titan’s atmosphere on the other hand is only one and a half times thicker than Earth’s, plus it is mainly composed of nitrogen. Nitrogen dominates Earth’s atmosphere (at 80% composition) and it dominates Titans atmosphere (at 95% composition). But where did all this nitrogen come from? Like on Earth, it’s a mystery.
Titan is such an interesting moon and is fast becoming the prime target to search for life. Not only does it have a thick atmosphere, its surface is crammed full with hydrocarbons thought to be teeming with “tholins,” or prebiotic chemicals. Add to this the electrical activity in the Titan atmosphere and we have an incredible moon with a massive potential for life to evolve. But as to where its atmosphere came from… we just do not know.
5. Solar Coronal Heating
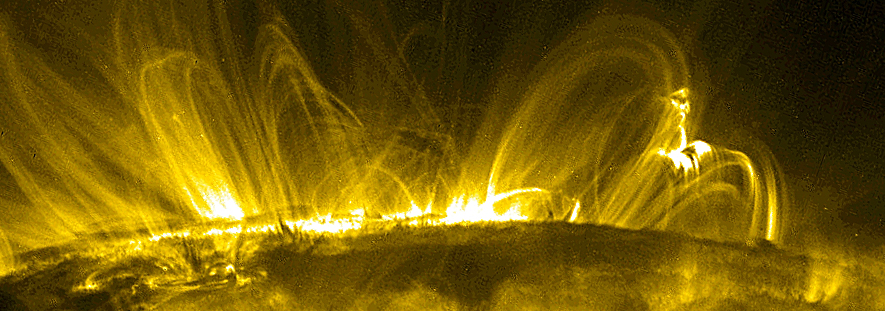
Coronal loops as imaged by TRACE at 171 Angstroms (1 million deg C) (NASA/TRACE)
Why is the solar atmosphere hotter than the solar surface? Now this is a question that has foxed solar physicists for over half a century. Early spectroscopic observations of the solar corona revealed something perplexing: The Sun’s atmosphere is hotter than the photosphere. In fact, it is so hot that it is comparable to the temperatures found in the core of the Sun. But how can this happen? If you switch on a light bulb, the air surrounding the glass bulb wont be hotter than the glass itself; as you get closer to a heat source, it gets warmer, not cooler. But this is exactly what the Sun is doing, the solar photosphere has a temperature of around 6000 Kelvin whereas the plasma only a few thousand kilometres above the photosphere is over 1 million Kelvin. As you can tell, all kinds of physics laws appear to be violated.
However, solar physicists are gradually closing in on what may be causing this mysterious coronal heating. As observational techniques improve and theoretical models become more sophisticated, the solar atmosphere can be studied more in-depth than ever before. It is now believed that the coronal heating mechanism may be a combination of magnetic effects in the solar atmosphere. There are two prime candidates for corona heating: nanoflares and wave heating. I for one have always been a huge advocate of wave heating theories (a large part of my research was devoted to simulating magnetohydrodynamic wave interactions along coronal loops), but there is strong evidence that nanoflares influence coronal heating too, possibly working in tandem with wave heating.
Although we are pretty certain that wave heating and/or nanoflares may be responsible, until we can insert a probe deep into the solar corona (which is currently being planned with the Solar Probe mission), taking in-situ measurements of the coronal environment, we won’t know for sure what heats the corona (see Warm Coronal Loops May Hold the Key to Hot Solar Atmosphere).
4. Comet Dust
Comets - where does their dust come from?
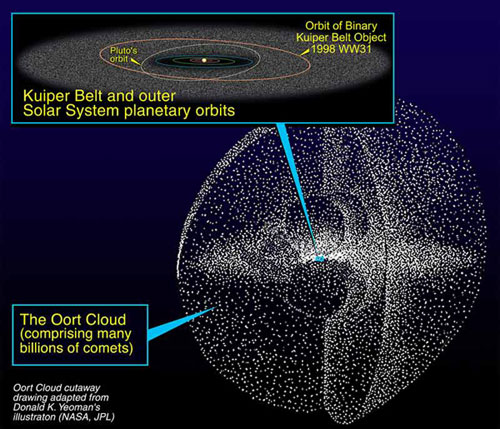
How did dust formed at intense temperatures appear in frozen comets? Comets are the icy, dusty nomads of the Solar System. Thought to have evolved in the outermost reaches of space, in the Kuiper Belt (around the orbit of Pluto) or in a mysterious region called the Oort Cloud, these bodies occasionally get knocked and fall under the weak gravitational pull of the Sun. As they fall toward the inner Solar System, the Sun’s heat will cause the ice to vaporize, creating a cometary tail known as the coma. Many comets fall straight into the Sun, but others are more lucky, completing a short-period (if they originated in the Kuiper Belt) or long-period (if they originated in the Oort Cloud) orbit of the Sun.
But something odd has been found in the dust collected by NASA’s 2004 Stardust mission to Comet Wild-2. Dust grains from this frozen body appeared to have been formed a high temperatures. Comet Wild-2 is believed to have originated from and evolved in the Kuiper Belt, so how could these tiny samples be formed in an environment with a temperature of over 1000 Kelvin?
The Solar System evolved from a nebula some 4.6 billion years ago and formed a large accretion disk as it cooled. The samples collected from Wild-2 could only have been formed in the central region of the accretion disk, near the young Sun, and something transported them into the far reaches of the Solar System, eventually ending up in the Kuiper Belt. But what mechanism could do this? We are not too sure (see Comet Dust is Very Similar to Asteroids).
3. The Kuiper Cliff
The bodies in the Kuiper Belt (Don Dixon)
Why does the Kuiper Belt suddenly end? The Kuiper Belt is a huge region of the Solar System forming a ring around the Sun just beyond the orbit of Neptune. It is much like the asteroid belt between Mars and Jupiter, the Kuiper Belt contains millions of small rocky and metallic bodies, but it’s 200-times more massive. It also contains a large quantity of water, methane and ammonia ices, the constituents of cometary nuclei originating from there (see #4 above). The Kuiper Belt is also known for its dwarf planet occupant, Pluto and (more recently) fellow Plutoid “Makemake”.
The Kuiper Belt is already a pretty unexplored region of the Solar System as it is (we wait impatiently for NASA’s New Horizons Pluto mission to arrive there in 2015), but it has already thrown up something of a puzzle. The population of Kuiper Belt Objects (KBOs) suddenly drops off at a distance of 50 AU from the Sun. This is rather odd as theoretical models predict an increase in number of KBOs beyond this point. The drop-off is so dramatic that this feature has been dubbed the “Kuiper Cliff.”
We currently have no explanation for the Kuiper Cliff, but there are some theories. One idea is that there are indeed a lot of KBOs beyond 50 AU, it’s just that they haven’t accreted to form larger objects for some reason (and therefore cannot be observed). Another more controversial idea is that KBOs beyond the Kuiper Cliff have been swept away by a planetary body, possibly the size of Earth or Mars. Many astronomers argue against this citing a lack of observational evidence of something that big orbiting outside the Kuiper Belt. This planetary theory however has been very useful for the doomsayers out there, providing flimsy “evidence” for the existence of Nibiru, or “Planet X.” If there is a planet out there, it certainly is not “incoming mail” and it certainly is notarriving on our doorstep in 2012.
So, in short, we have no clue why the Kuiper Cliff exists…
2. The Pioneer Anomaly
Artist impression of the Pioneer 10 probe (NASA)
Why are the Pioneer probes drifting off-course? Now this is a perplexing issue for astrophysicists, and probably the most difficult question to answer in Solar System observations. Pioneer 10 and 11 were launched back in 1972 and 1973 to explore the outer reaches of the Solar System. Along their way, NASA scientists noticed that both probes were experiencing something rather strange; they were experiencing an unexpected Sun-ward acceleration, pushing them off-course. Although this deviation wasn’t huge by astronomical standards (386,000 km off course after 10 billion km of travel), it was a deviation all the same and astrophysicists are at a loss to explain what is going on.
One main theory suspects that non-uniform infrared radiation around the probes’ bodywork (from the radioactive isotope of plutonium in its Radioisotope Thermoelectric Generators) may be emitting photons preferentially on one side, giving a small push toward the Sun. Other theories are a little more exotic. Perhaps Einstein’s general relativity needs to be modified for long treks into deep space? Or perhaps dark matter has a part to play, having a slowing effect on the Pioneer spacecraft?
How do we know the Oort Cloud even exists? As far as Solar System mysteries go, the Pioneer anomaly is a tough act to follow, but the Oort cloud (in my view) is the biggest mystery of all. Why? We have never seen it, it is a hypothetical region of space.
At least with the Kuiper Belt, we can observe the large KBOs and we know where it is, but the Oort Cloud is too far away (if it really is out there). Firstly, the Oort Cloud is predicted to be over 50,000 AU from the Sun (that’s nearly a light year away), making it about 25% of the way toward our nearest stellar neighbour, Proxima Centauri. The Oort Cloud is therefore a very long way away. The outer reaches of the Oort Cloud is pretty much the edge of the Solar System, and at this distance, the billions of Oort Cloud objects are very loosely gravitationally bound to the Sun. They can therefore be dramatically influenced by the passage of other nearby stars. It is thought that Oort Cloud disruption can lead to icy bodies falling inward periodically, creating long-period comets (such as Halley’s comet).
In fact, this is the only reason why astronomers believe the Oort Cloud exists, it is the source of long-period icy comets which have highly eccentric orbits emanating regions out of the ecliptic plane. This also suggests that the cloud surrounds the Solar System and is not confined to a belt around the ecliptic.
So, the Oort Cloud appears to be out there, but we cannot directly observe it. In my books, that is the biggest mystery in the outermost region of our Solar System…
Proposed spacesuits from Oceaneering, Inc. Image: NASA
[/caption]
NASA has terminated a contract with the company it hired to design and construct new spacesuits for use with the new Orion spacecraft after determining it made a mistake in evaluating costs. In terminating the contract NASA hopes to avoid litigation. In June, NASA announced it had selected Oceaneering International, Inc. to build the new spacesuits, but Hamilton Sundstrand, the lead contractor that has supplied spacesuits for NASA since the 1960’s filed a formal protest with the Government Accounting Office on the decision, asking NASA to review its reasoning on the contract award. Hamilton Sundstrand disagreed with the way NASA evaluated the costs for their proposal. NASA has now issued a press release saying “corrective action is appropriate,” and they have “determined that a compliance issue requires the termination of the contract” with Oceaneering “for the convenience of the government.” It appears NASA did some bad math, or used questionable processes to make its decision for the contract.
Hamilton Sundstrand claimed it never received adequate information from NASA about why its bid did not win. Also, NASA failed to request a “cost-accounting standards disclosure statement from Oceaneering during its deliberations,” according to a Wall Street Journal article. A government accounting office letter also said that “The agency must re-examine both offers’ cost proposals. To the extent that any irregularities are identified, appropriate re-evaluation must be made.”
The three-phase $745 million contract called for 109 suits, 24 of which will be the lunar suits.
NASA may have start again from scratch and reopen the bidding for the spacesuit contract.
In a statement Friday, Hamilton Sundstrand said its wants “corrective action” and they are concerned that revisions to the proposal may not correct the “significant errors and deficiencies in the procurement we have protested thus far.”
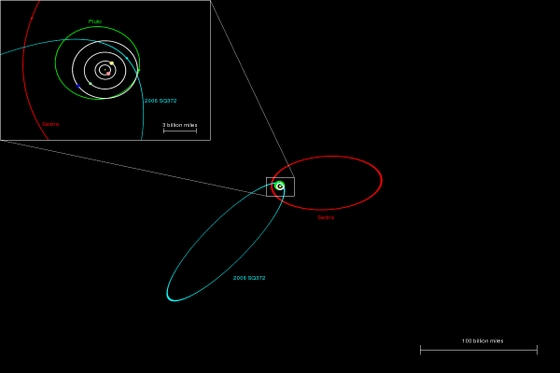
Orbit of solar system object SQ372 (blue) compared with the orbits of Neptune Pluto and Sedna (white, green, red). Credit: N. Kaib.
[/caption]
Astronomers announced today that a new “minor planet” with an unusual orbit has been found just two billion miles from Earth, closer than Neptune. Using the Sloan Digital Sky Survey, astronomers detected a small, comet-like object called 2006 SQ372, which is likely made of rock and ice. However, its orbit never brings it close enough to the sun for it to develop a tail. Its unusual orbit is an ellipse that is four times longer than it is wide, said University of Washington astronomer Andrew Becker, who led the discovery team. The only known object with a comparable orbit is Sedna — the distant, Pluto-like dwarf planet discovered in 2003. But 2006 SQ372’s orbit takes it more than one-and-a-half times further from the Sun, and its orbital period is nearly twice as long.
2006 SQ372 is beginning the return leg of a 22,500-year journey that will take it to a distance of 150 billion miles, nearly 1,600 times the distance from the Earth to the Sun. Scientists believe the object is only 50-100 kilometers (30-60 miles) across.
Click here for an animation showing the detection of SQ372 by SDSS.
Becker’s team was actually using the SDSS to look for supernova explosions billions of light-years away to measure the expansion of the universe. “If you can find things that explode, you can also find things that move, but you need different tools to look for them,” said team member Lynne Jones, also of the University of Washington. The only objects close enough to change position noticeably from one night to the next are in our own solar system, Jones explained.
The SDSS-II supernova survey scanned the same long stripe of sky, an area 1,000 times larger than the full moon, every clear night in the fall of 2005, 2006, and 2007.
SQ372 was first discovered in a series of images taken in 2006 by the SDSS, and were verified from images taken in 2005 and 2007.
The researcher team is trying to understand how the object acquired its unusual orbit. “It could have formed, like Pluto, in the belt of icy debris beyond Neptune, then been kicked to large distance by a gravitational encounter with Neptune or Uranus,” said UW graduate student Nathan Kaib. “However, we think it is more probable that SQ372 comes from the inner edge of the Oort Cloud.”
Even at its most distant turning point, 2006 SQ372 will be ten times closer to the Sun than the supposed main body of the Oort Cloud, said Kaib. “The existence of an ‘inner’ Oort cloud has been theoretically predicted for many years, but SQ372 and perhaps Sedna are the first objects we have found that seem to originate there. It’s exciting that we are beginning to verify these predictions.”
Becker noted that 2006 SQ372 was bright enough to find with the SDSS only because it is near its closest approach to the Sun, and that the SDSS-II supernova survey observed less than one percent of the sky.
“There are bound to be many more objects like this waiting to be discovered by the next generation of surveys, which will search to fainter levels and cover more area,” said Becker. “In a decade, we should know a lot more about this population than we do now.”
“One of our goals,” said Kaib, “is to understand the origin of comets, which are among the most spectacular celestial events. But the deeper goal is to look back into the early history of our solar system and piece together what was happening when the planets formed.”
The discovery of 2006 SQ372 was announced today in Chicago, at an international symposium about the Sloan Digital Sky Survey. A paper describing the discovery technique and the properties of 2006 SQ372 is being prepared for submission to The Astrophysical Journal.
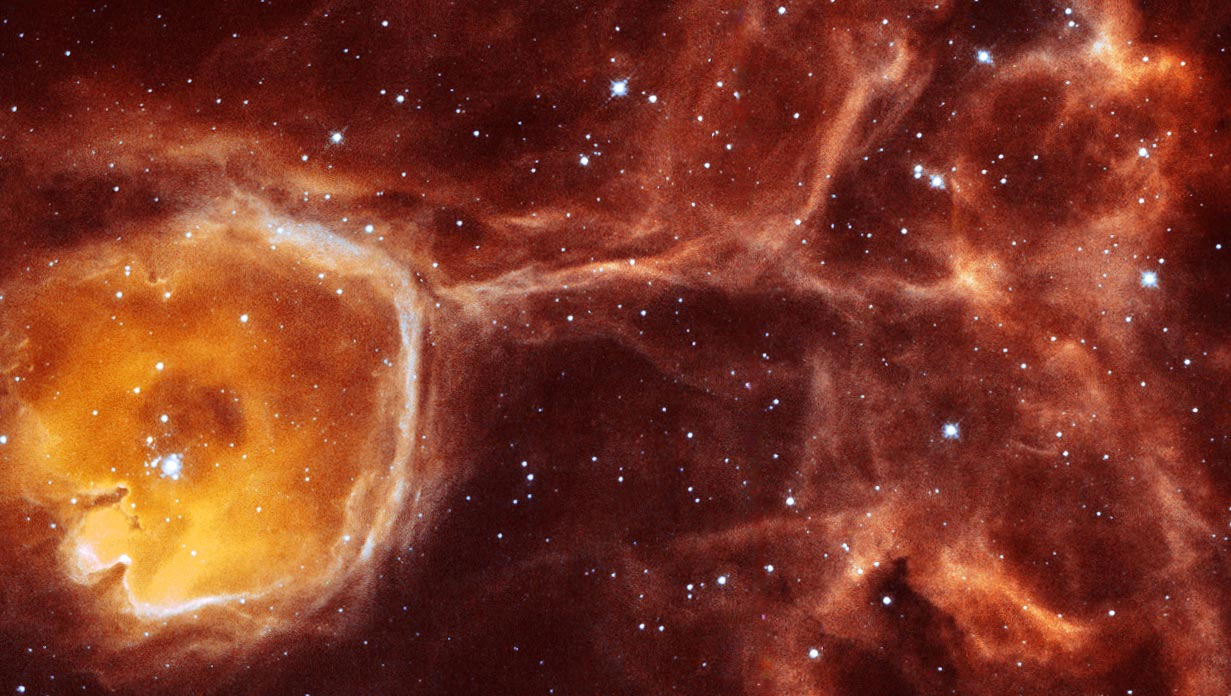
Last week, we posted the image above as part of our “Where In The Universe” challenge, where we test our readers’ visual knowledge of our universe. This incredible and unusual Hubble image of object N44F, known as the “Celestial Geode” is a gas cavity carved by the stellar wind and intense ultraviolet radiation from a hot young star. Readers were fascinated by the object and wanted to know more. One of our regular readers, Jorge, asked this question about N44F: “Why is it that we see the back “wall” of the bubble, we see the side walls, but we don’t see the front wall?” I wasn’t able to answer that question, so I sought out one of the astronomers responsible for this image, Dr. You-Hua Chu, professor at the University of Illinois, Urbana-Champaign. Not only did Dr. Chu provide wonderful information about the image, but one of her former students, Dr. Rosie Chen provided Universe Today with an exclusive Spitzer Space Telescope image of the Celestial Geode that has never been published before on the internet.
Dr. Chu explained in more detail what we see in the Hubble image. “This picture shows a cluster of stars that were formed recently, maybe about a million years ago,” she said. “The entire geode was a dense ball of gas and dust. It collapsed under its own gravity to form the cluster of stars.”
Once some massive stars were formed, there was enough UV radiation to ionize the remaining gas, and the stellar wind blows the gas outward. “Depending on how much material exists in each direction,” said Dr. Chu, “an expanding blister may form in the direction with low densities, or a stalled wall is formed in the direction with high densities.”
In response to the question about why we don’t see the front wall of the bubble, Dr. Chu compared the Celestial Geode to a store’s display case. The front wall is so thin, it is as transparent as glass. “You might ask how come we are so lucky to be peering through the thinnest wall of this geode,” said Dr. Chu. “Well, if we were looking at the geode in directions where thick walls exist, we wouldn’t be able to see the inside.”
Dr. Chu said the walls are like a balloon with uneven thickness. The thinnest part will be inflated most and become transparent.
“The interesting thing about this geode is that along its dense wall there are dust pillars sticking out and young stars are being formed at the tips of these pillars. We have obtained Spitzer Space Telescope images of this region and find IR (infrared) sources at the tips of the pillars and the spectral properties of these IR sources suggest that they contain young stars that are still enshrouded in dust.” And here is the Spitzer color composite image, provided by Dr. Rosie Chen, a researcher at the University of Virginia, and created by Dr. Adeline Caulet: Spitzer/Hubble color composite image of N44F. Credit: Dr. Adeline Caulet
Both Drs. Chu and Chen warned that the Spitzer image may be a bit of a disappointment after seeing the Hubble image. “As you can see the HST images show clearly the detail structure while the Spitzer image is more fuzzy,” said Dr. Chen. “This is because HST’s resolution is over 10 times better than Spitzer.”
When I asked Dr. Chu about how the Hubble image was obtained, she said it was somewhat an accident that this particular part of N44 was imaged. “I proposed to Hubble to observe the superbubble N44 because it had X-ray emissions and I wanted to use high-resolution images to search for supernova remnant shocks,” she said. “The observation was made, but not properly made, so I requested a make-up observation at a slightly different location in N44 to allow an arbitrary roll angle of the space craft.” The Celestial Geode was at the new central position. Dr. Chu said she chose that position because she had always been interested to see what was going on in the ionized gas region, but didn’t have a convincing excuse to propose an observation. “You can say that I took advantage of the make-up observation to sneak in this object,” she said. Dr. You-Hua Chu
In researching this article, I noticed Dr. Chu’s name associated with many outstanding astronomical images. I told her she must be a busy astronomer. “I have to say that I am a lucky astronomer,” she said. “I try to pursue truth and beauty at the same time.”
Chu and Chen’s paper on N44: “Chen, C.-H.R., and Chu, Y.-H. Gruendl, R.A., Gordon, K.D., and Heitsch, F., “Spitzer View of Young Massive Stars in the LMC HII Complex N44,” 2008, ApJ, submitted.”
Since Universe Today’s Ian O’Neill first introduced the idea of Google Earth’s 4D Ionosphere tool, it set my mind to wondering – wondering if the ionospheric changes caused by a meteor shower could be distinguished and used by those armed with a little knowledge and the program. That was months ago. Why wait so long before telling what I’ve discovered? Because any type of investigation of this sort requires a long history of scientific method based controls, lots of research, worldwide observations and… a few meteor showers.
First, let’s talk very briefly and simply about Earth’s ionosphere – your essential last frontier before space. The ionosphere is named for the ions mainly created by energetic particles from the Sun and space itself. These ions create an electrical layer that reflects radio waves and are arranged in layers. New ions are created during bombardment and older ones decay when faced with free electrons. This is a control. The balance of the amount of ionization seen at any given time through any given equipment – and dependent of solar activity, time of day, season and even height.
The F (F1 and F2) layers of the ionosphere are the highest and also the one most likely to be affected by solar circumstances. During daylight hours, F and F1 becomes more highly ionized and go down deeper to the different sky chemistry of the F2 zone. At night, there’s only one strong F layer and it fades as night progresses. Below this is the E layer which is totally unpredictable and just disappears at night. Closest to the Earth is the D layer – which forms during sunlight exposure and dissipates during night. These are all also control models and easily seen with the Google Ionosphere tool. Of course, there are always totally unpredictable things which can occur, but take into consideration that I am creating these control models while monitoring solar activity, the auroral oval and even the terrestrial weather patterns to a certain degree.
Thanks to the magic of the Internet, over the last several months I have been able to chat live with observers around the world as meteor showers have occurred in their locations and been able to compare what they can visually confirm with what I can monitor using the GE 4D Ionosphere tool. Sometimes the results wouldn’t be so great and other times it would be downright amazing. The key to understanding the whole thing is comparing the control samples and a whole lot of work. But, before we get into what it takes, I wanted hard scientific proof that meteor showers really do impact the ionosphere, so I went looking for studies.
According the McNeil (et al): “A comprehensive model of the effect of a major meteor storm on Earth’s ionosphere is presented. The model includes meteor stream mass distributions based on visual magnitude observations, a differential ablation model of major meteoric metals, Fe and Mg, and state-of-the-art modeling of the chemistry and transport of meteoric metal atoms and ions subsequent to deposition. Particular attention is paid to the possibility of direct ionic deposition of metallic species. The model is validated by calculating the effect of annual meteor showers on the background metal atom and ion abundances. A metallic ion density increase of up to 1 order of magnitude is observed, in agreement with in situ measurements during showers. The model is exercised for a hypothetical Leonid meteor storm of the magnitude reported in 1966. The model predicts the formation of a layer of metal ions in the ionospheric E region that reaches peak densities of around 1 x 105 cm-3, corresponding to a 2 order of magnitude increase of the quiescent nighttime E region density. Although sporadic E layers reaching or exceeding this density are relatively common, the effect is different in that it persists on the order of days and would be observed over nearly one-half the globe. The model predictions are consistent with the available 1966 Leonid storm data. In particular, the observation of enhanced, predawn sporadic E activity points to efficient collisional ionization of meteoric metals, as assumed in the model.”
Now let’s talk about what happens when meteors pass through the ionosphere, shall we? Down here on the ground, we “Oooh and Aaaah” over the pretty shooting star, but up there a process called ablation is beginning – that meteoroid particle is heating up and atoms are boiling off. Depending on energy and collision with an air molecule, these ablated meteor atoms are ionizing – freeing an electron and producing a positively charged ion and negatively charged electron. The infant ions begin to cool after they’ve been slammed about 10 times, which takes between a fraction of a millisecond at 80 km and as long as one millisecond at 110 km (according to Jones,1995). During this transition phase, the plasma density right around the meteoroid might take a big jump in structure which produces a large column or trail of enhanced ionization. Studies have shown these columns open up in a “flower-like” pattern and are similar to that which occurs near aurora (Farley and Balsley). These enhanced ionization areas can be miles across, but the free electrons and gas recombine very quickly. This means watching widespread ionosphere models for sporadic activity isn’t very productive – but when a large scale, predictable meteor shower occurs, things are different.
According to Danielis (et al): “More than 40 rocket flights through the main meteoric ionization layer, which peaks near 95 km, have sampled the meteoric metallic ion concentrations. Five of these flights were conducted during or near the peak times of a meteor shower. In each of the latter studies the observed meteoric ion concentrations were assumed to be a consequence of the shower. These measurements were not complemented by baseline observations made for similar ionospheric conditions immediately before the shower and no rigorous quantitative comparisons were made using average non-shower distributions. In order to further investigate the impact of the shower on the ionosphere, all published ion concentration altitude profiles obtained from sounding rockets in the meteoric ionization regime have been scanned to develop a digital data base of meteoric ion concentrations. These data are used to provide the first empirical altitude profile of the metallic ions. The average observed Mg+ concentrations are lower than those yielded by the most comprehensive model to date (McNeil et al., 1996). This compiled ensemble of data provides supporting evidence that meteor showers do have a significant impact on the average ionosphere composition. Although there is much variability in the observed meteoric layers, the peaks in the total metallic ion concentrations at mid-latitudes, on the dayside, observed during meteor showers had concentrations comparable to, or exceeding, the highest concentrations measured in the same altitude regions during non-shower periods.”
Bottom line… Can Google 4D Ionosphere spot major meteor shower activity or not? Here’s a few things to remember this before you try it. Each time you use the ionosphere tool you must visit the Communication Alert and Prediction System (CAPS) website and get the latest information to plug in. At the same time, use the SPIDR (Space Physics Interactive Data Resource) page to make sure of your control circumstances. Now, you’re ready to go! Without overloading this report with all my control images over the last few months (and please forgive the fact that I’m not a master at manipulating images) let me show you what I have…
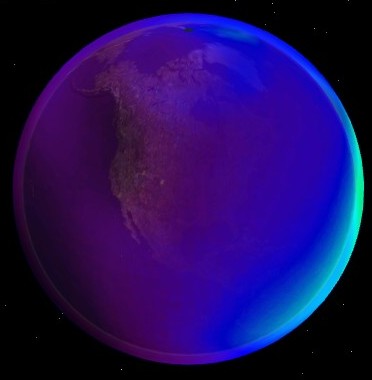
Control 1 - 02:00 UT Aug 12: Darkness and Activity Begins in Eastern US. Control 2 - 04:00 UT Aug 12: Visual Activity Increases Significantly in OH, KY, NY, IN, MI and PA. Control 3 - 08:00 UT Aug 12: High visual activity in OH, KY, NY, IN, MI and PA through dawn. Control 4 - 09:00 UT Aug 12: High visual activity reported in CO and beginning CA. Control 5: 10:00 UT Aug 12: High visual activity reported in CA. Control 6: 10:30 UT Aug 12: Approaching Predicted Peak. Control 7: 11:00 UT Aug 12: Predicted Peak: Activity Reported Nominal. Control 8 - 12:00 UT Aug 12: Daylight. Control 9 - 13:00 UT Aug 12 - Control Daylight West Coast
What you’re seeing here is a compilation of the Google 4D Ionosphere over basically North America during the time frame of August 11 beginning with twilight on the east coast and ending on August 12 at west coast dawn. This is a timeline of what occurred overnight during the 2008 Perseid Meteor Shower peak with visual meteor activity being confirmed as well. When you see blue, you are looking at tolerably good ionosphere – good for radio waves, low density, sunlight, etc. Bright red is high density not conducive to much of anything – like radio wave propagation. That’s what happens at night. So what’s black? Those are the “hot spots” – intense areas of ionization. They can occur randomly, they can be assisted by auroral activity – and apparently they can be traced to meteor shower activity.
Is this proof positive that the GE 4D Ionosphere is a way to watch meteor showers when nights are cloudy? If you remember to take all variables into account, refresh and check all your data and to exercise scientific control models, there’s no reason at all why amateur studies at home cannot provide at very least amusement on our parts. Google Earth 4D Ionosphere is endorsed by NASA and used by pilots, ham radio operators, earth scientists and even soldiers… why not amateur astronomers, too?
I am…
Disclaimer: This article was written and researched out of curiosity by Tammy Plotner and does not reflect the findings, research or applications of the sources stated within it. In other words, NASA doesn’t say you can use it to watch meteor showers and neither does Google – but no one says we can’t experiment with it! The author welcomes additional information, criticisms and comments…


