Evidence of Rain on Mars

Sedimentary deposits in Delta Nanedi on Mars. Credit: NASA's HiRISE Camera

[/caption]

Images of layered sedimentary deposits and deltas on Mars have provided evidence for lakes and flowing rivers that carried eroded material downstream. A team of researchers also believes there is evidence for precipitation in the Red Planet’s past. “For years scientists have been suspecting that the current appearance of the landscape has, in part, been shaped by rivers that cut into the surface,” said Ernst Hauber of the German Aerospace Center. “We can see layered sediments where these valleys open into impact craters. The shape of certain sediments is typical for deltas formed in standing water.” Hauber and his team also believe that surface runoff from rain or snowmelt completes the picture of past water on Mars.

The researchers explored the Xanthe Terra area located near the equator in the Martian highlands using image from four cameras on three different spacecraft; High-Resolution Stereo Camera (HRSC) on board the European Mars Express mission, the Mars Orbiter Camera (MOC) from NASA’s Mars Global Surveyor Mission and the HiRISE and CTX camera experiments on board NASA’s Mars Reconnaissance Orbiter (MRO) mission.

A crater lake and river on the Xanthe Terra region.  Credit: ESA/DL
A crater lake and river on the Xanthe Terra region. Credit: ESA/DL

The images paint this picture of Mars’ past: About four billion years ago, there were lakes on the Red Planet which may have been fed by short-lived rivers that were, in turn, fed by precipitation. These lakes filled craters that were formed by the impact of meteorites. Water accumulated in places where rivers broke through the crater rims. Deltas were formed at the mouths of the rivers, similar to how they are formed where rivers flow into lakes or seas on Earth.

Junction of the Nanedi valleys in the Xanthe highlands on Mars. Credit: ESA/DLR/FU Berlin (G. Neukum).

The researchers say were also able to narrow down the period when the craters were filled with lakes by analyzing the distribution of impact craters of different sizes, which gives an indication of the age of a planetary surface. The more craters are counted on a surface, the older the area is. The crater counts revealed that water was flowing through the valleys between about 3.8 and 4 billion years ago.

The valleys themselves could have formed relatively fast, and the deposits could have formed over a period ranging from decades to millennia.

But what led the researchers to surmise that there must have been precipitation on early Mars? “This is actually not at all self-evident: for a long time, scientists have been trying to figure out whether the valleys on Mars were formed by groundwater seepage and headward erosion, or by surface runoff caused by rainfall or snowmelt”, said Hauber. His team believes surface runoff was the cause. “Our findings also point in this direction and we are convinced that both processes have played an important role in Xanthe Terra”.

However, this situation did not last very long. Between 3.5 and 3.8 billion years ago, the precipitation became less intense and the valleys dried up. Erosion on Mars has been minimal ever since, which has contributed to the fact that deposits can still be observed although they should in fact be very susceptible to erosion. Today, Mars is a dry desert planet and water is no longer flowing through its valleys.

Source: German Aerospace Center

Deep Inside a Giant: Part 2 – Centaurus A by Mike Sidonio

Centaurus A Dustlane - Mike Sidonio

[/caption]

Our first glimpse into the intricacies of Centaurus A was the big picture. We soon found out that not only was the first photograph a deep study, but the study of NGC 5128 was going to go deeper as well. One of the most obvious of all features is the central dust lane which positively crackles to the eye photographically. Let’s be mindful of the radiation and get just a little closer….

In every visual representation of Centaurus A, one of the most dramatic of all features is the central dustlane. To the human eye, the dust is an obstruction – blocking the starlight and what lay beyond. But, to the camera, shifting to redder wavelengths allows us a glimpse at what lay beyond. Through carefully controlled exposures and filtering, red emission from ionized gas at the H-alpha line appears, and blue regions of star formation along the dust lane spring to life – where blue giant stars are being formed. According to 2000 study done by Wild and Eckart; “The interstellar medium of Centaurus A (NGC 5128) has been studied extensively in recent years, using mostly molecular lines tracing low to medium density gas. The amount and distribution of the dense molecular gas was largely unknown. Here we present new millimeter data of the rotational transitions and obtained spectra of the emission which traces dense molecular gas at the center and along the prominent dust lane at offset positions. We find that Centaurus A and the Milky Way are comparable in their line luminosity. However, towards the nucleus the fraction of dense molecular gas measured via the line luminosity ratio, as well as the star formation efficiency, is comparable to ultra-luminous infrared galaxies (ULIRGs). Within the off-nuclear dust lane and for Centaurus A as a whole these quantities are between those of ULIRGs and normal and infrared luminous galaxies. This suggests that most of the FIR luminosity of Centaurus A originates in regions of very dense molecular gas and high star formation efficiency.”

A highly efficient star forming region… Yes, indeed. Those brilliant blue regions you see along the edges are brand new star clusters. Merger induced star formation…

Do you see now why the dustlane in Centaurus A appears to scream? Normally star formation occurs in the dense parts of molecular clouds… collapsing themselves into a ball of plasma to form a star. But, according the work of Martig and Bournaud; “Star formation in galaxies is for a part driven by galaxy mergers. At low redshift, star formation activity is low in high-density environments like groups and clusters, and the star formation activity of galaxies increases with their isolation. This star formation-density relation is observed to be reversed at z~1, which is not explained by theoretical models so far. We study the influence of the tidal field of a galaxy group or cluster on the star formation activity of merging galaxies, using N-body simulations including gas dynamics and star formation. We find that the merger-driven star formation is significantly more active in the vicinity of such cosmological structures compared to mergers in the field. The large-scale tidal field can thus enhance the activity of galaxies in dense cosmic structures, and should be particularly efficient at high redshift before quenching processes take effect in the densest regions.”

But… But, what happens if you have a galaxy that happens to be tidally triggered into star formation and then it just happens to merge with another galaxy at the same time? Aaaaah…. You’re beginning to see the light aren’t you? The galaxy that merged with NGC 5128 was triggered into a burst of star formation, then it combined with Centaurus A and a whole new thing happened. Let’s take a look at the work of Peng and Ford: “Stellar streams in galaxy halos are the natural consequence of a history of merging and accretion. We present evidence for a blue tidal stream of young stars in the nearest giant elliptical galaxy, NGC 5128 (Centaurus A). Using optical UBVR color maps, unsharp masking, and adaptive histogram equalization, we detect a blue arc in the northwest portion of the galaxy that traces a partial ellipse with an apocenter of 8 kpc. We also report the discovery of numerous young star clusters that are associated with the arc. The brightest of these clusters is spectroscopically confirmed, has an age of 350 Myr, and may be a protoglobular cluster. It is likely that this arc, which is distinct from the surrounding shell system and the young jet-related stars in the northeast, is a tidally disrupted stellar stream orbiting the galaxy. Both the age derived from the integrated optical colors of the stream and its dynamical disruption timescale have values of 200-400 Myr. We propose that this stream of young stars was formed when a dwarf irregular galaxy, or similar-sized gas fragment, underwent a tidally triggered burst of star formation as it fell into NGC 5128 and was disrupted 300 Myr ago. The stars and star clusters in this stream will eventually disperse and become part of the main body of NGC 5128, suggesting that the infall of gas-rich dwarfs plays a role in the building of stellar halos and globular cluster systems.”

Needless to say, the developments in Centaurus A are a little shocking, aren’t they? And shocked gas is what it’s all about. Says John Graham; “Observational evidence for shock-induced star formation is found in the northeast radio lobe of the nearby radio galaxy Centaurus A (NGC 5128). A gas cloud, recently detected in H i, is impacted by the adjacent radio jet to the extent that cloud collapse is triggered and loose chains of blue supergiant stars are formed. Diffuse clouds and filaments of ionized gas have been observed near the interface of the H i cloud and the radio jet. These show velocities that cover a range of more than 550 km s−1. Line intensities in their spectra are characteristic of a shock-related origin with strong [N ii] and [S ii] relative to Hα. The [O iii]/Hα line ratio indicates a large range in excitation that is not correlated with velocity. Distinct from this component is a group of four apparently normal H ii regions that are excited by embedded young stars and whose velocities are very close to that of the H i cloud. Star formation will continue for as long as the gas cloud remains close to the radio jet. The loose chains of blue stars in the area are resolved only because NGC 5128 is so close. The reported faint blue extensions and plumes in more distant analogs probably have similar origins.”

So now we have all kinds of things we’ve learned deep inside this giant. Is there anything else we should know before we leave this part and go on? Oh, you know it… A supermassive black hole 200 million times the mass of our own Sun.

Using the infrared vision of Hubble, astronomers can now see a hot gas disk is tilted in a different direction from the orientation of the jet – the indicator of the black hole. It’s believed this may be because the merger is so recent and the disk has not yet aligned to the spin, or the galaxies may still be playing tug of war. According to Ethan Schrier of STSCI, “This black hole is doing its own thing. Aside from receiving fresh fuel from a devoured galaxy, it may be oblivious to the rest of the galaxy and the collision. We have found a complicated situation of a disk within a disk within a disk, all pointing in different directions.” The most astounding part of all is the black hole itself may possible be a merger of two independent black holes! Is this why there is core-dominated radio-loud quasars here as well? As a radio galaxy it releases 1000 times the radio energy of the Milky Way in the form of large bi-directional radio lobes that extend some 800,000 light years into intergalactic space. Well, guess what… There’s theories on that, too.

According, to Saxton, Sutherland and Bicknell, that radio source may just be a plasma bubble: “We model the northern middle radio lobe of Centaurus A (NGC 5128) as a buoyant bubble of plasma deposited by an intermittently active jet. The extent of the rise of the bubble and its morphology imply that the ratio of its density to that of the surrounding ISM is less than 10^{-2}, consistent with our knowledge of extragalactic jets and minimal entrainment into the precursor radio lobe. Using the morphology of the lobe to date the beginning of its rise through the atmosphere of Centaurus A, we conclude that the bubble has been rising for approximately 140Myr. This time scale is consistent with that proposed by Quillen et al. (1993) for the settling of post-merger gas into the presently observed large scale disk in NGC 5128, suggesting a strong connection between the delayed re-establishment of radio emission and the merger of NGC 5128 with a small gas-rich galaxy. This suggests a connection, for radio galaxies in general, between mergers and the delayed onset of radio emission. In our model, the elongated X-ray emission region discovered by Feigelson et al. (1981), part of which coincides with the northern middle lobe, is thermal gas that originates from the ISM below the bubble and that has been uplifted and compressed. The “large-scale jet” appearing in the radio images of Morganti et al. (1999) may be the result of the same pressure gradients that cause the uplift of the thermal gas, acting on much lighter plasma, or may represent a jet that did not turn off completely when the northern middle lobe started to buoyantly rise. We propose that the adjacent emission line knots (the “outer filaments”) and star-forming regions result from the disturbance, in particular the thermal trunk, caused by the bubble moving through the extended atmosphere of NGC 5128.”

And now you know just a little bit more about what’s deep inside a giant…

Many thanks to AORAIA member, Mike “Strongman” Sidonio for the use of this incredible image.

Angle of the Sun

Why Are There Seasons
The angle of the Sun and the Earth's seasons. Image credit: NASA

[/caption]
The amount of the Sun’s energy falling at any point on the Earth depends on the angle of the Sun. This is reason why the seasons have different temperatures, and the polar regions are colder, on average than regions around the equator. Let’s take a look at why the angle of the Sun is so important, and how its change effects the Earth’s climate.

To understand how various parts of the Earth receive less energy, imagine holding a flashlight, and pointing straight at a piece of paper. Light comes out of the flashlight and forms a perfect circle on the paper. At this point, the energy from the flashlight is most concentrated in each square centimeter on the paper. Now imagine angling the paper so that the flashlight’s beam creates a big ellipse on the paper. The same amount of energy is coming out of the flashlight, but it’s being spread out across a much larger area of paper. Each square centimeter of paper is receiving less light than it was before.

Take this analogy to the Earth. When the Sun is directly overhead, like for people in the tropics, the maximum amount of energy is being soaked up by each square meter of Earth. This causes temperatures to rise. For the polar latitudes, the Sun is at a steep angle, so the same amount of energy from the Sun is falling over a much larger area.

During summer in the northern horizon, the Sun is at its maximum angle in the sky, and we get the most energy. But in the winter, the Sun is at a much steeper angle, and so we get less energy from the Sun. And this is why we experience different seasons – it’s all in the angle of the Sun.

Here’s more information from Universe Today about how the Earth has seasons. And Mars has seasons too.

Windows on the Universe has a great description of this. Here’s a handy tool you can use to calculate sunrise and sunset times, as well as the angle of the Sun.

We have recorded an episode of Astronomy Cast just about the Sun called The Sun, Spots and All.

Deep Inside a Giant – Centaurus A by Mike Sidonio

Centaurus A - Ultra-Deep by Mike Sidonio

[/caption]

Before you dismiss this as just another photo of Centaurus A, you better look again. It’s way deeper… First discovered by James Dunlop on August 4, 1826 this incredible galaxy known as Centaurus A (NGC 5128) has been tickling the imagination of astronomers since John Herschel described it as “two semi-ovals of elliptically formed nebula appearing to be cut asunder and separated by a broad obscure band parallel to the larger axis of the nebula, in the midst of which a faint streak of light parallel to the sides of the cut appears.” in 1847. What makes this incredible galaxy tick? Step inside and let’s find out…

Regardless of the fact that J. Herschel pointed out NGC 5128’s unusual characteristics, it would be 102 years before astronomy really took this galaxy seriously – not because the science didn’t progress – but because there just wasn’t any large optical telescopes located in the southern hemisphere. However, things were about to change drastically in 1949 when the 80-foot radio antenna at Dover Heights, Australia went on-line. There astronomers John Bolton, G. Stanley, and Bruce Slee were the first to identify Centaurus A as a powerful radio galaxy – the first source to be linked to an extra-galactic hot spot.

But just how hot is it? Try a study done in July 2008 by Cuoco and Hannestad searching for ultrahigh energy neutrinos from Centaurus A and the Auger hot spot. “The Pierre Auger Collaboration has reported a correlation between ultrahigh energy cosmic rays (UHECR) and nearby active galactic nuclei (AGN) within Ëœ75Mpc. Two of these events fall within 3 degrees from Centaurus A (Cen A), the nearest AGN, clearly suggesting that this object is a strong UHECR emitter. Here we pursue this hypothesis and forecast the expected rate of ultrahigh energy neutrinos in detectors like IceCube. In our baseline model we find a rate of Ëœ0.4–0.6yr-1 events above a threshold of 100 TeV, the uncertainty of which is mainly related to the poor knowledge of the physical parameters of the source and details of the model. This situation will improve with detailed high energy gamma ray measurements of Cen A by the upcoming Gamma Ray Large Area Space Telescope (GLAST) satellite. This would make Cen A the first example where the potential of high energy multi messenger astronomy is finally realized.”

Now, let’s go back in time… Back to 1954 at Palomar Observatory’s twin telescopes with Walter Baade and Rudolph Minkowski. It was then the first proposal was made that the bar of dark dust bisecting the galaxy was the result of a merger between two galaxies – a giant elliptical and a small spiral. “The radio source Cygnus A is an extragalactic object, two galaxies in actual collision.” This simple observation was again confirmed in 2005 by Karataeva (et al); “We present the results of stellar photometry in eight fields of NGC 5128 (Cen A), a candidate polar-ring galaxy, obtained by reducing images from the Hubble Space Telescope archive. In all cases, the color-magnitude diagrams reached the red-giant region, and the distance to the galaxy was determined from the position of the tip of the red-giant branch (4.1 Mpc), in agreement with previous estimates. Comparison of the diagrams with theoretical isochrones indicates that the red supergiants in the dark lane region are metal-rich, which is atypical of the polar rings. Our results are consistent with the assumption made by several authors that the absorption of a less massive spiral galaxy by a more massive one is observed in NGC 5128.”

But, that’s not all that’s coming off Centaurus A. Massive amounts of X-rays have been detected as well, with the very first picked up in 1970 with the use of a sounding rocket and then confirmed by the UHURU satellite. The emission was very localized, but it wasn’t steady, it changed in intensities. Again, scientific curiosity was aroused and again, an answer was found – a black hole. According to the work of Marconi (et al): “We present new HST Space Telescope Imaging Spectrograph observations of the nearby radio galaxy NGC 5128 (Centaurus A). The bright emission line with longest wavelength accessible from HST was used to study the kinematics of the ionized gas in the nuclear region. The STIS data were analized in conjunction with the ground-based near-infrared Very Large Telescope ISAAC spectra to infer the presence of a supermassive black hole and measure its mass. We performed a detailed analysis of the effects on MBH of the intrinsic surface brightness distribution of the emission line, a crucial ingredient in the gas kinematical analysis. The observed velocity dispersion in our spectra can be matched with a circularly rotating disk and also the observed line profiles and the higher order moments in the Hermite expansion of the line profiles, h3 and h4, are consistent with emission from such a disk. To our knowledge, Centaurus A is the first external galaxy for which reliable BH mass measurements from gas and stellar dynamics are available and, as in the case of the Galactic Center, the MBH gas kinematical estimate is in good agreement with that from stellar dynamics. Thus Centaurus A ranks among the best cases for supermassive Black Holes in galactic nuclei.”

Yet, is that all there is? No. As early as 1972, gamma ray emissions from NGC 5128 were being explored. Which, according to the work of Ozernoy and Aharonian, may very well be tied to the black hole itself. “An analysis of the experimental data on nuclear gamma-ray lines from Cen A reveals essential energetic difficulties, associated with the usual interpretation of these lines as a result of interactions of subcosmic rays with interstellar gas; since the necessary instantaneous energy loss rate of the cosmic rays should reach tremendous values. These difficulties are eliminated if the gamma rays are produced in the relativistic non-isothermal plasma near a compact source of activity — such as a massive black hole or a magnetoid (spinar).”

But don’t stop there. By the late 1970, John Graham had also discovered an outer gas shell from the galactic merger – a shell which was studied again in 2008 by Stickel (et al): “Deep far-infrared (FIR) imaging data detected the thermal emission from cold dust in the northern shell region of NGC5128 (Centaurus A), where previously neutral hydrogen and molecular gas has been found. These observations are in agreement with recent theoretical considerations that in galaxy interactions leading to stellar shell structures the less dissipative clumpy component of the ISM from the captured galaxy can lead to gaseous shells. Alternatively, the outlying gas and dust could be a rotating ring structure resulting from an interaction or even late infall of tidal material of a merger in the distant past. With all three components (atomic gas, molecular gas, dust) of the ISM present in the northern shell region, local star formation may account for the chains of young blue stars surrounding the region to the east and north. The dust cloud may also be involved in the disruption of the large scale radio jet before entering the brighter region of the northern radio lobe.”

But, let’s get down here. The photo at the top of this page wasn’t taken with the Hubble. It didn’t go through Chandra. It was taken by a very dedicated amateur astronomer named Mike Sidonio who understood exactly what needed to be done to capture all the true beauty of this too-often photographed sky gem. Says Mike; “This unique and extremely deep colour image, compiled from nearly 20 hours of exposure with just a 6” telescope, was taken from a very dark sky in remote Australia. The image reveals the full outer halo of the peculiar radio galaxy Centaurus A (NGC 5128) in Centaurus including faint polar extensions extending from the top and bottom of the galaxy running diagonally. Also evident in this image is the extensive but extremely faint Milky Way nebulosity and dust known as “Galactic Cirrus” or “Integrated Flux” that permeates this entire region. Galactic Cirrus material lies just above the plane of our galaxy and is lit by the light of The Milky Way as a whole but due to its extreme faintness at 27mag/sq arc sec, is seldom seen in images, it is visible as faint patches of dusty looking nebulosity all over the image. The Cirrus nebulosity around Centaurus A is some of the faintest in the sky and is well below the natural sky brightness. Countless distant background galaxies of all shapes and sizes can be found scattered all over the field of view as well.”

But Mike isn’t just any astrophotographer. He’s won numerous Malin awards and Astro Awards. His work has been featured in magazines such as Sky & Telescope and Astronomy, as well as Astronomy Picture of the Day, and this single Centaurus A image is only a small fraction of the study Mr. Sidonio did on this subject. For those of you who are curious, I would highly suggest visiting Mike Sidonio’s Centaurus A Pages, where each individual image takes you on an ever deeper visual journey into this fascinating galaxy.

Many thanks to AORAIA member, Mike “Strongman” Sidonio for the use of this incredible image.

History of the Sun

Ancient Gaocheng in China

[/caption]
Modern science tells us that the Sun is a big hot ball of hydrogen at the center of the Solar System, and all the planets orbit around it. But ancient people didn’t have access to the same scientific tools we have today. Their understanding about the Sun was much more primitive, and often… wrong. Let’s investigate the history of the Sun.

Most life on Earth evolved with the Sun in mind; the rising and setting Sun defined the cycle of daily life for almost all life. Ancient peoples were entirely dependent on the Sun for light; only the light from a full Moon gave any way to see in the night. It wasn’t until the invention of fire that humans had any way to get any work done after the Sun went down.

Since the Sun was such an important object, many ancient people treated it with reverence and considered the Sun a god. Many worshipped the Sun, and built monuments to celebrate it. Monuments like Stonehenge in England, and the Pyramids of Egypt were used to mark the position of the Sun over the course of the year.

The first accurate measurement of the distance to the Sun was made by Greek philosopher Anaxagoras. Of course, he was threatened with death for his ideas that the Sun was a burning ball of fire, and not a god.

It was long thought that the Sun orbited around the Earth, but it was Nicolaus Copernicus who first proposed a Sun-centered Solar System. This theory gained evidence from Galileo and other early astronomers. By the 1800s, solar astronomy was very advanced, with astronomers carefully tracking sunspots, measuring absorption lines in the spectrum of light from the Sun, and discovering infrared.

For the longest time, astronomers were puzzled by how the Sun generated so much energy. It wasn’t until the 1930s when astrophysicists Subrahmanyan Chandrasekhar and Hans Bethe finally developed the theoretical concept of nuclear fusion, which explained the Sun (and all stars) perfectly.

NASA has a great website with photographs of ancient building used to mark the position of the Sun, and more about solar eclipses of historical interest.

Want more history? Here’s an article about the history of Venus, and another about the history of Saturn.

We have recorded an episode of Astronomy Cast just about the Sun called The Sun, Spots and All.

Reference:
NASA Sun-Earth Day: 2009, Issue # 64
NASA Ancient Observatories

Weekend SkyWatcher’s Forecast – September 19-21, 2008

Greetings, fellow SkyWatchers! Are you psyched up for tonight’s Pleiades occultation? I am! While the Moon often passes near the ancient cluster, it’s not often we get to enjoy such a great event so well placed at a comfortable time of the year. This weekend we’ll be watching for ISS passes, reaching for the “Ring”, visiting Andromeda, and taking on two new Herschel 400 studies. Time to get out your telescopes, spotting scopes and binoculars and head out into the night because…. Here’s what’s up!

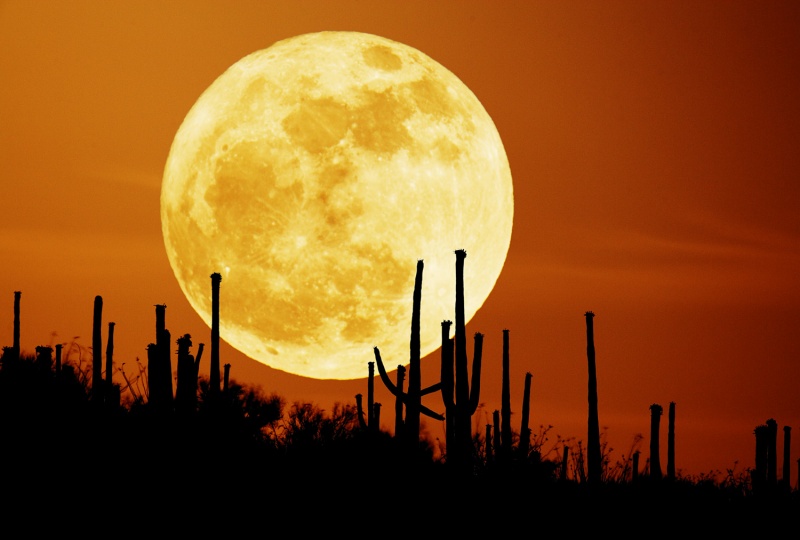
Friday, September 19, 2008 – On this day in 1848, William Boyd was watching Saturn – and discovered its moon Hyperion. Also today in 1988, Israel launched its first satellite. And don’t forget…t his evening will feature possibly the best occultation of the Pleiades by the Moon this year, so be sure to check with IOTA for details!

How long has it been since you’ve watched the ISS pass overhead, or seen an Iridium flare? Both are terrific events that don’t require any special equipment to be seen – even in the daytime! Be sure to check with www.heavens-above.com for accurate times in your location – and enjoy. While you’re out SkyWatching, be sure to have a look for Spica on the southwestern horizon after sunset. You just might discover a few planets joining the show!

When skies are dark, it’s time for us to head directly between the two southernmost stars in the constellation of Lyra and grab the “Ring.” What summer would be complete without it?

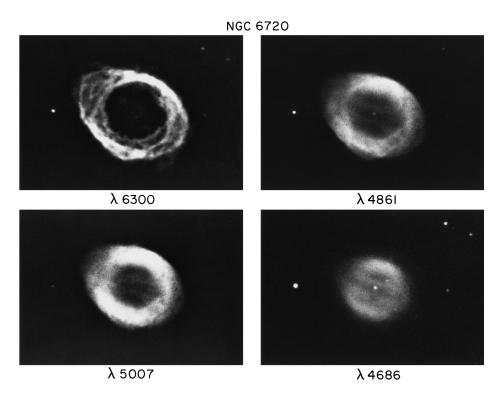
Discovered by French astronomer Antoine Darquier in 1779, the Ring Nebula was cataloged later that year by Charles Messier as M57 (RA 18 53 35 Dec +33 01 45). In binoculars the Ring will appear as slightly larger than a star, yet it cannot be focused to a sharp point. To a modest telescope at even low power, M57 turns into a glowing donut against a wonderful stellar backdrop. The accepted distance to this unusual structure is about 1,400 light-years, and how you see the Ring on any given night is highly dependent on conditions. As aperture and power increase, so do details, and it is not impossible to see braiding in the nebula’s structure with scopes as small as 8″ on a fine night, or to pick up the star caught on the edge in even smaller apertures.

Like all planetary nebulae, seeing the central star is considered the ultimate achievement in viewing. The central itself is a peculiar bluish dwarf which gives off a continuous spectrum, and might very well be a variable. At times, this shy, near 15th magnitude star can be seen with ease with a 12.5″ telescope, yet be elusive to even 31″ in aperture weeks later. No matter what details you may see, reach for the “Ring” tonight. You’ll be glad you did.

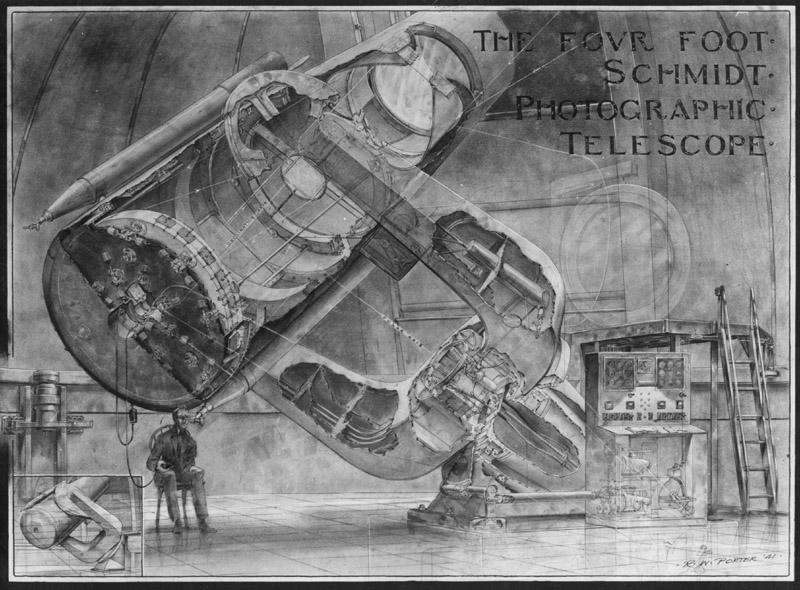
Saturday, September 20, 2008 – On this night in 1948, the 48″ Schmidt telescope at Mt. Palomar was busy taking pictures. Its very first photographic plate was being exposed by the same man who ground and polished the corrector plate for this scope – Don Hendricks. His object of choice was reproduced as panel 18 in the Hubble Atlas of Galaxies, and tonight we’ll join his vision as we take a look at the fantastic M31, the Andromeda Galaxy.

Seasoned amateur astronomers can literally point to the sky and show you the location of M31, but perhaps you have never tried to find it. Believe it or not, this is an easy galaxy to spot even under the moonlight. Simply identify the large diamond-shaped pattern of stars that is the Great Square of Pegasus. The northernmost star is Alpha, and it is here we will begin our hop. Stay with the northern chain of stars and look four fingerwidths away from Alpha for an easily seen star. The next along the chain is about three more fingerwidths away… And we’re almost there. Two more fingerwidths to the north and you will see a dimmer star that looks like it has something smudgy nearby. Point your binoculars there, because that’s no cloud – it’s the Andromeda Galaxy!

Now aim your binoculars or small telescope its way… Perhaps one of the most outstanding of all galaxies to the novice observer, M31 spans so much sky that it takes up several fields of view in a larger telescope, and even contains its own clusters and nebulae with New General Catalog designations. If you have a slightly larger telescope, you may also be able to pick up M31’s two companions – M32 and M110. Even with no scope or binoculars, it’s pretty amazing that we can see something – anything! – that is over two million light-years away!

Sunday, September 21, 2008 – On this date in 2003, the Galileo spacecraft bravely entered the atmosphere of Jupiter as it completed its final mission. Launched in 1989 and orbiting the giant planet since 1995, the hugely successful Galileo taught us much about Jupiter’s lethal radiation belts, magnetic field, atmosphere, and moons – but it had one last command to execute: self-destruction. Although it was still performing flawlessly (despite its lack of fuel and with its instrumentation badly scarred by radiation), scientists feared it might contaminate other possible life-sustaining moons such as Europa, and the decision was made to aim it into Jupiter’s certain oblivion. We salute its final moments!

And what was Sir William Herschel doing on this date a couple of centuries ago? You can bet he was out telescoping; and his discoveries on this night were many. How about if we take a look at two logged on September 21 which made the Herschel “400” list?

Our first stop is northern Cygnus for NGC 7086 (RA 21 30 30 Dec +51 35 00). Located on the galactic equator about five degrees west of Beta Cephei, our target is an open cluster. At magnitude 8.4, this loose collection will be difficult for the smaller scope, and show as not much more than an arrow-like asterism. However, larger scopes will be able to resolve many more stars, arrayed in long loops and chains around the brighter members. Although it’s sparse, NGC 7086 has been studied for metal abundance, galactic distance, membership richness, and its luminosity function. Be sure to mark your notes for H VI.32, logged by Herschel in 1788.

Now hop on over to Andromeda for NGC 752 (RA 01 57 41 Dec +37 47 06). You’ll find it just a few degrees south of Gamma and in the field north of star 56. Located 1300 light-years away, there’s a strong possibility this cluster was noted first by Hodierna before being cataloged by Herschel on this night (1786). At near magnitude 5, this “400” object is both large and bright enough to be seen in binoculars or small telescopes, and people have often wondered why Messier did not discover it. The star-studded field containing about 70 members of various magnitudes belong to H VII.32 – a very old cluster which has more recently been studied for its metallicity and the variations in the magnetic fields of its members. Enjoy them both tonight! Sir William did…

Until next week, I will you clear skies and happy hunting!

This week’s awesome images are: M57 “Ring Nebula” – Credit: NOAO/AURA/NSF, 48″ Schmidt Scope (Drawing by Russell Porter) – Credit: Palomar Observatory courtesy of Caltech, The Andromeda Galaxy – Credit: Anonymous, Artist’s concept of Galileo – Credit: NASA, NGC 7086 – Credit: Palomar Observatory, courtesy of Caltech and NGC 752 – Credit: Palomar Observatory, courtesy of Caltech. Our many thanks!

The Moon Meets The Pleiades On September 19-20, 2008

Be sure to mark your calendar for tomorrow night. For lucky observers in northeastern North America, eastern Canada, and western Europe, the evening of September 19-20, 2008 is your opportunity to watch the face of the peaceful gibbous Moon glide across the ancient blue beauty of the Plieades…

On Friday night, September 19, 2008, observers in northeastern North America, eastern Canada need to be outdoors and ready when the Moon begins to rise low in the east-northeast. If you live in Western Europe, the event takes place high in the sky just before dawn on the morning of September 20th. Don’t come alone, bring binoculars or a telescope with you, because this is your chance to see the stars first disappear behind the Moon’s bright limb and then reappear on the dark side.

Although we rarely call the Pleiades by name, let’s try them on for size. The brightest is Alcyone at magnitude 2.86, followed by Atlas at 3.62, Electra at 3.7, Maia at 3.86, Merope at 4.17 and Taygeta at magnitude 4.29. While it may be a bit difficult for a novice to read the occultation information, please check this occultation information at IOTA where you can get precise times for your location for the disappearance and reappearance of each individual star.

To help you understand a bit further, let’s choose Alycone. Click on the September 20th category for the US and let’s choose Cleveland, Ohio. Alycone would disappear behind the bright limb of the Moon at 02:14:09 UT (which would be 10:14:09 pm, September 19th). Alycone will re-emerge from behind the dark edge of the Moon at 02:45:47 UT (or 10:45:47 pm). See? It’s not that hard! The most difficult part is simply figuring out the universal time difference is all it takes, and there’s even a website for that!

While you can watch the event without any optical aid, the Moon will overpower the stars. Use a card or something held at arm’s length to help diminish the glare. However, if you’re serious? A telescope is the key to really enjoying this event. It is great fun to keep tabs on each star as it slowly approaches the lunar limb and then just winks out! Timing of these events is critical, because it helps astronomers to further understand lunar features. How? By assessing times, astronomers are able to determine if there are peaks and valleys that we simply do not know about. For example, a bright star may wink off and on several times before it finally disappears behind a hidden lunar mountain… and the same holds true when it reappears.

Although the Moon frequently encounters the Pleiades on each monthly journey across the ecliptic plane, it’s infrequent that we have such a great opportunity to watch several occultation events in a well-placed area of the sky during a comfortable time of the year. Enjoy this great event…

Images accompanying this article are the Pleiades Occultation by John Cudworth and the annotated image of the Plieades by David Malin, courtesy of the Anglo-Australian Observatory/University of Edinburgh.

Planet Closest to the Sun

Mercury seen by Mariner 10. Image credit: NASA

[/caption]Mercury, the planet closest to the Sun, is a study in extremes and offers many surprises. The extremes of the planet have made it an understudied body in our Solar System, though the MESSENGER mission is trying to change that as you are reading this article.

In addition to being the planet closest to the Sun, Mercury is also the smallest by mass. If you ignore the former planet Pluto, it is also the smallest by surface area, as well. The planet has the most eccentric orbit: at perihelion it is 46,001,200 km from the Sun and at aphelion it is 69,816,900 km. The planet’s short orbital period(87.969 Earth days) and slight axial tilt combine to make the day on Mercury(116 Earth days) longer than the year.

The average temperature on the planet is 442.5°K. Because of the planet’s thin atmosphere there is a wide temperature range, 100°K to 700°K. The temperature at the equator can be as much as 300°K more than the temperature at the poles. Despite its proximity to our central star, the poles of the planet are thought to have water ice hidden within impact craters. Claims for water ice are substantiated by observations by the 70 m Goldstone telescope and the Very Large Array. There are areas of very high radar reflection at the pole areas so, since water is highly reflective of radar, astronomers believe that water ice is the most likely cause of this reflection.

Due to its size and average temperatures, the planet’s gravity can not retain a significant atmosphere over a long period. It does have a negligible surface-bounded exosphere that is dominated by hydrogen, helium, oxygen, sodium, calcium, and potassium. Atoms are continuously being lost and replenished from this exosphere. Hydrogen and helium atoms are thought to derive from the solar wind that buffets the planet. These elements diffuse into Mercury’s magnetosphere before escaping back into space. Radioactive decay within the crust is a source of helium, sodium, and potassium.

Mercury has been explored by two mission: Mariner 10 and MESSENGER. Mariner 10 was able to map 40-45% of Mercury’s surface through more than 2,800 photos. It revealed a more or less moon-like surface, a slight atmosphere, a magnetic field, and a large iron rich core. MESSENGER was launched in August of 2004. After a 31/2 year flight, it made its first flyby in January 2008 and arrived in orbit on March 18, 2011. So far, the probe has discovered large amounts of water in the exosphere, evidence of past volcanic activity, and evidence of a liquid planetary core.

As the MESSENGER mission continues, the closest planet to the Sun should continue to reveal more surprises for the scientists at NASA. It appears a new age of discovery has begun for Mercury.

We have an extensive section just on Mercury on Universe Today. And did you know there’s a spacecraft visiting Mercury called MESSENGER? You can read news about this mission here.

Here’s a link to NASA’s Solar System Exploration Guide on Mercury.

We have recorded an episode of Astronomy Cast just about the Sun called The Sun, Spots and All.

References:
Wikipedia: Mercury
NASA Solar System
NASA: Messenger Mission

Where is the Sun?

Map of the Milky Way. Image credit: Caltech

[/caption]
I’m sure you know that we live in the Milky Way galaxy, but where is the Sun located? And how did astronomers figure out where the Sun is located, since we’re living inside the galaxy?

The Milky Way is a grand spiral galaxy, which astronomers think has four major spiral arms: Perseus, Cygnus, Scutum-Crux, Sagittarius. Some astronomers think we might actually just have two arms, Perseus and Sagittarius. The Sun is located in the inner rim of the Orion Arm, which is thought to be an offshoot of the Sagittarius Arm. The Sun is located about 26,000 light-years away from the center of the galaxy.

Before telescopes, the Milky Way just looked like a bright area in the sky, but when Galileo first turned his telescope on the region in 1610, he realized that it was actually made up of faint stars. The astronomer Immanuel Kant correctly guessed that this might be a cloud of stars held together by gravity, like the Solar System.

The famous astronomer William Herschel attempted to map out the stars in the Milky Way to get a sense of the galaxy’s size and shape, and determine the Sun’s position in it. From Herschel’s first map, it appeared the Sun was at the center of the Milky Way. It was only later on that astronomers realized that gas and dust was obscuring our view to distant parts of the galaxy, and that we were actually in the outer region of the Milky Way.

The astronomer Harlow Shapley accurately determined where the Sun is in the MIlky Way in the early 20th century by noticing that globular clusters were uniformly located above and below the Milky Way, but they were concentrated in the sky towards the constellation Sagittarius. Shapely realized that many globular clusters must be blocked by the galactic core. He created one of the most accurate maps of the Milky Way.

It wasn’t until the 20th century, with the development of larger and more powerful telescopes that astronomers could see the shape of other spiral galaxies, located millions of light-years away. In 1936, Edwin Hubble used cepheid variables as yardsticks to measure the distances to many galaxies, and prove conclusively that the Universe was filled with galaxies, each with as many stars as our own Milky Way.

Here’s an article from Universe Today about how the Milky Way might actually just have two spiral arms, and the largest picture ever taken of the Milky Way.

Here’s an article about the Great Debate that Harlow Shapley had about the nature of the Milky Way. And here’s Shapley’s obituary, published in Nature in 1972.

We have recorded an episode of Astronomy Cast just about the Sun called The Sun, Spots and All.

Reference:
NASA’s Imagine the Universe!

Just Another Harvest Moon…

September 26, 2007 APOD - Saguaro Moon by Stefan Seip

[/caption]

Actually, the official time was September 15 at 5:13 a.m. EDT, but missing the exact time isn’t going to stop a little beauty from happening tonight. What else can I say except “Come a little bit closer.. Hear what I have to say. Just like children sleepin’… We could dream this night away. But there’s a full moon risin’… Let’s go dancin’ in the light. We know where the music’s playin’… Let’s go out and feel the night…”

I love Harvest Moon time – mainly because there’s so much folklore and legend attached to it. Here in the heartland, we associate it with tractors in the field, working late into the night gathering the harvest by the light of our nearest astronomical neighbor. It’s a romantic and fanciful thought – especially since modern tractors just combine the stuff down with headlights approximately bright enough to land a Boeing 747. However, it’s still a lot of fun to think about old cultures like the Norse folks who believed the Moon granted them Loki’s blessing for plenty. I’ve heard it called the Singing Moon, too… A time for rest after harvest, sit around, sing some songs, smoke a peace pipe. Or, you can celebrate with the Celtics. They called it the Wine Moon, eh? No matter what your choice may be, the whole object is to be mellow.

But, hey! What’s mellow without a little science behind it? What constitutes the Harvest Moon most of all is that it’s closest to Equinox. Just this little tidbit and the change of seasons ought to give you a clue of what’s going on. Most of time during the year, the Moon comes along about 50 minutes later each night, but as the tilt of our Earth is gradually changing, that time is a bit shorter – by around 20 minutes for several evenings in a row. Why? The answer is easy enough. The ecliptic – or plane of Earth’s orbit around the sun – makes a narrow angle with respect to the horizon in the evening in autumn.

Is it really more orange or yellow than normal? How about larger? Oh, yes. You want those science facts, don’t you? Sure! Why not… Oftentimes we perceive the Harvest Moon as being more orange than at any other time of the year. The reason is not only scientific enough – but true. Coloration is caused by the scattering of the light by particles in our atmosphere. When the Moon is low, as it is now, we get more scattering effect and it truly is a deeper orange. The very act of harvesting itself also produces dust and oftentimes that color will last through the whole night. As for larger? Well, that’s just an illusion. Everyone knows the Moon looks larger on the horizon, but did you know this is a psychological phenomenon and not a physical one? Prove it to yourself by looking at the rising Moon upright…it looks larger, doesn’t it? Now stand on your head, or find a comfortable way to view it upside down…now how big is it?

Go on out tonight and enjoy the Harvest Moon… “Harvest moon… I see the days grow shorter. I feel the nights grow cold. Harvest moon… Young people feeling restless. Old people feeling old. Harvest moon… I sense the darkness clearer. I feel the presence here. Harvest moon… A change in the weather. I love this time of year. Harvest Moon….”