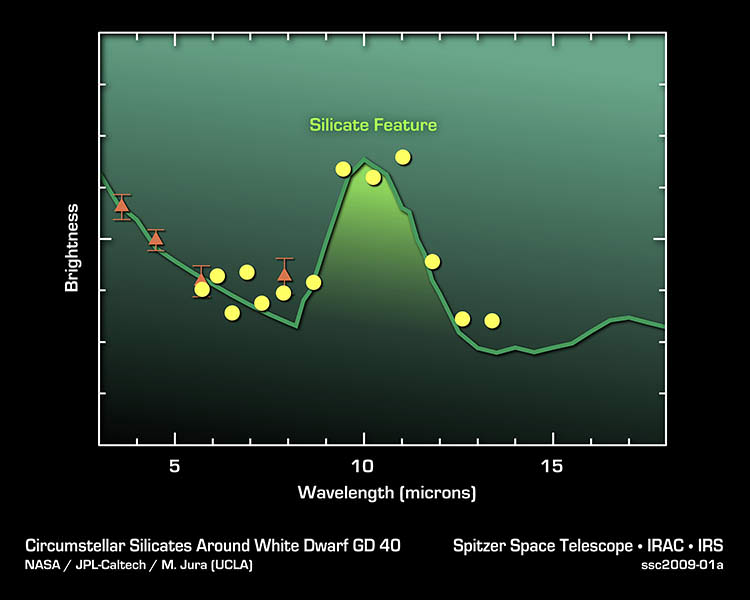
Silicates in Alien Asteroids. Credit: NASA/JPL/Caltech
[/caption]
Infrared spectroscopy is spectroscopy in the infrared (IR) region of the electromagnetic spectrum. It is a vital part of infrared astronomy, just as it is in visual, or optical, astronomy (and has been since lines were discovered in the spectrum of the Sun, in 1802, though it was a couple of decades before Fraunhofer began to study them systematically).
For the most part, the techniques used in IR spectroscopy, in astronomy, are the same or very similar to those used in the visual waveband; confusingly, then, IR spectroscopy is part of both infrared astronomy and optical astronomy! These techniques involve use of mirrors, lenses, dispersive media such as prisms or gratings, and ‘quantum’ detectors (silicon-based CCDs in the visual waveband, HgCdTe – or InSb or PbSe – arrays in IR); at the long-wavelength end – where the IR overlaps with the submillimeter or terahertz region – there are somewhat different techniques.
As infrared astronomy has a much longer ground-based history than a space-based one, the terms used relate to the windows in the Earth’s atmosphere where lower absorption spectroscopy makes astronomy feasible … so there is the near-IR (NIR), from the end of the visual (~0.7 µm) to ~3 µm, the mid (to ~30 µm), and the far-IR (FIR, to 0.2 mm).
As with spectroscopy in the visual and UV wavebands, IR spectroscopy in astronomy involves detection of both absorption (mostly) and emission (rather less common) lines due to atomic transitions (the hydrogen Paschen, Brackett, Pfund, and Humphreys series are all in the IR, mostly NIR). However, lines and bands due to molecules are found in the spectra of nearly all objects, across the entire IR … and the reason why space-based observatories are needed to study water and carbon dioxide (to take just two examples) in astronomical objects. One of the most important class of molecules (of interest to astronomers) is PAHs – polycyclic aromatic hydrocarbons – whose transitions are most prominent in the mid-IR (see the Spitzer webpage Understanding Polycyclic Aromatic Hydrocarbons for more details).
Looking for more info on how astronomers do IR spectroscopy? Caltech has a brief introduction to IR spectroscopy. The ESO’s Very Large Telescope (VLT) has several dedicated instruments, including VISIR (which is both an imager and spectrometer, working in the mid-IR); CIRPASS, a NIR integrated field unit spectrograph on Gemini; Spitzer’s IRS (a mid-IR spectrograph); and LWS on the ESA’s Infrared Space Observatory (a FIR spectrometer).
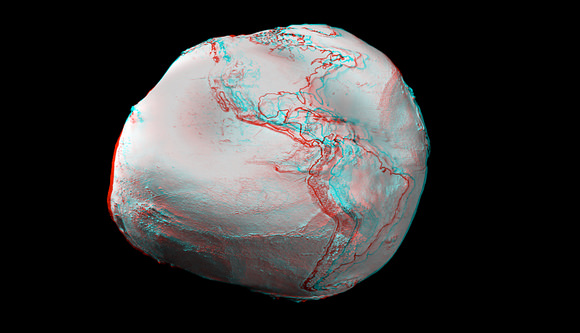
Anaglyph images created from an ESA video animation of global gravity gradients. A more accurate global map will be generated by ESA's GOCE craft. Credit: ESA and Nathaniel Burton Bradford.
[/caption]
The constant of gravity, or gravity constant, has two meanings: the constant in Newton’s universal law of gravitation (so is commonly called the gravitational constant, it also occurs in Einstein’s general theory of relativity); and the acceleration due to gravity at the Earth’s surface. The symbol for the first is G (big G), and the second g (little g).
Newton’s universal law of gravitation in words is something like “the gravitational force between two objects is proportional to the mass of each and inversely proportional to the square of the distance between them“. Or something like F (the gravitational force between two objects) is m1 (the mass of one of the objects) times m2 (the mass of one of the other object) divided by r2 (the square of the distance between them). The “is proportional to” means all you need to make an equation is a constant … which is G.
In other words: F = Gm1m2/r2
The equation for little g is simpler; from Newton we have F = ma (a force F acting on a mass m produces an acceleration a), so the force F on a mass m at the surface of the Earth, due to the gravitational attraction between the m and the Earth is F = mg.
Little g has been known from at least the time of Galileo, and is approximately 9.8 m/s2 – meters per second squared – it varies somewhat, depending on how high you are (altitude) and where on Earth you are (principally latitude).
Obviously, big G and little g are closely related; the force on a mass m at the surface of the Earth is both mg and GmM/r2, where M is the mass of the Earth and r is its radius (in Newton’s law of universal gravitation, the distance is measured between the centers of mass of each object) … so g is just GM/r2.
The radius of the Earth has been known for a very long time – the ancient Greeks had worked it out (albeit not very accurately!) – but the mass of the Earth was essentially unknown until Newton described gravity … and even afterwards too, because neither G nor M could be estimated independently! And that didn’t change until well after Newton’s death (in 1727), when Cavendish ‘weighed the Earth’ using a torsion balance and two pairs of lead spheres, in 1798.
Big G is extremely hard to measure accurately (to 1 part in a thousand, say); today’s best estimate is 6.674 28 (+/- 0.000 67) x 10-11 m3 kg-1 s -2.
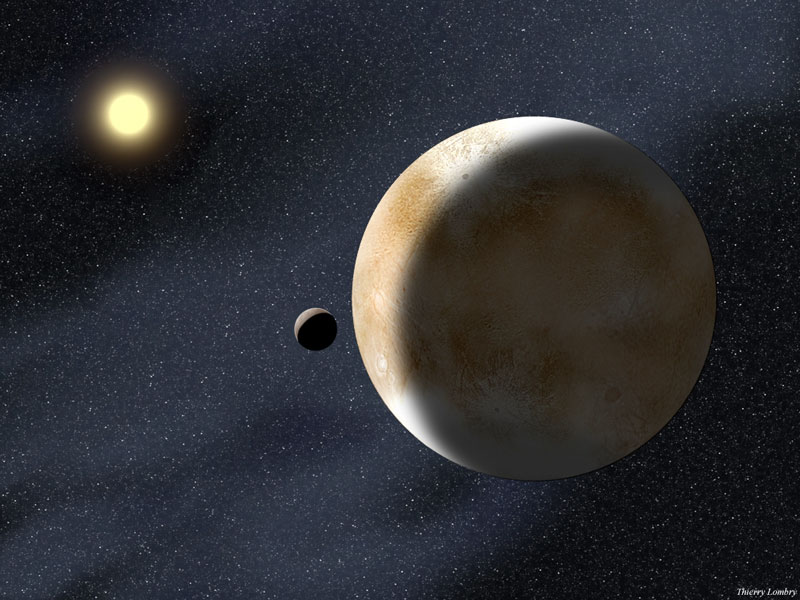
In 2003, a celestial object was discovered, but little did astronomers know that this object, which was designated 2003ub313, was going to change astronomy forever. Although the object was first photographed in 2003 by Mike Brown and other astronomers, it was not until 2005 that astronomers announced their discovery. You may better know 2003 ub 313, which was its designation given when it was believed to be a minor planet, as Eris. Eris made such a fuss because it is larger than Pluto – 27% more massive. Some people labeled it as the tenth planet while others did not think it should join the ranks of the nine planets we had. Finally, the International Astronomical Union (IAU) met to decide on a definition of a planet. Eventually, they decided on a definition in 2006, and 2003ub313 was not classified as a planet but rather a dwarf planet. In addition to Eris, Pluto was reclassified as a dwarf planet, and several other celestial bodies – including Ceres, Haumea, and Makemake – were classified as dwarf planets. Astronomers are evaluating dozens more celestial bodies to see whether they fall under the classification of dwarf planets.
Eris is the ninth largest celestial body in our Solar System that orbits the Sun and the most distant object orbiting the Sun. It takes the dwarf planet 556.7 years to orbit our star. Eris is located in the scattered disc, which is a region beyond the Kuiper Belt. In addition to being a dwarf planet, Eris is also classified as a Trans-Neptunian Object (TNO). The surface of the dwarf planet is grey, and astronomers believe that the surface is covered with methane ice, which is what causes it to appear grey. Methane is the same substance that makes Uranus and Neptune blue. Scientists think that Eris’ composition is similar to that of Pluto. Eris also has a very eccentric orbit, and it is also highly inclined. At some point in its orbit, Eris will actually be closer to the Sun than Pluto will be.
Like most celestial bodies, Eris was named after a figure in mythology. Eris was the Greek goddess of strife and discourse. Many believe this is a very fitting name for the dwarf planet, which caused so much division over the definition of a planet and the fate of Pluto. The dwarf planet Eris also has a moon, which was named Dysnomia. Dysnomia was Eris’ daughter in Greek mythology and the demon of lawlessness.
Need to know the answer to this week’s Where In The Universe Challenge? Find out back at the original post. And check back next week for another test of your visual knowledge of the cosmos!
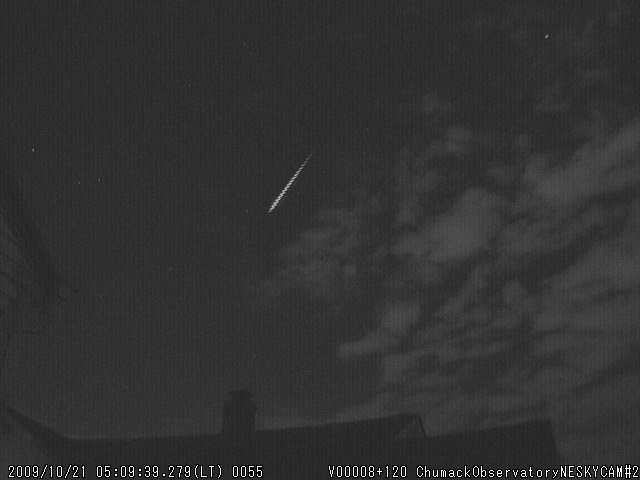
If you had the opportunity this morning to witness the offspring of Comet Halley, then I’m curious as to what you might have noticed about this reliable annual meteor shower.
The Orionid Meteor Shower produces an average of 10-20 meteors per hour maximum, with activity beginning before local midnight on October 20th, and reaches its peak as Orion stands high to the south about two hours before local dawn October 21st. The radiant (or point of origin) is roughly between Betelgeuse and the “feet” of Gemini. Also on an average is the magnitude – 3 – and most people describe the appearance as fast.
As a seasoned meteor-watcher and reporter, I document times, magnitudes, length of trails, duration, activity, numbers, etc. By the book, the Orionids behaved pretty much as they should have. They reached the predicted average fall rate, came screaming into our atmosphere at 140,000 mph peaking at the predicted local time, but this morning I noticed a little something different. Rather than branch out around the radiant like spokes on a wheel, the bulk of the activity seemed to occur down a narrow corridor.
On speaking with John, I noticed we both picked up on the same peak activity time – around 10:00 UT. And, upon reviewing his film, I also noticed it captured what I witnessed… The strong activity was centered on area about 10 degrees wide that ran right up the center of the constellation of Gemini. Of course, it’s natural that John and I should get relatively the same results since my observing station is only about 150 km to his north… But I’m curious!
For those that had an opportunity to observe the Orionids from a much different location, did the activity seem to be centered on a certain area at a certain time? Did the majority of the meteors seem to be brighter than the average magnitude 3? Please feel free to post your comments here!
[/caption]
There are some amazing resources on the Internet that will let you track and find satellites in the sky. Did you know that the International Space Station is the brightest manmade object in the sky? It’s easy to see if you know when and were to look. So, this article should give you some good satellite finder resources, so you can track down and bag sightings of satellites.
The first place to start is NASA’s tracking page for the International Space Station, space shuttle and Hubble Space Telescope. This tells you where the spacecraft currently are, and also give you a way to find out when the spacecraft are going to be flying over your part of the world. They have a quick list of common locations, but you can also enter your latitude and longitude, and the system will give you some sighting opportunities.
Next, check out the Real Time Satellite Tracking page. This shows you the current position of thousands of satellites, and lets you see what’s overhead right now. You can set up satellite finders to watch the position of certain satellites. It’s an amazing resource.
Another great tool is Heaven’s Above. It lets you put in your local address, and then get predictions for satellites that will be overhead in the next few days. You can see the current position of the International Space Station, and much more.
If you have an iPhone, here’s a cool app that lets you find out the current location of the International Space Station and the space shuttle (if it’s in orbit right now).
If you have a satellite dish, and you need a satellite finder to maximize the strength of the signal, here’s a link to a Satellite finding kit from Amazon.com. It lets you finely tune the direction of your satellite dish to get the best signal from the satellite.
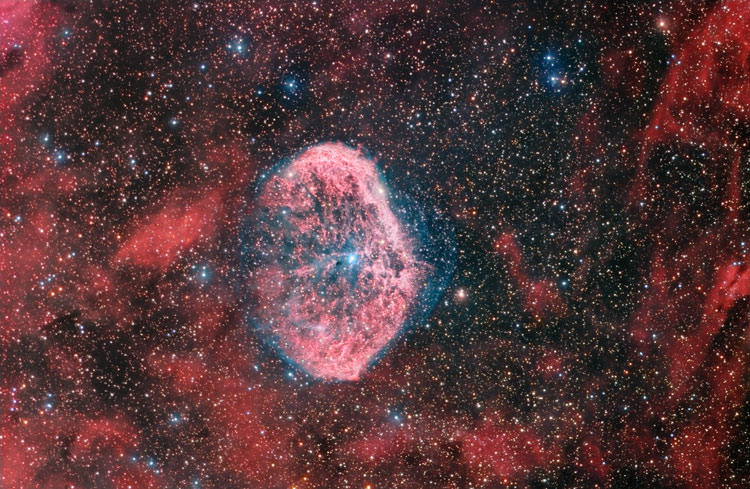
The Crescent Nebula by Dietmar Hager and Immo Gerber
[/caption]
The Crescent Nebula, also known as NGC 6888, is a very well renown and most intriguing object located in the constellation Cygnus in the northern hemisphere. At an apparent size of about 18 by 13 arc-minutes it is a very pale nebula. Even in a moderate amateur telescope you can’t quite see this one unless you have absolute dark skies (or narrow band filters) and a decent “light bucket”. So how do we get a chance to study it? Photographically, of course…
Spanning some 25 by 18 light years, gazing at NGC 6888 means we are looking 4700 years into the past, a past that renders a nebula fueled and excited by the blue star at the center. And not just any blue star – but a high mass super-giant star – one that depleted its fuel at “full speed”. Not only was it a super giant, but hot… in the class of “Wolf Rayet” stars (HD 192163). Now, after only a couple of million years the “stellar gas” is almost used up and the star is standing right before a significant change: a supernova candidate. Behold a star that vents its outer layers into space at terrific speed!
“Images are used to constrain models of the ionization structure of nebular features.” says Brian D. Moore (et al) of the Department of Physics and Astronomy, Arizona State University, “From these models, we infer physical conditions within features and estimate elemental abundances within the nebula. The results of our analysis, together with the degree of small-scale inhomogeneity apparent in the images, call into question the assumptions underlying traditional methodologies for interpretation of nebular spectroscopy. The thermal pressure of photoionized clumps is higher than the inferred internal pressure of the shocked stellar wind, implying that the current physical conditions have changed significantly over less than a few thousand years.”
While the central star sustains severe loss of mass, the gas is holding lots of oxygen and hydrogen… just before the individual big “bang” of the WR-star creating a “hot bubble” whose struture can’t quite be explained yet. “A detailed analysis of the H I distribution at low positive velocities allowed us to identify two different structures very probably related to the star and the ring nebula. From inside to outside they are: (1) an elliptical shell, 11.8×6.3 pc in size, that embraces the ring nebula (labeled inner shell); and (2) a distorted H I ring, 28 pc in diameter, also detected in IR emission (outer shell). The borders of the inner shell strikingly follows the brightest regions of NGC 6888, showing the sites where the interaction between the nebula and the surrounding gas occurs. A third structure, the external feature, is a broken arc detected at slightly higher velocities than the former shells.” says Christina Cappa (et al), “We propose a scenario in which the strong stellar wind of HD 192163, expanding in an inhomogeneous interstellar medium, blew the outer shell during the main sequence phase of the star. Later, the material ejected by the star during the LBV (or RSG) and WR phases created NGC 6888. This material encountered the innermost wall of the outer shell originating the inner shell. The association of the external feature with the star and the nebula is not clear.”
For a look inside, view the full size image!
Many thanks to Dietmar Hager and Immo Gerber of TAO-Observatory for sharing this incredible image!
Further to AAVSO Alert Notice 367 and Special Notices 127 and 141, the AAVSO requests twilight observations of the recurrent nova U Scorpii prior to its solar conjunction in late 2009. These observations are in support of the long-term campaign by Dr. Bradley Schaefer (LSU) to catch this very fast nova during its rise.
AAVSO Special Notice #171: In 2008, the last ground-based observation of U Sco was made on 2008 November 2 (S. Kerr,
Glenlee, QLD, Australia). Observers are asked to do the best they can to observe U Sco as close to the Sun as possible. For this project, fainter-than observations are just as important as positive ones, and observers are asked to report all observations as promptly as possible via AAVSO WebObs.
U Sco is located at the following (J2000) coordinates:
RA:16:22:30.80, Dec: -17:52:43.0
Charts for U Sco may be plotted using AAVSO VSP: http://www.aavso.org/observing/charts/vsp/index.html?pickname=U%20Sco
(AAVSO Special Notice was prepared by M. Templeton)
Located north of Antares, U Scorpii is one of the most famous recurrent novae… and one of the fastest known. Able to shoot up to 8 or 9 magnitudes in less than 6 hours, dedicated observers are predicting that 2009 should see this cataclysmic variable star erupt with a vengeance. “I’ve calculated that the recurrent nova U Scorpii, north of Antares and east of the head of Scorpius, should explode any month now.” says Bradley E. Schaefer of Sky & Telescope, “My ‘crystal ball’ is based on old archival photographs and data from amateur astronomers. This brings a golden opportunity for amateurs and professionals to catch the early hours of a nova eruption and to prepare in advance for an intensive observing campaign.”
While professional observatories and NASA’s Swift Satellite will be busy gathering information about any possible eruption, there’s more than enough room for amateur observations. While it’s great to have modern equipment and credited astronomers to capture the action, their eyes can’t watch 24/7 – and chances are good that any outburst may very well be captured by ordinary viewers working in the field. “Amateurs provided essentially the whole light curves for the last three eruptions.” says Brad, “Now, with some advance warning to allow preparations, and with a little luck, the upcoming eruption of U Sco could produce the best record of a nova outburst — of any kind — ever.”
Please promptly report all observations to the AAVSO with the name “U SCO”.
[/caption]
There are thousands of satellites overhead in space right now, and many of them are being used to map every single square meter of planet Earth. And many of these images are being freely distributed on the Internet so you can access them through any browser. If you’re looking for a satellite map, there are many services out there that can help you out.
Probably the easiest and best place to start is with the Google Maps service from Google. This allows you to see a satellite map of the entire Earth. You can drag around the map to browse around the planet, and you can zoom out and in right down to the highest resolution images they have in their server. In many cases this means you can see your house, your yard, and even your car parked out in the street. You can also type in a specific address location and go straight there. There are street maps you can overlay or remove, you can get driving directions, and much more. And the Google Maps API has been made available by Google to other websites, so people are developing mashups that let you track running routes and find the nearest bathroom.
An even cooler satellite mapping service is Google Earth. Unlike Google Maps, you have to download Google Earth to your local PC, Mac or Linux machine (there’s even an iPhone version). Then you get this cool spinning 3-D version of the Earth. You can zoom out and in, type in a specific location address or geocode to find any spot on Earth. They also have a big library of additional layers that you can put over top, to see additional information mapped on the Earth. It’s well worth the download.
Another good service is TerraServer; they let you buy satellite maps if you want a nice printed version for your wall. If you don’t want to use Google, there are similar mapping tools from Microsoft and Yahoo.
We have written many articles about how satellites are being used to map the Earth. Here’s an article about how scientists use satellite photos to track penguin poop from space, and how Google’s maps had a satellite view of Obama’s inauguration.
We have also recorded an episode of Astronomy Cast all about Earth. Listen here, Episode 51: Planet Earth.
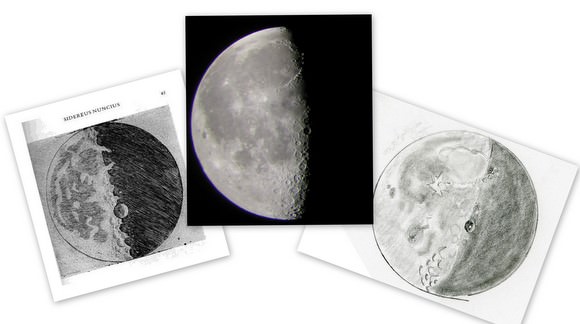
A collage of 21-day old Moons, sketched by Galileo, (left), an image from Jane Houston Jones' telescope, center, and Jane's sketch, right.
[/caption] A collage of 21-day old Moons, sketched by Galileo, (left), an image from Jane Houston Jones’ telescope, center, and Jane’s sketch, right.
Amateur astronomers have different ways of documenting their observing sessions, such as taking astrophotos or keeping a logbook. Others, like Jane Houston Jones, employ an age-old method used by Galileo Galilei himself: they take pen in hand and sketch what they see through the lens of their telescope. During this International Year of Astronomy, Jones – an amateur astronomer who also happens to work at the Jet Propulsion Laboratory — wanted to do something special to honor the legacy of Galileo, and decided to follow through with something she has been considering for quite a while. Jones is recreating all of Galileo’s astronomical sketches as she looks through a telescope similar in size to the one used by the father of modern observational astronomy. “Every time I look through a small telescope at these same objects that Galileo did, it just gives me chills,” Jones said. “It fills me with wonder every time I think that I’m seeing the same view Galileo saw 400 years ago, and I wonder what was going through his mind as he made his observations.”
Sketching isn’t new for Jones, a Senior Outreach Specialist for the Cassini mission to Saturn. “When I made my very first telescope in 1989, the first thing I did was draw pictures of what I observed,” she said, “and I’ve just continued it. It makes a wonderful journal or diary of everything you do with a telescope.” Jane Houston Jones' telescope alongside a replica of Galileo's telescope. Credit: Jane Houston Jones
Galileo’s first telescope had an objective diameter of 37 mm, a focal length of 980 mm, and the instrument’s magnification was 21.
Jones is using a small refractor, a Televue Ranger, which has an objective diameter of 70mm, a focal length of 480mm, and using a 25mm Zeiss Abbe Orthoscopic eyepiece, yields a comparable magnification of 19.
“My field of view is bigger than what Galileo had, but I have little less magnification, so in the end I’m getting about the same view that Galileo did. But 400 years later, with better optics, mine is easier to see,” she said. “For effect, I’m also using just a manual mount where I have to move the telescope myself up and down and side to side.”
But using a small telescope to make sketches is a challenging task, Jones is finding, and she has gained new appreciation for Galileo’s original astronomical drawings. “I’ve never observed and sketched through a small telescope before, so it’s a challenge,” she said. “I’ve always loved sketching the Moon, but I’ve usually used a much larger telescope and sketched one crater or a small feature on the terminator. I’ve never tried to sketch the whole Moon at once before, but I wanted to make the same sketches as Galileo. With his telescope, Galileo could only see a tiny portion of the Moon, maybe about 1/8 of the surface at once. And when he looked at a star cluster he couldn’t see, for example, all of the Pleiades in one view. So, I now wonder what kind of worksheet he prepared to try and connect the different views together into the larger view, because he certainly had to sweep through several views to make one sketch.” Galileo's sketch of Jupiter and its moons, and also Neptune.
Jones said her most memorable views during this Galilean exercise are some of the most basic things Galileo saw. “To me, the very coolest things I saw are the Galilean moons. Everybody who looks at Jupiter through a telescope sees the three or four little dots as the moons are orbiting around the planet. We take that for granted, seeing the moons lined up along the equator of Jupiter. But when Galileo looked at them, it was just amazing that he saw their movement and made the discovery.”
One of her most significant views included an object that Galileo didn’t realize was another, yet undiscovered planet. “Galileo also did a sketch showing the Galilean moons and one additional fixed star, which using modern astronomy software, we can go back to the same day of his observations, and now we know that fixed star was Neptune. To me, that was just so amazing to see all in one eyeview Jupiter, the four moons and another planet that at Galileo’s time, hadn’t been discovered yet, and wouldn’t be discovered for several hundred years.” Jane Houston Jones' sketch of Saturn from 2002. Courtesy Jane Houston Jones
Now, she is working sketching Saturn, which is interesting given Saturn just went through equinox, meaning the rings have “disappeared” from our vantage point on Earth. “When Galileo first looked at Saturn, he thought he saw three objects – the planet and the rings on both sides of Saturn, And of course he looked at Saturn again a few years later and the rings had disappeared. I’m working on getting my sketches of Saturn over the years to try and match up what Galileo sketched.”
After Saturn, Venus is her next target for sketching.
Since Jones has been sketching for 20 years, she said she won’t quit after the IYA. “To me it makes a diary that follows a tradition that goes back centuries. I like to do that, because I can then take my sketches and look at Galileo’s or other centuries-old views of the same objects and I have a connection with those observers because we held a pen or pencil in our hand while looking through an eyepiece and made notes of what we see. I like that. Plus it’s such a fun project and I’m learning so much about Galileo’s observations, as well as some of the current scholars who are documenting his observations and researching his sketches. It’s a great learning experience, besides the artistic and personal satisfaction of drawing something. It’s a great history lesson.”
In her day job at JPL, Jones does educational outreach for the Cassini mission, working with the public, museums, planetariums, astronomy clubs, and an international network of volunteers called the Saturn Observation Campaign. Additionally she is the Twitter voice of Cassini. But she also creates a monthly podcast for JPL called “What’s Up” about what is visible in the night sky each month. “It’s really neat to have astronomy part of my day job as well as my passion in life,” she said.
For more of Jones’ observations and sketches, check out her website, and this specific page about observing with a small refractor.