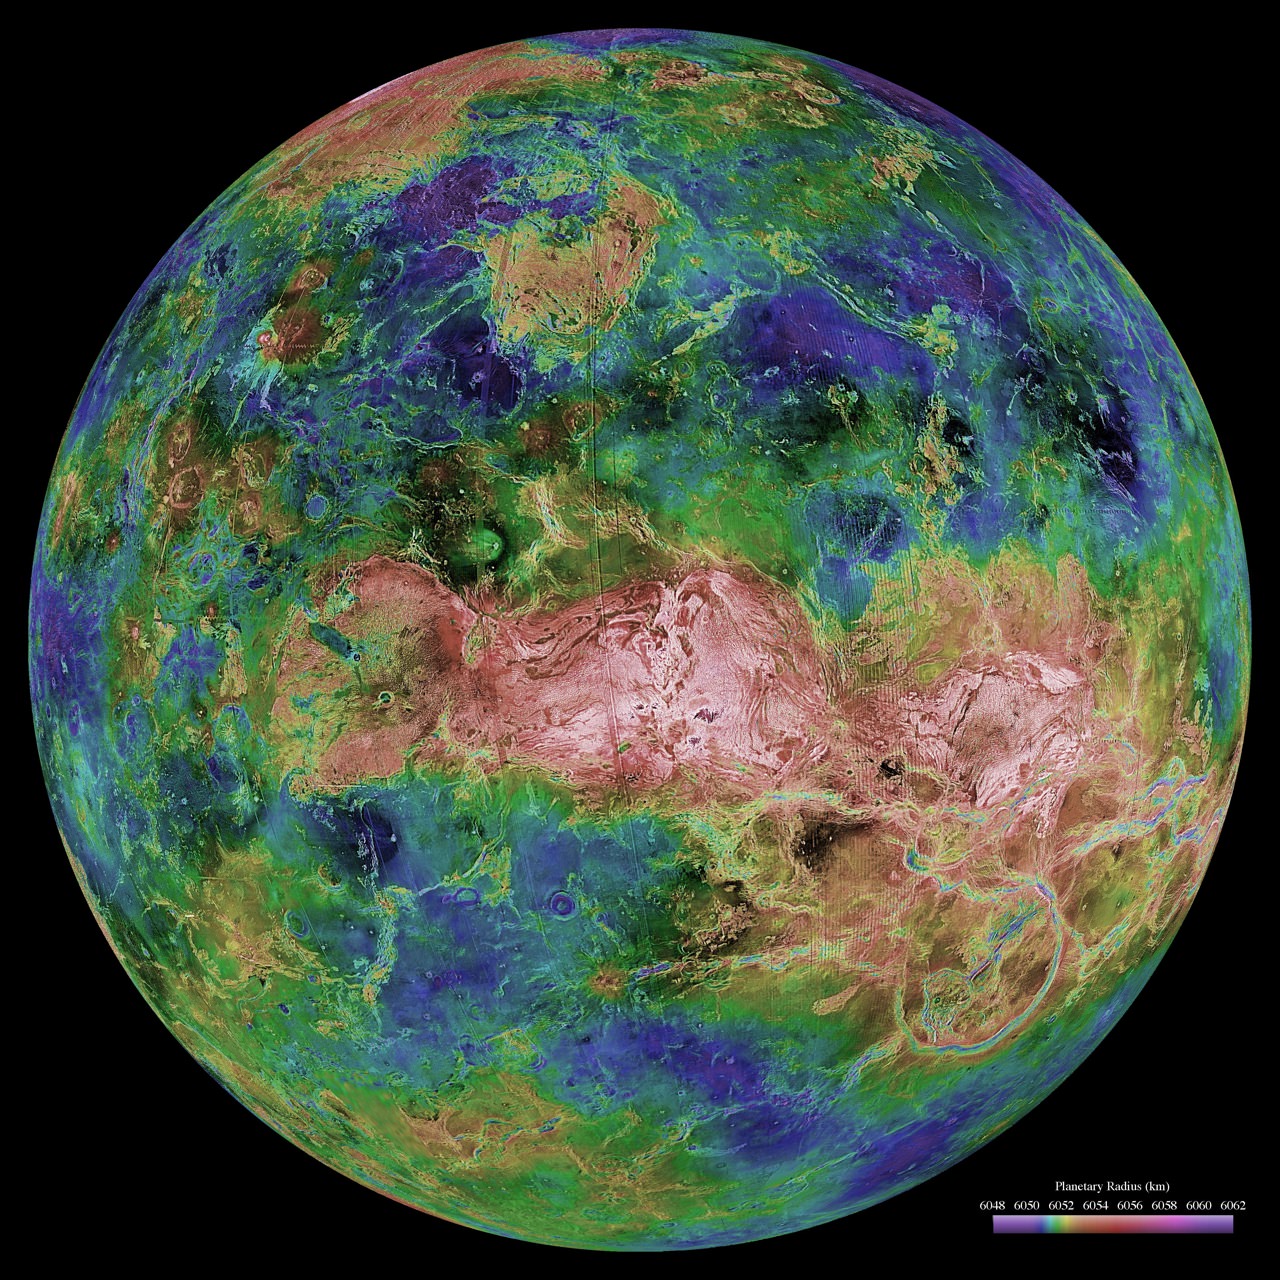
You might have heard that Venus is the hottest planet in the Solar System. In fact, down at the surface of Venus it’s hot enough to melt lead. But why is Venus so hot?
Three words: runaway greenhouse effect. In many ways, Venus is a virtual twin of Earth. It has a similar size, mass and gravity as well as internal composition. But the one big difference is that Venus has a much thicker atmosphere. If you could stand on the surface of Venus, you would experience 93 times the atmospheric pressure we experience here on Earth; you’d have to dive down 1 km beneath the surface of the ocean to experience that kind of pressure. Furthermore, that atmosphere is made up almost entirely of carbon dioxide. As you’ve probably heard, carbon dioxide makes an excellent greenhouse gas, trapping heat from the Sun. The atmosphere of Venus allows the light from the Sun to pass through the clouds and down to the surface of the planet, which warms the rocks. But then the infrared heat from the warmed rocks is prevented from escaping by the clouds, and so the planet warmed up.
The average temperature on Venus is 735 kelvin, or 461° C. In fact, it’s that same temperature everywhere on Venus. It doesn’t matter if you’re at the pole, or at night, it’s always 735 kelvin.
It’s believed that plate tectonics on Venus stopped billions of years ago. And without plate tectonics burying carbon deep inside the planet, it was able to build up in the atmosphere. The carbon dioxide built up to the point that any oceans on Venus boiled away. And then the Sun’s solar wind carried the hydrogen atoms away from Venus, making it impossible to ever make liquid water again. The concentration of carbon dioxide just kept increasing until it was all in the atmosphere.
If you’d like more info on Venus, here’s a cool lecture about Venus and the greenhouse effect, and here’s more information on the runaway greenhouse effect on Venus.
We’ve also recorded an entire episode of Astronomy Cast just about Venus. Listen here, Episode 50: Venus.
The length of day on Venus is 243 Earth days. Read that again, it’s not a year, but the length of a single day. In fact, a year on Venus is only 224.7 days, so a day on Venus is longer than its year. And things get even stranger. Venus rotates backwards. All of the planets in the Solar System rotate counter-clockwise when you look at them from above. But Venus turns clockwise.
Of course it’s impossible to stand on the surface of Venus and survive. And even if you could, you wouldn’t be able to see the Sun through the dense clouds. But if you could stand on Venus and see the Sun, you’d see the Sun rise in the West, pass through the sky for 116.75 days and then set in the East. That’s the opposite of what we see here on Earth.
Why does Venus rotate backwards? Astronomers aren’t sure, but it’s possible that Venus suffered a massive impact from a large planetoid billions of years ago. This could have given the planet a kick that set it slowly tumbling, eventually flipping completely over so that it’s now upside-down.
It’s no secret that astronomers claim that most of our universe is made of dark matter that cannot be readily detected. From Fritz Zwicky’s observations of the Coma clusters in the 1920’s which suggested that additional mass would be necessary to hold the cluster together, to the flat rotation curves of galaxies, to lensing in such places as the Bullet Cluster, all signs point to matter that neither emits nor absorbs any form of light we can detect. One possible solution was that this missing matter was ordinary, but cold matter floating around the universe. This form was called Massive astrophysical compact halo objects, or MACHOs, but studies to look for these came up relatively empty. The other option was that this dark matter was not so garden variety. It posed the idea of hypothetical particles which were very massive, but would only rarely interact. These particles were nicknamed WIMPs (for weakly interacting massive particles). But if these particles were so weakly interacting, detecting them would be a challenge.
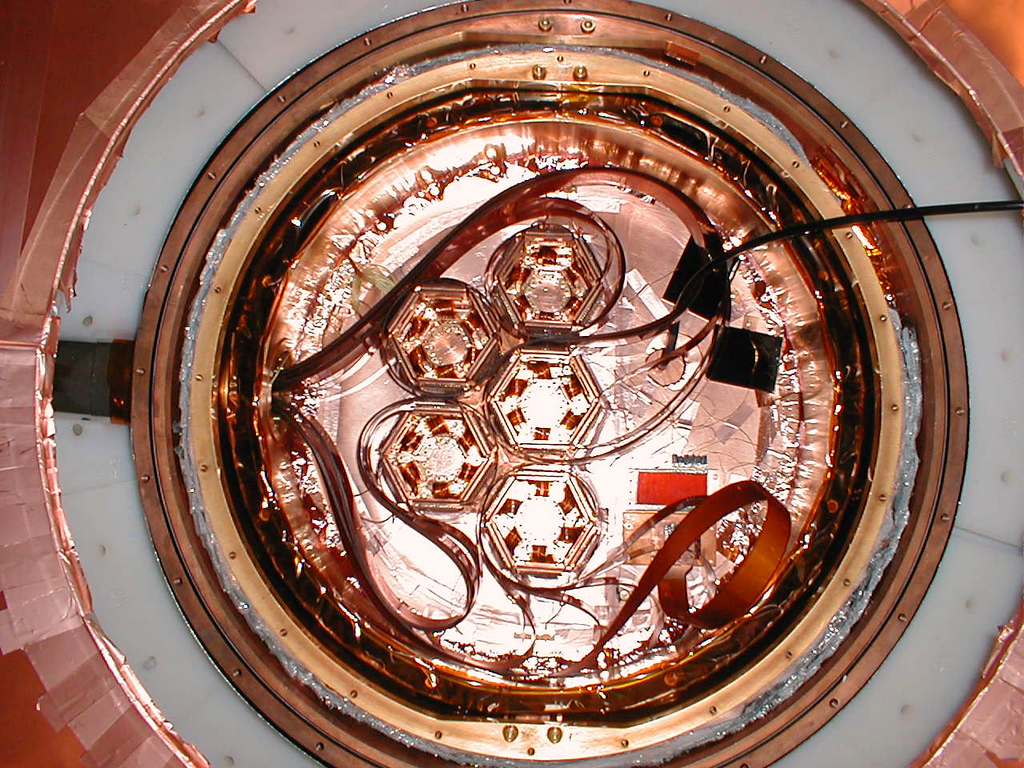
An ambitious project, known as the Cryogenic Dark Matter Search, has been attempting to detect one of these particles since 2003. Today, they made a major announcement.
The experiment is located a half-mile underground in the Soudan mine in northern Minnesota. The detector is kept here to shield it from cosmic rays. The detectors are made from germanium and silicon which, if struck by a potential WIMP, will become ionized and resonate. The combination of these two features allow for the team to gain some insight as to what sort of particle it was that triggered the event. To further weed out false detections, the detectors are all cooled to just above absolute zero which prevents most of the “noise” caused by the random jittering of atoms thanks to their temperature.
Although the detector had not previously found signs for any dark matter they have provided understanding of the background levels to the degree that the team felt confident that they would be able to begin distinguishing true events. Despite this, false positives from neutron collisions have required the team to “throw out roughly 2/3 of the data that might contain WIMPs, because these data would contain too many background events.”
The most recent review of the data covered the 2007-2008 set. After carefully cleaning the data of as many false events and as much background noise as possible the team discovered that two detection events remained. The significance of these two detections was the result of today’s conference.
Although the presence of these two detections from 8/5 and 10/27 2007, could not be ruled out as genuine dark matter detections, the presence of only two detections was not statistically significant enough to be able to truly stand out from the background noise. As the summary of results from the team described it, “Typically there must be less than one chance in a thousand of the signal being due to background. In this case, a signal of about 5 events would have met those criteria.” As such, there is only a 1:4 probability that this was a true case of a detection of WIMPs.
Astronomer turned writer, Phil Plait put it slightly more succinctly in a tweet; “The CDMS dark matter talk indicates two signals, but they are not statistically strong enough to say “here be dark matter”. Damn.”
This image is dedicated to our late friend Danny Marquardt.
[/caption]
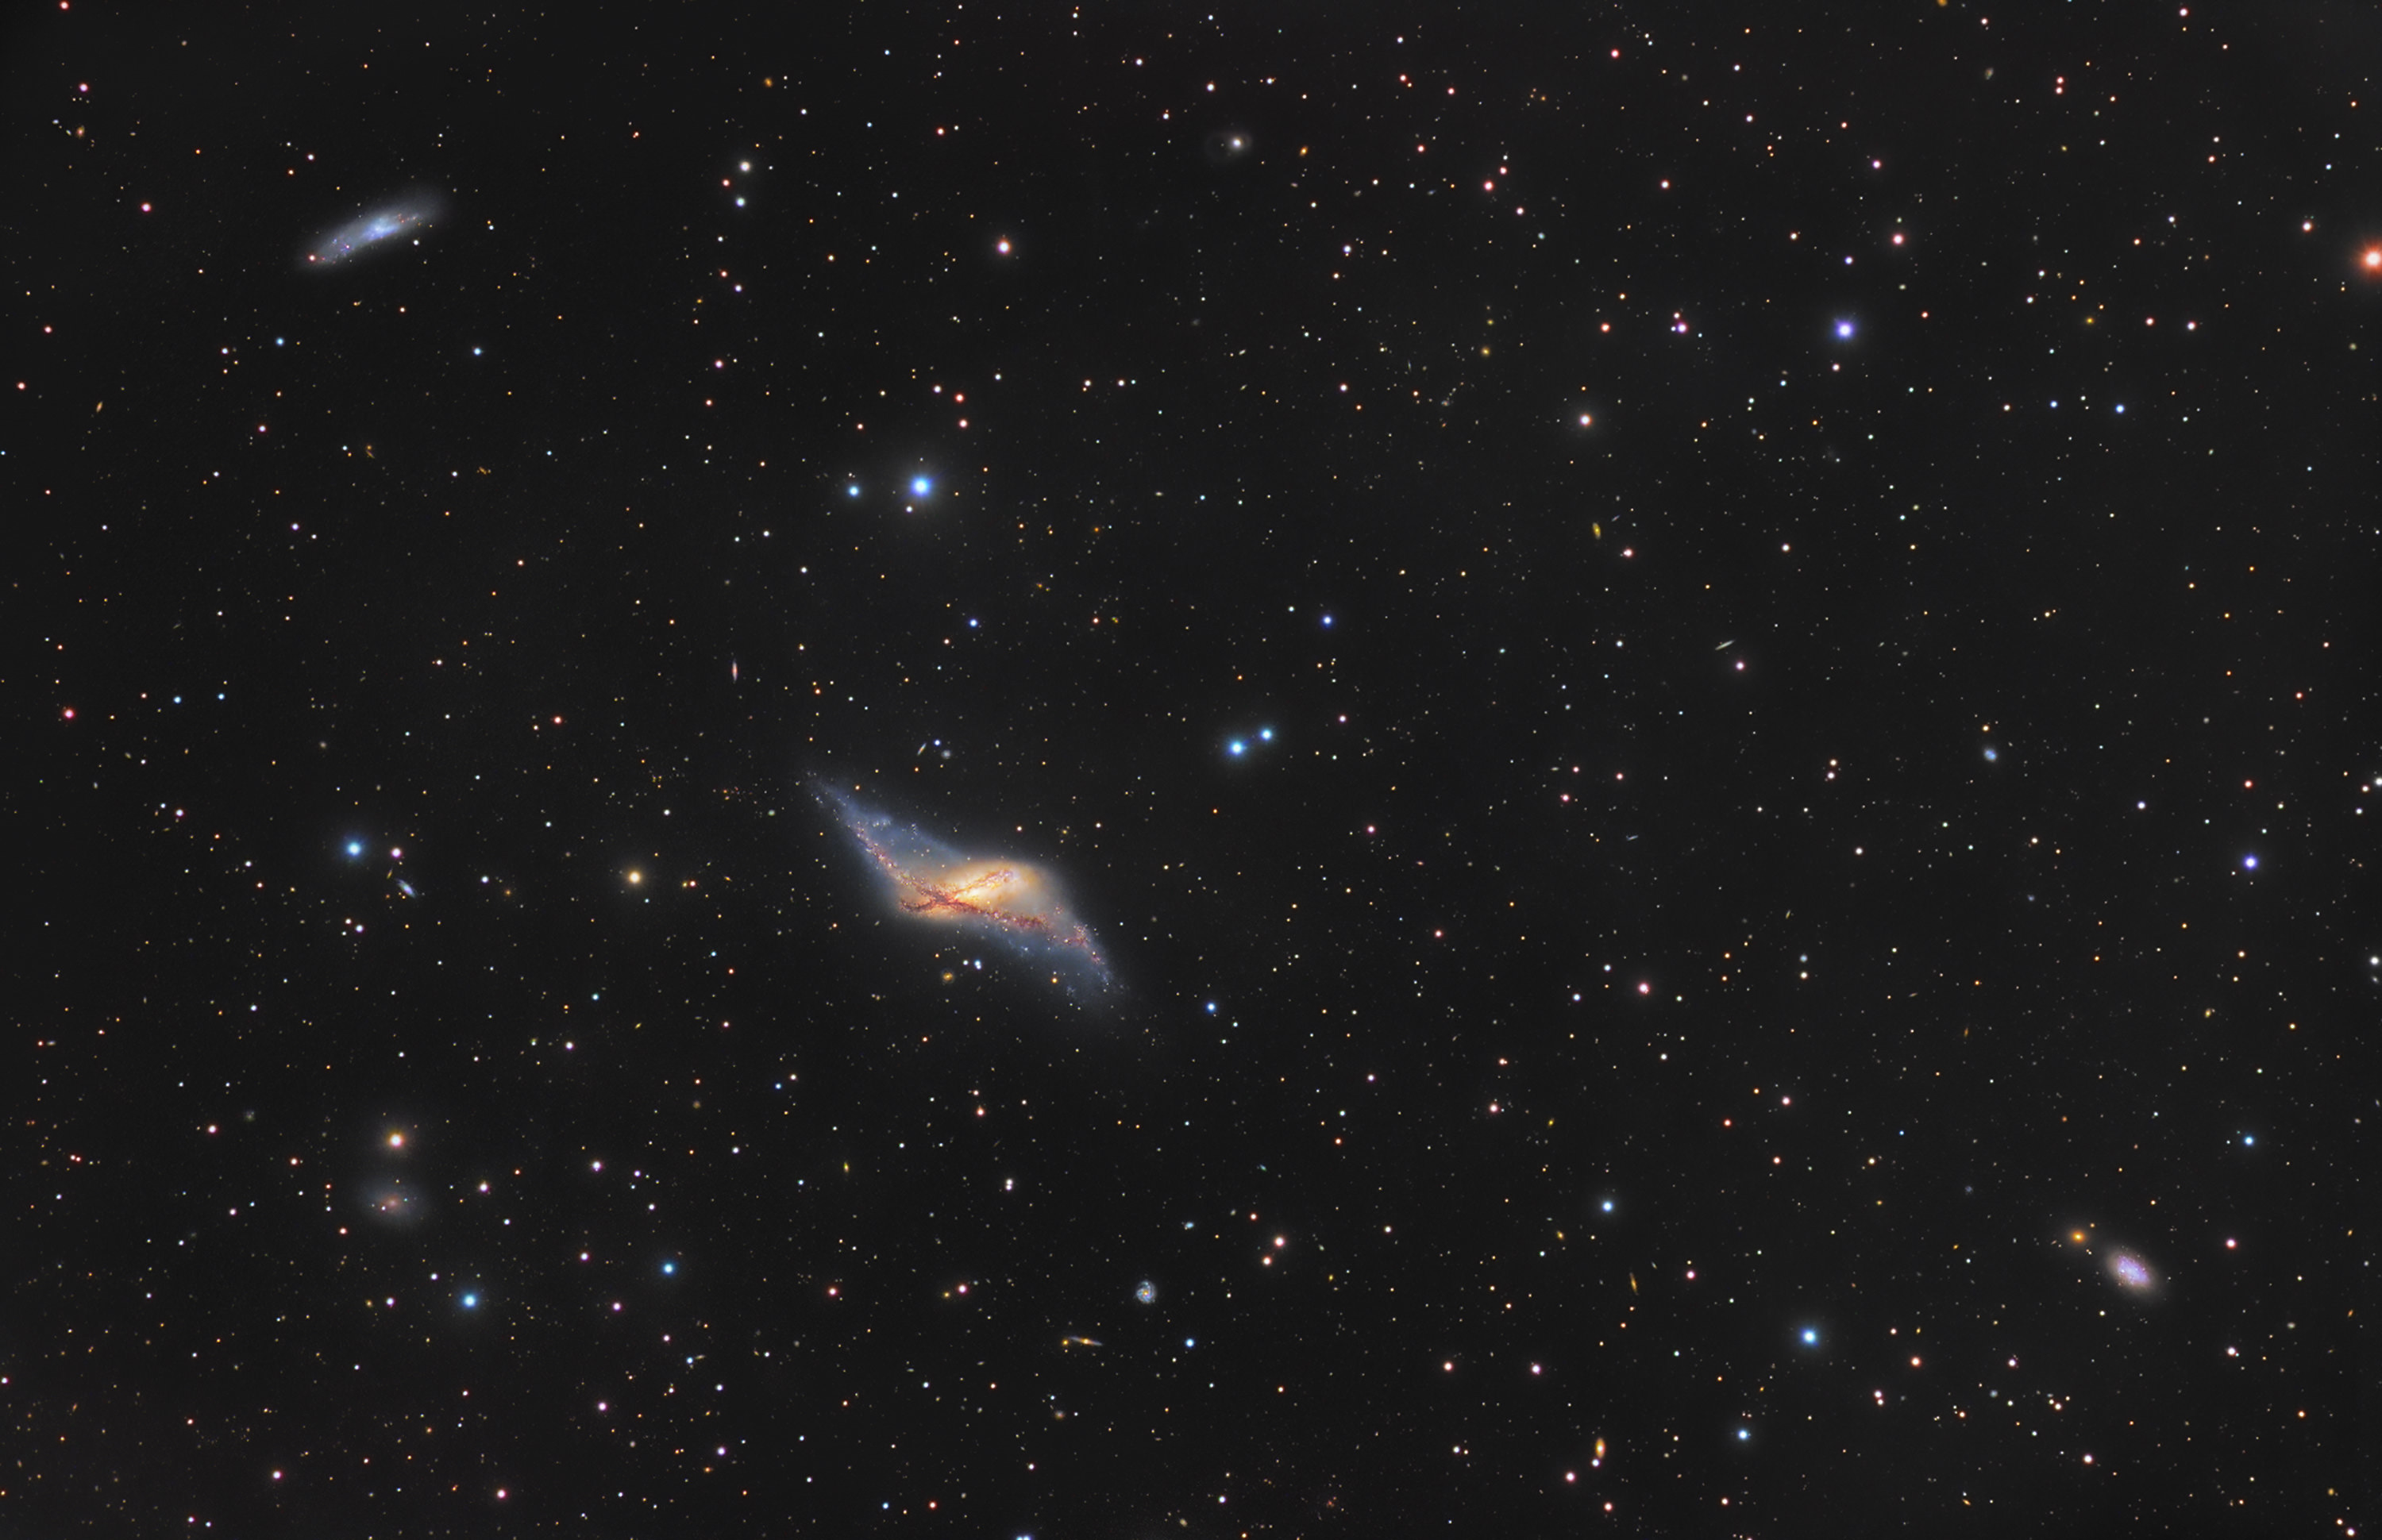
No. This polar ring isn’t a phone call from Santa, but an unusual interacting galaxy designated as NGC 660. Located over 20 million light-years away, this member of the M74 group located in the constellation of Pisces is rare breed – a “polar ring” galaxy – a bizarre configuration of stars, gas, and dust orbiting in ring formations nearly perpendicular to the plane of a flat galactic disk. What caused it? Read on…
Polar ring galaxies are believed to have formed from a spectacular collision of two galaxies who shared a common past. While they may not have merged, the encounter could have left a debris trail which encircles the host galaxy’s disk. “High-resolution interferometric data of the H I and OH absorption in the nuclear region of NGC 660 reveal three distinct absorbing structures. The central disk of the galaxy with a large velocity gradient dominates the absorption signature. The gas in the warped outer disk appears in absorption close to the systemic velocity; the outer rings of the warp located at large radii are moving in front of the nuclear radio source.” says Willema Baan (et al), “Third, an outflowing feature can be seen at the center of the radio source at 100 km/s below the systemic velocity. This mostly molecular feature could be due to a perturbed spiral structure in the inner regions of the disk.”
But, when it comes to NGC 660, the explanation might not quite be as straight forward. Apparently from our line of sight, the area of the ring closest to us doesn’t cross that galactic plane in the middle- but off to one side. This gives us a unique opportunity to study the shape of this galaxy’s hidden dark matter halo by calculating the enigma’s gravitational influence on the rotation of the ring and disk – a mass of starburst activity! Within the ring itself are an estimated 500 clusters where stars are continuously being born with the youngest of the siblings estimated to be about 7 million years old.
“NGC 660 contains concentrated central star formation of power ~ 2 x 10¹⁰~ Lsun. Our 1.3 cm continuum image reveals a bright, compact source of less than 10 pc extent with a rising spectral index. We infer that this is optically thick free-free emission from a super star cluster nebula. The nebula is less than 10 pc in size, comparable in luminosity to the “supernebula” in the dwarf galaxy, NGC 5253.” says J.P. Naiman, “We estimate that there are a few thousand O stars contained in this single young cluster. There are a number of other weaker continuum sources, either slightly smaller or more evolved clusters of similar size within the central 300 parsecs of the galaxy.”
But that’s not all that’s hiding in NGC 660, its unusual profile gives us an opportunity to study what happens to molecular gas densities when galaxies collide, too. It opens the mysterious phenomena of megamasers and kilomasers. “Contrary to conventional wisdom, IR luminosity does not dictate OHM formation; both star formation and OHM activity are consequences of tidal density enhancements accompanying galaxy interactions. The OHM fraction in starbursts is likely due to the fraction of mergers experiencing a temporal
spike in tidally driven density enhancement.” says Jeremy Darling. “OHMs are thus signposts marking the most intense, compact, and unusual modes of star formation in the local universe. Future high-redshift OHM surveys can now be interpreted in a star formation and galaxy evolution context, indicating both the merging rate of galaxies and the burst contribution to star formation.”
But what about things we can’t see? Things far more powerful in the electromagnetic spectrum than those given off by Cassiopeia A… Compact radio sources! “Nuclei of starburst galaxies are often obscured by dust and hence are probed best in non-visual wavelength regimes such as the infrared and radio.” sys A. Wiercigroch (JPL). “A number of the compact sources appear to lie along a ring projected against the more diffuse radio emission in the galaxy’s nuclear region.”
[/caption]
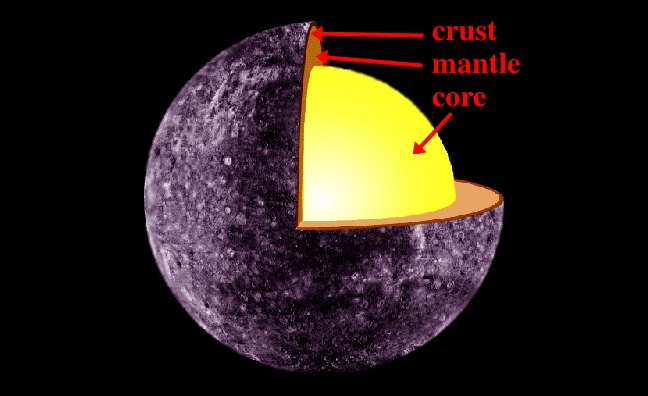
Here’s a Mercury diagram, showing the interior of planet Mercury.
Mercury is the closest planet to the Sun, orbiting at an average distance of 57.9 million km from the Sun. It’s also the second densest planet in the Solar System, with an average distance of 5.427 grams per cubic centimeter. Based on this density, astronomers have some estimates about the interior structure of Mercury.
The center of Mercury is its metal core, similar to the Earth’s core. But in the case of Mercury, the core occupies 42% of the volume of Mercury, while the core of Earth is only 17%. And for some reason, the metal core of Mercury doesn’t create a magnetic field with the same intensity of Earth’s magnetic field. Mercury’s magnetosphere is only 1% as strong as Earth’s field.
Surrounding the core is Mercury’s mantle. This is a 500-700 km thick layer of rock, composed of silicates. And surrounding the mantle is Mercury’s crust. Based on observations made by Mariner 10 and Earth-based telescopes, astronomers think that Mercury’s crust is 100 – 300 kilometers thick. There are many large depressions in Mercury’s crust, and scientists think these formed as Mercury slowly cooled and contracted.
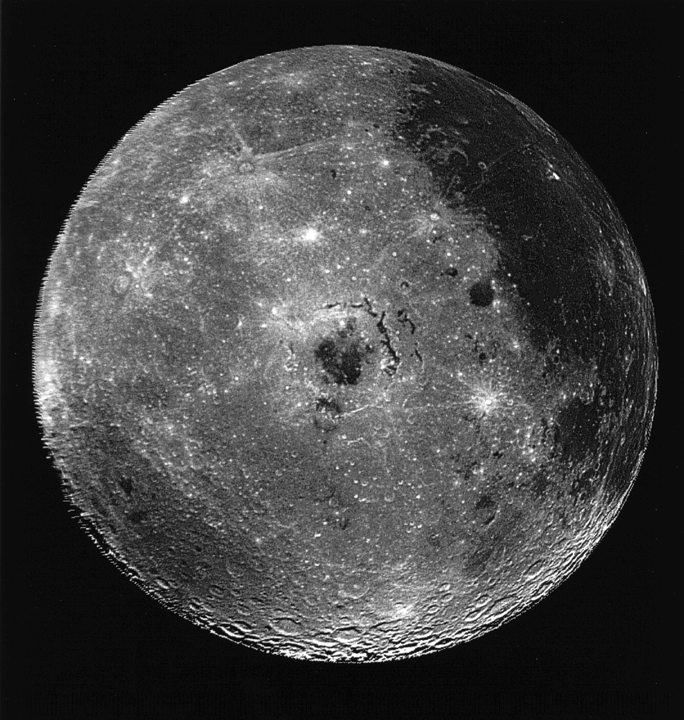
Image of Earth's Moon centered on the Orientale Basin taken by Galileo Spacecraft.
[/caption]
One of the legacies of the Apollo program is the rare lunar samples it returned. These samples (along with meteorites that originated from the moon and even one from Mars) can be radiometrically dated, and together they paint a picture a cataclysmic time in the history of our solar system. Over a period of time some 3.8 to 4.1 billion years ago, the moon underwent a fierce period of impacts that was the origin of most of the craters we see today. Paired with the “Nice model” (named after the French university where it was developed, not because it was pleasant in any way), which describes the migration of planets to their current orbits, it is widely held that the migration of Jupiter or one of the other gas giants migrations during this period, caused a shower of asteroids or comets to rain down upon the inner solar system in a time known as the “Late Heavy Bombardment” (LHB).
A new paper by astronomers from Harvard and the University of British Columbia disagrees with this picture. In 2005, Strom et al. published a paper in Science which analyzed the frequency of craters of various sizes on the lunar highlands, Mars, and Mercury (since these are the only rocky bodies in the inner solar system without sufficient erosion to wash away their cratering history). When comparing relatively young surfaces which had been more recently resurfaced to older ones from the Late Heavy Bombardment area, is that there were two separate, but characteristic curves. The one for the LHB era revealed a crater frequency peaking at craters near 100 km (62 miles) in diameter and dropping off rapidly to lower diameters. Meanwhile, the younger surfaces showed a nearly even amount of craters of all sizes measurable. Additionally, the LHB impacts were an order of magnitude more common than the newer ones.
The Strom et al. took this as evidence that two different populations of impactors were at work. The LHB era, they called Population I. The more recent, they called Population II. What they noticed was the current size distribution of main belt asteroids (MBAs) was “virtually identical to the Population 1 projectile size distribution”. Additionally, since the size distribution of the MBA is the same today, this indicated that the process which sent these bodies our way didn’t discriminate based on size, which would weed out that size and alter the distribution we observed today. This ruled out processes such as the Yarkovsky effect but agreed with the gravitational shove as a large body would move through the region. The inverse of this (that a process was selecting rocks to chuck our way based on size) would be indicative of Strom’s Population II objects.
However, in this paper recently uploaded to arXiv, Cuk et al. argue that the dates of many of the regions investigated by Strom et al. cannot be reliably dated and therefore, cannot be used to investigate the nature of the LHB. They suggest that only the Imbrium and Orientale basins, which have their formation dates precisely known from rocks retrieved by Apollo missions, can be used to accurately describe the cratering history during this period.
With this assumption, Cuk’s group reexamined the frequency of crater sizes for just these basins. When this was plotted for these two groups, they found that the power law they used to fit the data had “an index of -1.9 or -2 rather than -1.2 or -1.3 (like the modern asteroid belt)”. As such, they claim, “theoretical models producing the lunar cataclysm by gravitational ejection of main-belt asteroids are seriously challenged.”
Although they call into question Strom et al.’s model, they cannot propose a new one. They suggest some causes that are unlikely, such as comets (which have too low of impact probabilities). One solution they mention is that the population of the asteroid belt has evolved since the LHB which would account for the differences. Regardless, they conclude that this question is more open ended than previously expected and that more work will need to be done to understand this cataclysm.
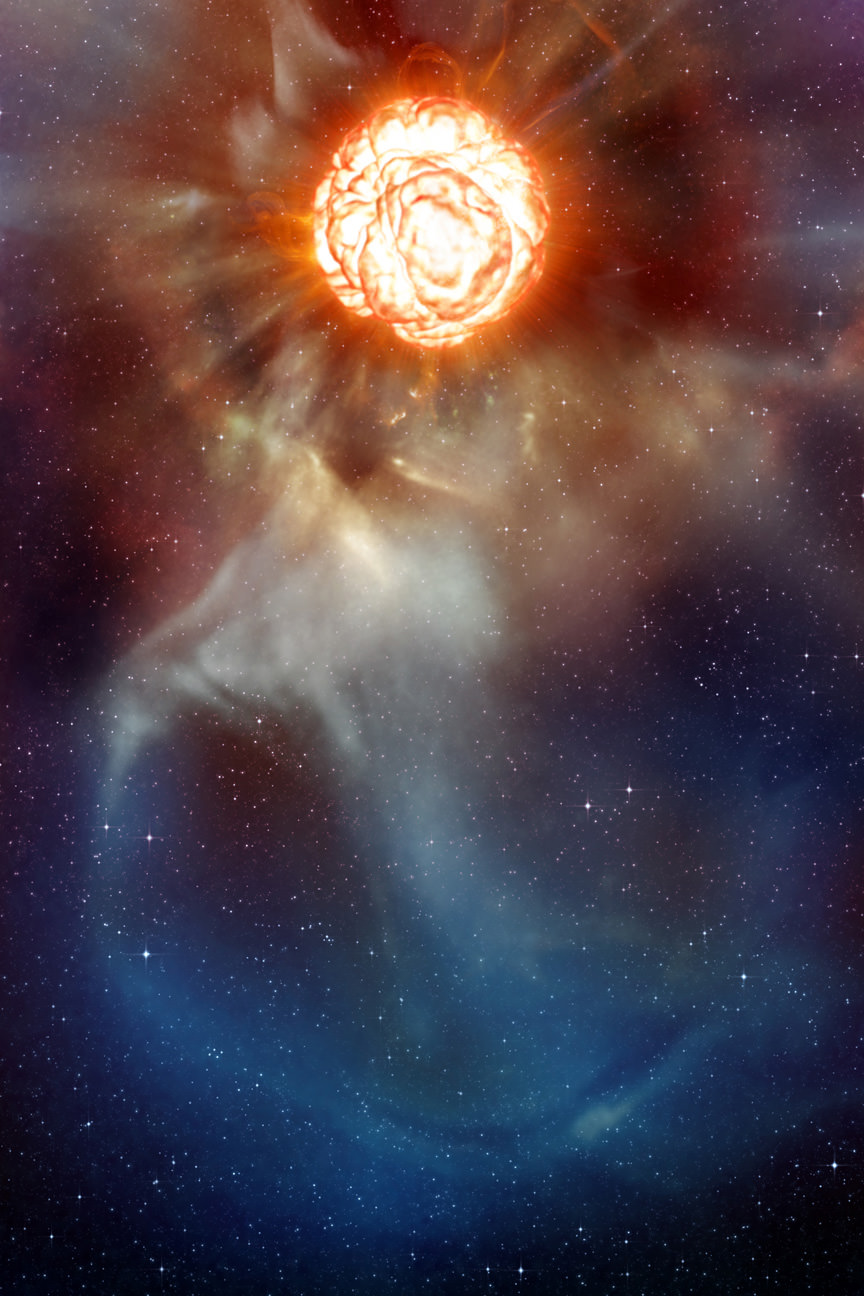
Artists concept of Chi Cygni Credit: ESO/L. Calçada
[/caption]
When our Sun begins to die, it will become a red giant as it runs out of hydrogen fuel at its core. Astronomers have a pretty good idea of what will transpire: the sun will swell to a size so large that it will swallow every planet out to Mars in our solar system. Don’t worry, though, this won’t happen for another 5 billion years. But now, astronomers have been able to watch in detail the death of a sun-like star about 550 light-years from Earth to get a better grasp on what the end might be for our Sun. The star, Chi Cygni, has swollen in size, and is now writhing in its death throes. The star has begun to pulse dramatically in and out, beating like a giant heart. New close-up photos of the surface of this distant star show its throbbing motions in unprecedented detail.
Using interferometry to image the star's surface at four separate times, astronomers found that the star grows to a diameter of 480 million miles - large enough to engulf the asteroid belt - before shrinking to a minimum diameter of 300 million miles. Chi Cygni also shows significant hotspots near minimum radius. Credit: Sylvestre Lacour, Observatoire de Paris
“This work opens a window onto the fate of our Sun five billion years from now, when it will near the end of its life,” said Sylvestre Lacour of the Observatoire de Paris, who led a team of astronomers studying Chi Cygni.
The scientists compared the star to a car running out of gas. The “engine” begins to sputter and pulse. On Chi Cygni, the sputterings show up as a brightening and dimming, caused by the star’s contraction and expansion.
For the first time, astronomers have photographed these dramatic changes in detail.
“We have essentially created an animation of a pulsating star using real images,” stated Lacour. “Our observations show that the pulsation is not only radial, but comes with inhomogeneities, like the giant hotspot that appeared at minimum radius.”
Stars at this life stage are known as Mira variables. As it pulses, the star is puffing off its outer layers, which in a few hundred thousand years will create a beautifully gleaming planetary nebula.
Chi Cygni pulses once every 408 days. At its smallest diameter of 300 million miles, it becomes mottled with brilliant spots as massive plumes of hot plasma roil its surface, like the granules seen on our Sun’s surface, but much larger. As it expands, Chi Cygni cools and dims, growing to a diameter of 480 million miles – large enough to engulf and cook our solar system’s asteroid belt.
Imaging variable stars is an extremely difficult task. First, Mira variables hide within a compact and dense shell of dust and molecules. To study the stellar surface within the shell, astronomers need to observe the stars in infrared light, which allows them to see through the shell of molecules and dust, like X-rays enable physicians to see bones within the human body.
Secondly, these stars are very far away, and thus appear very small. Even though they are huge compared to the Sun, the distance makes them appear no larger than a small house on the moon as seen from Earth. Traditional telescopes lack the proper resolution. Consequently, the team turned to a technique called interferometry, which involves combining the light coming from several telescopes to yield resolution equivalent to a telescope as large as the distance between them.
They used the Smithsonian Astrophysical Observatory’s Infrared Optical Telescope Array, or IOTA, which was located at Whipple Observatory on Mount Hopkins, Arizona.
“IOTA offered unique capabilities,” said co-author Marc Lacasse of the Harvard-Smithsonian Center for Astrophysics (CfA). “It allowed us to see details in the images which are about 15 times smaller than can be resolved in images from the Hubble Space Telescope.”
The team also acknowledged the usefulness of the many observations contributed annually by amateur astronomers worldwide, which were provided by the American Association of Variable Star Observers (AAVSO).
In the forthcoming decade, the prospect of ultra-sharp imaging enabled by interferometry excites astronomers. Objects that, until now, appeared point-like are progressively revealing their true nature. Stellar surfaces, black hole accretion disks, and planet forming regions surrounding newborn stars all used to be understood primarily through models. Interferometry promises to reveal their true identities and, with them, some surprises.
The new observations of Chi Cygni are reported in the December 10 issue of The Astrophysical Journal.
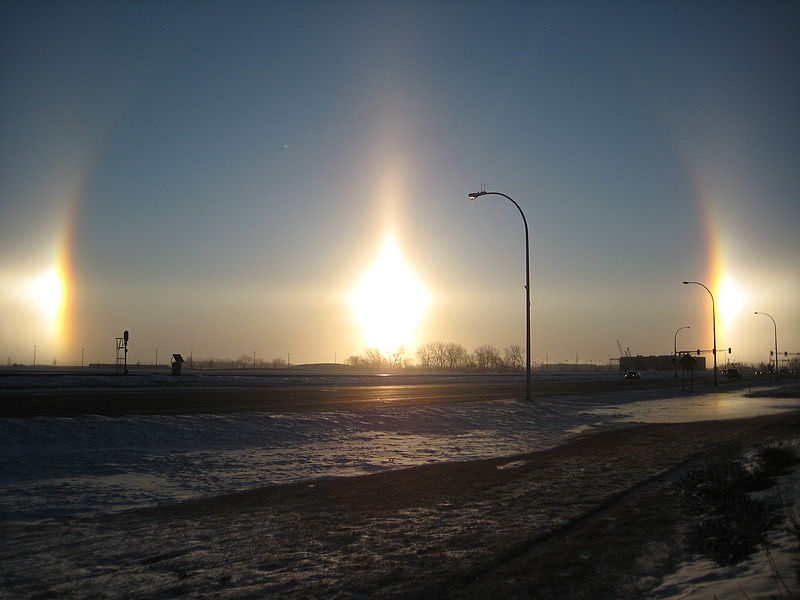
A sun dog is an atmospheric phenomenon where you can see additional bright patches in the sky on either side of the Sun. Sometimes you just see bright spots, and sometimes you can actually see an arc or even a halo around the Sun. These are all related to sun dogs, and have to do with very specific atmospheric conditions. If you’ve ever seen a sun dog, you were very lucky, and they only occur rarely.
Sun dogs occur because of sunlight refracting through ice crystals in the atmosphere. The crystals cause the sunlight to bend at a minimum angle of 22°. All of the crystals are refracting the Sun’s rays, but we only see the ones which are bent towards our eyes. Because this is the minimum, the light looks more concentrated starting at 22° away from the Sun; about 40 times the size of the Sun in the sky. At this 22° point you can get arcs, a halo, or just bright spots in the sky.
They can occur at any time of the year and from any place on Earth; although, they’re easiest to see when the Sun is lower on the horizon. As the Sun rises, the sun dog can actually drift away from the 22° point. Eventually the Sun gets so high that the sun dog disappears entirely.
There are no set colors with sun dogs. The light from the Sun is being refracted equally by the ice crystals and so we don’t see the colors broken up as we do with a rainbow.
We’ve written several articles about the Sun for Universe Today. Here’s an article about a ring around the Sun, and here’s an article about rings around the Moon.
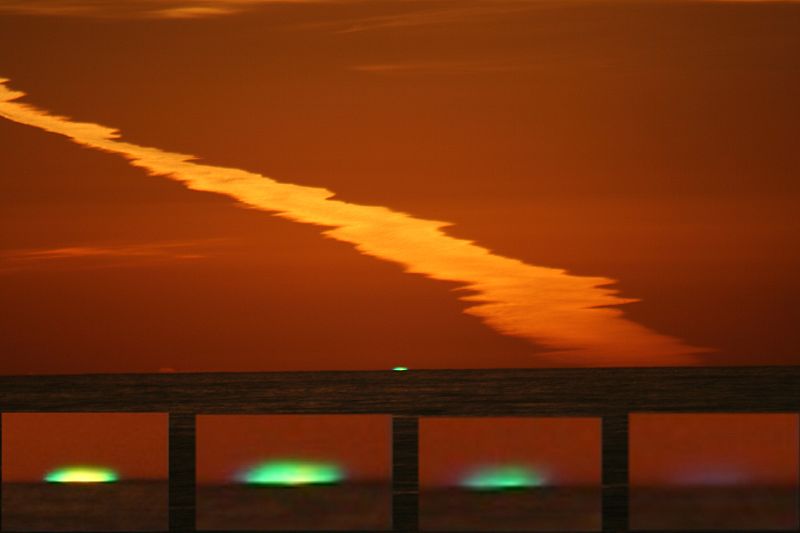
Green Flash in Santa Cruz, California. Image credit: Mila Zinkova
[/caption]
Have you ever heard of a green flash sunset? You might think it’s a myth, but this is a real phenomenon that you can see if the conditions are just right. If you’re watching the Sun dip down on the horizon you might see a green dot appear just above the Sun for just a second. That’s a green flash sunset, and if you saw one, you’re a very lucky person.
Green flashes can occur at sunrise or sunset, and to see one, you need to have an unobstructed view to the horizon. They occur because the light from the Sun is refracted – or bent – as it passes through the Earth’s atmosphere, following the curvature of the Earth. Higher frequency light (bluer light) is bent more than lower frequency light. This is happening all the time, but we’re seeing all the colors of the light spectrum at the same time. But when the Sun is right at the horizon, the redder hues of the color spectrum are blocked by the horizon of the Earth, while the higher frequency wavelengths are still following the curve of the Earth. While the redder light is blocked, the green and blue light is still visible, so we see the green flash.
There are actually a few different kinds of green flashes that can occur. The most common example is an inferior-mirage flash, where a dot of green light appears on top of the Sun just as it’s gone below the horizon. But you can also get a situation where a portion of the Sun’s upper edge turns slightly green, or even a green beam of light appears above the Sun.
We’ve written a few articles about sunsets for Universe Today. Here’s an article about green flashes, and here are some cool pictures of sunsets seen from other worlds.
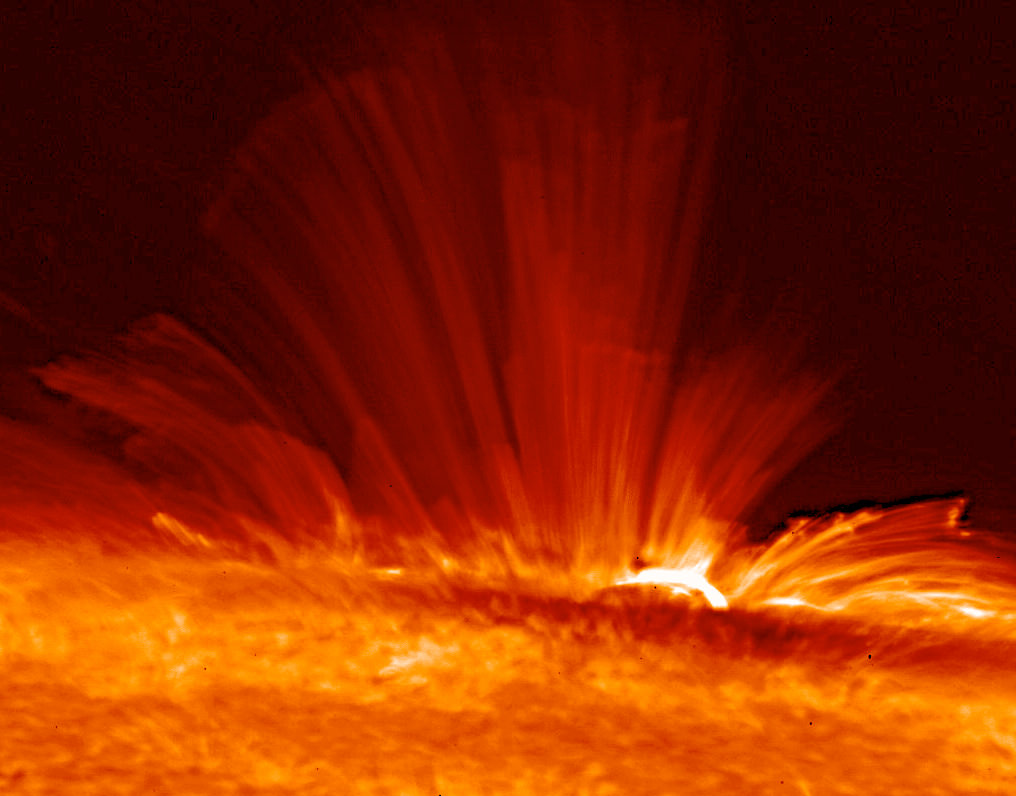
Plasma on the surface of the Sun. Image credit: Hinode
[/caption]
The Sun may look like just a mass of incandescent gas (plasma, really), but it’s actually broken up into layers. The chromosphere is relatively thin region of the Sun that’s just above the photosphere.
The photosphere is the region of the Sun that we see. It measures an average temperature of almost 5,800 kelvin and produces the visible radiation. This is the point where photons generated inside the Sun can finally leap out into space. The chromosphere measures just 2,000 km, and it’s just outside the photosphere.
Even though it’s very thin, the chromosphere changes dramatically in density, from the top down to the photosphere, the density of the chromosphere increases by a factor of 5 million. The upper boundary of the chromosphere is the called the solar transition region, above which is known as the corona.
One surprising mystery is that the chromosphere is actually hotter than the photosphere. While the photosphere hovers around 5,800 kelvin, the temperature of the chromosphere varies between 4,500 K and 20,000 K. Even though it’s more distant from the center of the Sun, the chromosphere is hotter than the photosphere. Astronomers think turbulence in the Sun’s atmosphere might somehow cause this extra heating.
The chromosphere is difficult to see without special equipment because the light from the much brighter photosphere washes it out. It has a reddish color, but you can only really see it during a total solar eclipse.
One of the recognizable features of the chromosphere are spicules. These are fingers of gas that kind of look like grass growing on the surface of the Sun. These can rise up in the chromosphere and then disappear again within 10 minutes.