How Can You see the Northern Lights?

Aurora borealis in Fairbanks, AK. on Monday night March 16. Credit: John Chumack

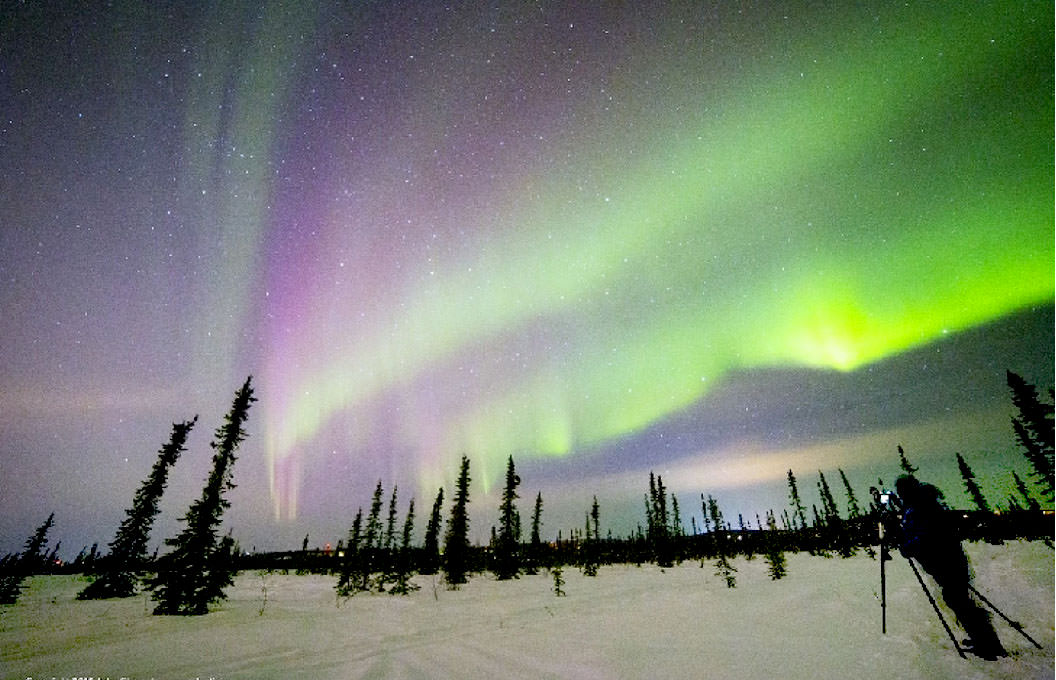
The Northern Lights have fascinated human beings for millennia. In fact, their existence has informed the mythology of many cultures, including the Inuit, Northern Cree, and ancient Norse. They were also a source of intense fascination for the ancient Greeks and Romans, and were seen as a sign from God by medieval Europeans.

Thanks to the birth of modern astronomy, we now know what causes both the Aurora Borealis and its southern sibling – Aurora Australis. Nevertheless, they remain the subject of intense fascination, scientific research, and are a major tourist draw. For those who live north of 60° latitude, this fantastic light show is also a regular occurrence.

Causes:

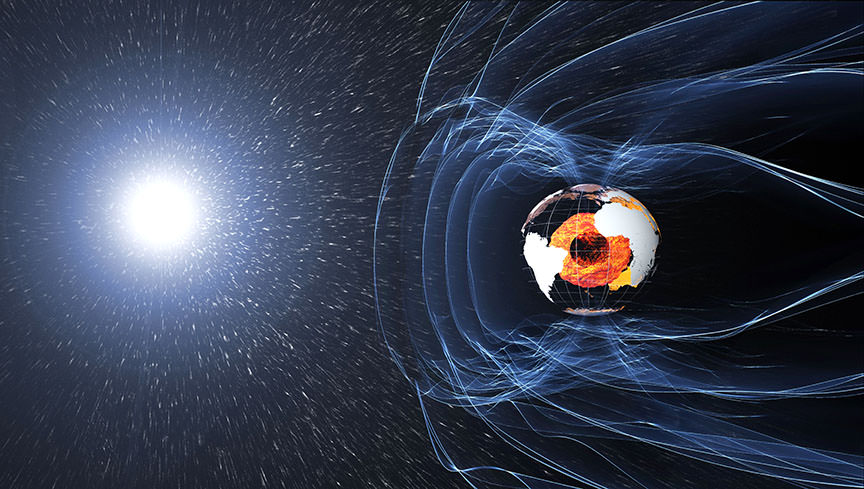
Aurora Borealis (and Australis) is caused by interactions between energetic particles from the Sun and the Earth’s magnetic field. The invisible field lines of Earth’s magnetoshere travel from the Earth’s northern magnetic pole to its southern magnetic pole. When charged particles reach the magnetic field, they are deflected, creating a “bow shock” (so-named because of its apparent shape) around Earth.

However, Earth’s magnetic field is weaker at the poles, and some particles are therefore able to enter the Earth’s atmosphere and collide with gas particles in these regions. These collisions emit light that we perceive as wavy and dancing, and are generally a pale, yellowish-green in color.

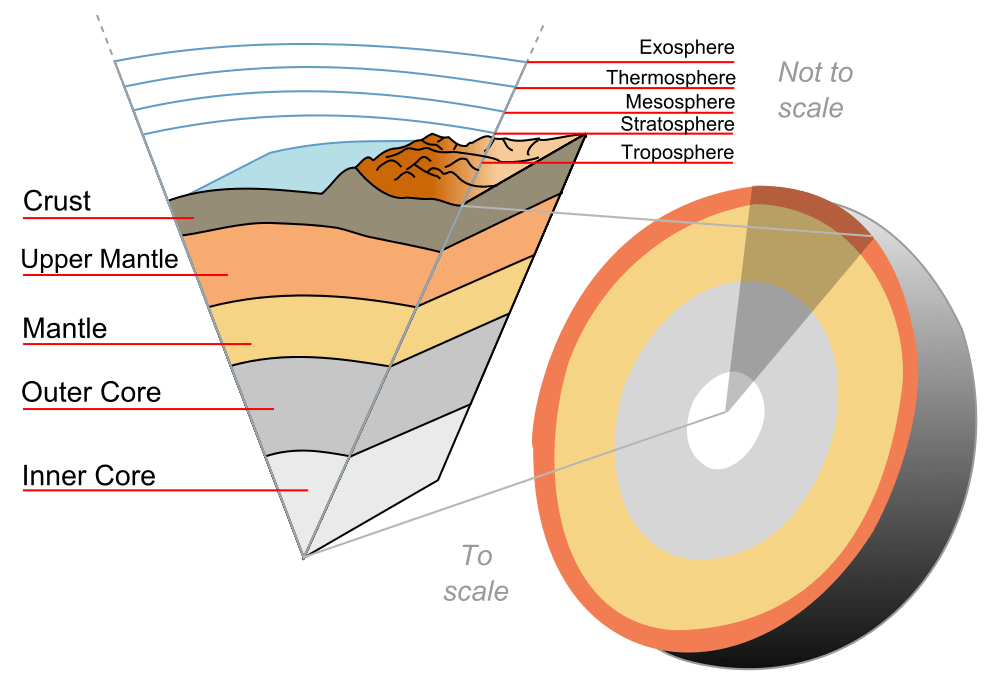
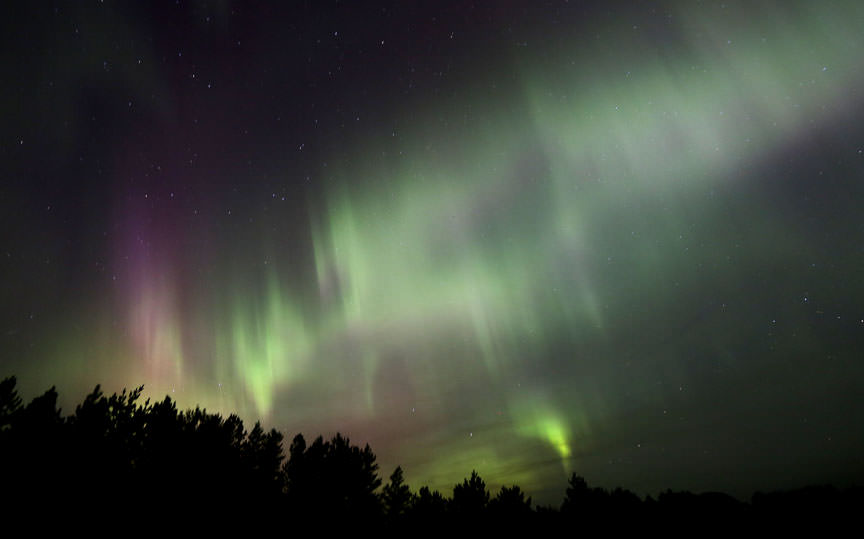
The variations in color are due to the type of gas particles that are colliding. The common yellowish-green is produced by oxygen molecules located about 100 km (60 miles) above the Earth, whereas high-altitude oxygen – at heights of up to 320 km (200 miles) – produce all-red auroras. Meanwhile, interactions between charged particles and nitrogen will produces blue or purplish-red auroras.

Variability:

The visibility of the northern (and southern) lights depends on a lot of factors, much like any other type of meteorological activity. Though they are generally visible in the far northern and southern regions of the globe, there have been instances in the past where the lights were visible as close to the equator as Mexico.

In places like Alaska, Norther Canada, Norway and Siberia, the northern lights are often seen every night of the week in the winter. Though they occur year-round, they are only visible when it is rather dark out. Hence why they are more discernible during the months where the nights are longer.

The magnetic field and electric currents in and around Earth generate complex forces that have immeasurable impact on every day life. The field can be thought of as a huge bubble, protecting us from cosmic radiation and charged particles that bombard Earth in solar winds. It’s shaped by winds of particles blowing from the sun called the solar wind, the reason it’s flattened on the “sun-side” and swept out into a long tail on the opposite side of the Earth. Credit: ESA/ATG medialab
The magnetic field and electric currents in and around Earth generate complex forces, and also lead to the phenomena known as aurorae. Credit: ESA/ATG medialab

Because they depend on the solar wind, auroras are more plentiful during peak periods of activity in the Solar Cycle. This cycle takes places every 11 years, and is marked by the increase and decrease of sunspots on the sun’s surface. The greatest number of sunspots in any given solar cycle is designated as a “Solar Maximum“, whereas the lowest number is a “Solar Minimum.”

A Solar Maximum also accords with bright regions appearing in the Sun’s corona, which are rooted in the lower sunspots. Scientists track these active regions since they are often the origin of eruptions on the Sun, such as solar flares or coronal mass ejections.

The most recent solar minimum occurred in 2008. As of January 2010, the Sun’s surface began to increase in activity, which began with the release of a lower-intensity M-class flare. The Sun continued to get more active, culminating in a Solar Maximum by the summer of 2013.

Locations for Viewing:

The ideal places to view the Northern Lights are naturally located in geographical regions north of 60° latitude.  These include northern Canada, Greenland, Iceland, Scandinavia, Alaska, and Northern Russia. Many organizations maintain websites dedicated to tracking optimal viewing conditions.

The camera recorded pale purple and red but the primary color visible to the eye was green. Credit: Bob Kin
An image captured of the northern lights, which appear pale purple and red, though the primary color visible to the eye was green. Credit: Bob Kin

For instance, the Geophysical Institute of the University of Alaska Fairbanks maintains the Aurora Forecast. This site is regularly updated to let residents know when auroral activity is high, and how far south it will extend. Typically, residents who live in central or northern Alaska (from Fairbanks to Barrow) have a better chance than those living in the south (Anchorage to Juneau).

In Northern Canada, auroras are often spotted from the Yukon, the Northwest Territories, Nunavut, and Northern Quebec. However, they are sometimes seen from locations like Dawson Creek, BC; Fort McMurry, Alberta; northern Saskatchewan and the town of Moose Factory by James Bay, Ontario. For information, check out Canadian Geographic Magazine’s “Northern Lights Across Canada“.

The National Oceanic and Atmospheric Agency also provides 30 minute forecasts on auroras through their Space Weather Prediction Center. And then there’s Aurora Alert, an Android App that allows you to get regular updates on when and where an aurora will be visible in your region.

Understanding the scientific cause of auroras has not made them any less awe-inspiring or wondrous. Every year, countless people venture to locations where they can be seen. And for those serving aboard the ISS, they got the best seat in the house!

Speaking of which, be sure to check out this stunning NASA video which shows the Northern Lights being viewed from the ISS:

We have written many interesting articles about Auroras here at Universe Today. Here’s The Northern and Southern Lights – What is an Aurora?, What is the Aurora Borealis?, What is the Aurora Australis?, What Causes the Northern Lights?, How Does the Aurora Borealis Form?, and Watch Fast and Furious All-sky Aurora Filmed in Real Time.

For more information, visit the THEMIS website – a NASA mission that is currently studying space weather in great detail. The Space Weather Center has information on the solar wind and how it causes aurorae.

Astronomy Cast also has episodes on the subject, like Episode 42: Magnetism Everywhere.

Sources:

Why Are Stars Different Colors?

Artist's impression of a white dwarf star in orbit around Sirius (a white supergiant). Credit: NASA, ESA and G. Bacon (STScI)

Stars are beautiful, wondrous things. Much like planets, planetoids and other stellar bodies, they come in many sizes, shapes, and even colors. And over the course of many centuries, astronomers have come to discern several different types of stars based on these fundamental characteristics.

For instance, the color of a star – which varies from bluish-white and yellow to orange and red – is primarily due to its composition and effective temperature. And at all times, stars emit light which is a combination of several different wavelengths. On top of that, the color of a star can change over time.

Composition:

Different elements emit different wavelengths of electromagnetic radiation when heated. In the case of stars, his includes its main constituents (hydrogen and helium), but also the various trace elements that make it up. The color that we see is the combination of these different electromagnetic wavelengths, which are referred to as as a Planck’s curve.

Diagram illustrating Wein's Law (colored curves), which describes the emission of radiation from a black body. Credit: Wikipedia Commons/Darth Kule
Diagram illustrating Wein’s Law, which describes the emission of radiation from a black body based on its peak wavelength. Credit: Wikipedia Commons/Darth

The wavelength at which a star emits the most light is called the star’s “peak wavelength” (which known as Wien’s Law), which is the peak of its Planck curve. However, how that light appears to the human eye is also mitigated by the contributions of the other parts of its Planck curve.

In short, when the various colors of the spectrum are combined, they appear white to the naked eye. This will make the apparent color of the star appear lighter than where star’s peak wavelength falls on the color spectrum. Consider our Sun. Despite the fact that its peak emission wavelength corresponds to the green part of the spectrum, its color appears pale yellow.

A star’s composition is the result of its formation history. Ever star is born of a nebula made up of gas and dust, and each one is different. While nebulas in the interstellar medium are largely composed of hydrogen, which is the main fuel for star creation, they also carry other elements. The overall mass of the nebula, as well as the various elements that make it up, determine what kind of star will result.

The change in color these elements add to stars is not very obvious, but can be studied thanks to the method known as spectroanalysis. By examining the various wavelengths a star produces using a spectrometer, scientists are able to determine what elements are being burned inside.

Temperature and Distance:

The other major factor effecting a star’s color is its temperature. As stars increase in heat, the overall radiated energy increases, and the peak of the curve moves to shorter wavelengths. In other words, as a star becomes hotter, the light it emits is pushed further and further towards the blue end of the spectrum. As stars grow colder, the situation is reversed (see below).

A third and final factor that will effect what light a star appears to be emitting is known as the Doppler Effect. When it comes to sound, light, and other waves, the frequency can increase or decrease based on the distance between the source and the observer.

When it comes to astronomy, this effect causes the what is known as “redshift” and “blueshift” – where the visible light coming from a distant star is shifted towards the red end of the spectrum if it is moving away, and the blue end if it is moving closer.

Modern Classification:

Modern astronomy classifies stars based on their essential characteristics, which includes their spectral class (i.e. color), temperature, size, and brightness. Most stars are currently classified under the Morgan–Keenan (MK) system, which classifies stars based on temperature using the letters O, B, A, F, G, K, and M, – O being the hottest and M the coolest.

Each letter class is then subdivided using a numeric digit with 0 being hottest and 9 being coolest (e.g. O1 to M9 are the hottest to coldest stars). In the MK system, a luminosity class is added using Roman numerals. These are based on the width of certain absorption lines in the star’s spectrum (which vary with the density of the atmosphere), thus distinguishing giant stars from dwarfs.

Luminosity classes 0 and I apply to hyper- or supergiants; classes II, III and IV apply to bright, regular giants, and subgiants, respectively; class V is for main-sequence stars; and class VI and VII apply to subdwarfs and dwarf stars. There is also the Hertzsprung-Russell diagram, which relates stellar classification to absolute magnitude (i.e. intrinsic brightness), luminosity, and surface temperature.

The same classification for spectral types are used, ranging from blue and white at one end to red at the other, which is then combined with the stars Absolute Visual Magnitude (expressed as Mv) to place them on a 2-dimensional chart (see below).

The Hertzspirg-Russel diagram, showing the relation between star's color, AM. luminosity, and temperature. Credit: astronomy.starrynight.com
The Hertzspirg-Russel diagram, showing the relation between star’s color, AM. luminosity, and temperature. Credit: astronomy.starrynight.com

On average, stars in the O-range are hotter than other classes, reaching effective temperatures of up to 30,000 K. At the same time, they are also larger and more massive, reaching sizes of over 6 and a half solar radii and up to 16 solar masses. At the lower end, K and M type stars (orange and red dwarfs) tend to be cooler (ranging from 2400 to 5700 K), measuring 0.7 to 0.96 times that of our Sun, and being anywhere from 0.08 to 0.8 as massive.

Stellar Evolution:

Stars also go through an evolutionary life cycle, during which time their sizes, temperatures and colors change. For example, when our Sun exhausts all the hydrogen in its the core, it will become unstable and collapse under its own weight. This will cause the core to heat up and get denser, causing the Sun to grow in size.

At this point, it will have left its Main Sequence phase and entered into the Red Giant Phase of its life, which (as the name would suggest) will be characterized by expansion and it becoming a deep red. When this happens, it is theorized that our Sun will expand to encompass the orbits of Mercury and even Venus.

Earth, if it survives this expansion, will be so close that it will be rendered uninhabitable. When our Sun then reaches its post-Red Giant Phase, the Sun will begin to eject mass, leaving an exposed core known as a white dwarf. This remnant will survive for trillions of years before fading to black.

This is believed to be the case with all stars that have between 0.5 to 1 Solar Mass (half, or as much mass of our Sun). The situation is slightly different when it comes to low mass stars (i.e. red dwarfs), which typically have around 0.1 Solar Masses.

It is believed that these stars can remain in their Main Sequence for some six to twelve trillion years and will not experience a Red Giant Phase. However, they will gradually increase in both temperature and luminosity, and will exist for several hundred billion more years before they eventually collapse into a white dwarf.

On the other hand, supergiant stars (up to 100 Solar Masses or more) have so much mass in their cores that they will likely experience helium ignition as soon as they exhaust their supplies of hydrogen. As such, they will likely not survive to become Red Supergiants, and will instead end their lives in a massive supernova.

To break it all down, stars vary in color depending on their chemical compositions, their respective sizes and their temperatures. Over time, as these characteristics change (as a result of them spending their fuel) many will darken and become redder, while others will explode magnificently. The more stars observe, the more we come to know about our Universe and its long, long history!

We have written many articles about stars on Universe Today. Here’s What is the Biggest Star in the Universe?, What is a Binary Star?, Do Stars Move?, What are the Most Famous Stars?, What is the Brightest Star in the Sky, Past and Future?

Want more information on stars? Here’s Hubblesite’s News Releases about Stars, and more information from NASA’s imagine the Universe.

We have recorded several episodes of Astronomy Cast about stars. Here are two that you might find helpful: Episode 12: Where Do Baby Stars Come From, and Episode 13: Where Do Stars Go When they Die?

Sources:

What is a Debris Flow?

Landslide in Guatemala

Landslides constitute one of the most destructive geological hazards in the world today. One of the main reasons for this is because of the high speeds that slides can reach, up to 160 km/hour (100 mph). Another is the fact that these slides can carry quite a bit of debris with them that serve to amplify their destructive force.

Taken together, this is what is known as a Debris Flow, a natural hazard that can take place in many parts of the world. A single flow is capable of burying entire towns and communities, covering roads, causing death and injury, destroying property and bringing all transportation to a halt. So how do we deal with them?

Definition:

A Debris Flow is basically a fast-moving landslide made up of liquefied, unconsolidated, and saturated mass that resembles flowing concrete. In this respect, they are not dissimilar from avalanches, where unconsolidated ice and snow cascades down the surface of a mountain, carrying trees and rocks with it.

Images of a Debris Flow Chute and Deposit, taken by the Arizona Geological Survey (AZGS). Credit: azgs.com
Images of a Debris Flow Chute
and Deposit, taken by the Arizona Geological Survey (AZGS). Credit: azgs.com

A common misconception is to confuse debris flows with landslides or mudflows. In truth, they differ in that landslides are made up of a coherent block of material that slides over surfaces. Debris flows, by contrast, are made up of “loose” particles that move independently within the flow.

Similarly, mud flows are composed of mud and water, whereas debris flows are made up larger particles. All told, it has been estimated that at least 50% of the particles contained within a debris flow are made-up of sand-sized or larger particles (i.e. rocks, trees, etc).

Types of Flows:

There are two types of debris flows, known as Lahar and Jökulhlaup. The word Lahar is Indonesian in origin and has to do with flows that are related to volcanic activity. A variety of factors may trigger a lahar, including melting of glacial ice due to volcanic activity, intense rainfall on loose pyroclastic material, or the outbursting of a lake that was previously dammed by pyroclastic or glacial material.

Jökulhlaup is an Icelandic word which describes flows that originated from a glacial outburst flood. In Iceland, many such floods are triggered by sub-glacial volcanic eruptions, since Iceland sits atop the Mid-Atlantic Ridge. Elsewhere, a more common cause of jökulhlaups is the breaching of ice-dammed or moraine-dammed lakes.

Debris flow channel in Ladakh, NW Indian Himalaya, produced in the storms of August 2010. Credit: Wikipedia Commons/DanHobley
Debris flow channel in Ladakh, near the northwestern Indian Himalaya, produced in the storms of August 2010. Credit: Wikipedia Commons/DanHobley

Such breaching events are often caused by the sudden calving of glacier ice into a lake, which then causes a displacement wave to breach a moraine or ice dam. Downvalley of the breach point, a jökulhlaup may increase greatly in size by picking up sediment and water from the valley through which it travels.

Causes of Flows:

Debris flows can be triggered in a number of ways. Typically, they result from sudden rainfall, where water begins to wash material from a slope, or when water removed material from a freshly burned stretch of land. A rapid snowmelt can also be a cause, where newly-melted snow water is channeled over a steep valley filled with debris that is loose enough to be mobilized.

In either case, the rapidly moving water cascades down the slopes and into the canyons and valleys below, picking up speed and debris as it descends the valley walls. In the valley itself, months’ worth of built-up soil and rocks can be picked up and then begin to move with the water.

As the system gradually picks up speed, a feedback loop ensues, where the faster the water flows, the more it can pick up. In time, this wall begins to resemble concrete in appearance but can move so rapidly that it can pluck boulders from the floors of the canyons and hurl them along the path of the flow. It’s the speed and enormity of these carried particulates that makes a debris flow so dangerous.

Deforestation (like this clearcut in Sumatra, Indonesia) can result in debris flows. Credit: worldwildlife.org

Another major cause of debris flows is the erosion of steams and riverbanks. As flowing water gradually causes the banks to collapse, the erosion can cut into thick deposits of saturated materials stacked up against the valley walls. This erosion removes support from the base of the slope and can trigger a sudden flow of debris.

In some cases, debris flows originate from older landslides. These can take the form of unstable masses perched atop a steep slope. After being lubricated by a flow of water over the top of the old landslide, the slide material or erosion at the base can remove support and trigger a flow.

Some debris flows occur as a result of wildfires or deforestation, where vegetation is burned or stripped from a steep slope. Prior to this, the vegetation’s roots anchored the soil and removed absorbed water. The loss of this support leads to the accumulation of moisture which can result in structural failure, followed by a flow.

Sarychev volcano, (located in Russia's Kuril Islands, northeast of Japan) in an early stage of eruption on June 12, 2009. Credit: NASA
Sarychev volcano, (located in Russia’s Kuril Islands, northeast of Japan) in an early stage of eruption on June 12, 2009. Credit: NASA

A volcanic eruption can flash melt large amounts of snow and ice on the flanks of a volcano. This sudden rush of water can pick up ash and pyroclastic debris as it flows down the steep volcano and carry them rapidly downstream for great distances.

In the 1877 eruption of Cotopaxi Volcano in Ecuador, debris flows traveled over 300 kilometers down a valley at an average speed of about 27 kilometers per hour. Debris flows are one of the deadly “surprise attacks” of volcanoes.

Prevention Methods:

Many methods have been employed for stopping or diverting debris flows in the past. A popular method is to construct debris basins, which are designed to “catch” a flow in a depressed and walled area. These are specifically intended to protect soil and water sources from contamination and prevent downstream damage.

Some basins are constructed with special overflow ducts and screens, which allow the water to trickle out from the flow while keeping the debris in place, while also allowing for more room for larger objects. However, such basins are expensive, and require considerable labor to build and maintain; hence why they are considered an option of last resort.

Aerial view of debris-flow deposition resulting in widespread destruction on the Caraballeda fan of the Quebrada San Julián. Credit: US Geological Survey
Aerial view of the destruction caused by a debris-flow in the Venezuelan town of Caraballeda. Credit: US Geological Survey

Currently, there is no way to monitor for the possibility of debris flow, since they can occur very rapidly and are often dependent on cycles in the weather that can be unpredictable. However, early warning systems are being developed for use in areas where debris flow risk is especially high.

One method involves early detection, where sensitive seismographs detect debris flows that have already started moving and alert local communities. Another way is to study weather patterns using radar imaging to make precipitation estimates – using rainfall intensity and duration values to establish a threshold of when and where a flows might occur.

In addition, replanting forests on hillsides to anchor the soil, as well as monitoring hilly areas that have recently suffered from wildfires is a good preventative measure. Identifying areas where debris flows have happened in the past, or where the proper conditions are present, is also a viable means of developing a debris flow mitigation plan.

We have written many articles about landslides for Universe Today. Here’s Satellites Could Predict Landslides, Recent Landslide on Mars, More Recent Landslides on Mars, Landslides and Bright Craters on Ceres Revealed in Marvelous New Images from Dawn.

If you’d like more info on debris flow, check out Visible Earth Homepage. And here’s a link to NASA’s Earth Observatory.

We’ve also recorded an episode of Astronomy Cast all about planet Earth. Listen here, Episode 51: Earth.

Sources:

Approval For NASA Authorization Bill

NASA has unveiled a new exercise device that will be used by Orion crews to stay healthy on their mission to Mars. Credit: NASA

On Sept. 15th, the Senate Committee on Commerce, Science, and Transportation met to consider legislation formally introduced by a bipartisan group of senators. Among the bills presented was the NASA Transition Authorization Act of 2016, a measure designed to ensure short-term stability for the agency in the coming year.

And as of Thursday, Sept. 22nd, the Senate Commerce Committee approved the bill, providing $19.5 billion in funding for NASA for fiscal year 2017. This funding was intended for the purpose of advancing the agency’s plans for deep space exploration, the Journey to Mars, and operations aboard the International Space Station.

According to Senator Ted Cruz, the bill’s lead sponsor, the Act was introduced in order to ensure that NASA’s major programs would be stable during the upcoming presidential transition. As Cruz was quoted as saying by SpaceNews:

“The last NASA reauthorization act to pass Congress was in 2010. And we have seen in the past the importance of stability and predictability in NASA and space exploration: that whenever one has a change in administration, we have seen the chaos that can be caused by the cancellation of major programs.”
Graphic shows Block I configuration of NASA’s Space Launch System (SLS). Credits: NASA/MSFC

This last act was known as the “NASA Authorization Act of 2010“, which authorized appropriations for NASA between the years of 2011-2013. In addition to providing a total of $58 billion in funding for those three years, it also defined long-term goals for the space agency, which included expanding human space flight beyond low-Earth orbit and developing technical systems for the “Journey to Mars”.

Intrinsic to this was the creation of the Space Launch System (SLS) as a successor to the Space Shuttle Program, the development of the Orion Multipurpose Crew Vehicle, full utilization of the International Space Station, leveraging international partnerships, and encouraging public participation by investing in education.

These aims are outlined in Section 415 of the bill, titled “Stepping Stone Approach to Exploration“:

“In order to maximize the cost-effectiveness of the long-term exploration and utilization activities of the United States, the Administrator shall take all necessary steps, including engaging international, academic, and industry partners to ensure that activities in the Administration’s human exploration program balance how those activities might also help meet the requirements of future exploration and utilization activities leading to human habitation on the surface of Mars.”

NASA has unveiled a new exercise device that will be used by Orion crews to stay healthy on their mission to Mars. Credit: NASA

While the passage of the bill is certainly good news for NASA’s bugeteers, it contains some provisions which could pose problems. For example, while the bill does provide for continued development of the SLS and Orion capsule, it advised that NASA find alternatives for its Asteroid Robotic Redirect Missions (ARRM), which is currently planned for the 2020s.

This mission, which NASA deemed essential for testing key systems and developing expertise for their eventual crewed mission to Mars, was cited for not falling within original budget constraints. Section 435 (“Asteroid Robotic Redirect Mission“), details these concerns, stating that an initial estimate put the cost of the mission at $1.25 billion, excluding launch and operations.

However, according to a Key Decision Point-B review conducted by NASA on July 15th, 2016, a new estimate put the cost at $1.4 billion (excluding launch and operations). As a result, the bill’s sponsors concluded that ARM is in competition with other programs, and that an independent cost assessment and some hard choices may be necessary.

In Section 435, subsection b (parts 1 and 2), its states that:

“[T]he technological and scientific goals of the Asteroid Robotic Redirect Mission may not be commensurate with the cost; and alternative missions may provide a more cost effective and scientifically beneficial means to demonstrate the technologies needed for a human mission to Mars that would otherwise be demonstrated by the Asteroid Robotic Redirect Mission.”

NASA's new budget could mean the end of their Asteroid Redirect Mission. Image: NASA (Artist's illustration)
Artist’s impression of NASA’s ARM, which could be threatened by the agency’s new budget. Credit: NASA

The bill was also subject to amendments, which included the approval of funding for the development of satellite servicing technology. Under this arrangement, NASA would have the necessary funds to create spacecraft capable of repairing and providing maintenance to orbiting satellites, thus ensuring long-term functionality.

Also, Cruz and Bill Nelson (D-Fla), the committee ranking member, also supported an amendment that would indemnify companies or third parties executing NASA contracts. In short, companies like SpaceX or Blue Origin would now be entitled to compensation (above a level they are required to insure against) in the event of damages or injuries incurred as a result of launch and reentry services being provided.

According to a Commerce Committee press release, Sen. Bill Nelson had this to say about the bill’s passage:

“I want to thank Chairman Thune and the members of the committee for their continued support of our nation’s space program. Last week marked the 55th anniversary of President Kennedy’s challenge to send a man to the Moon by the end of the decade.  The NASA bill we passed today keeps us moving toward a new and even more ambitious goal – sending humans to Mars.”

With the approval of the Commerce Committee, the bill will now be sent to the Senate for approval. It is hoped that the bill will pass through the Senate quickly so it can be passed by the House before the year is over. Its supporters see this as crucial to maintaining NASA’s funding in the coming years, during which time they will be taking several crucial steps towards the proposed crewed mission to Mars.

Further Reading: SpaceNews, congress.gov

Five New Neptunian Trojans Discovered

Artist's concept of Trojan asteroids, small bodies that dominate our solar system. Credit: NASA

The Solar System is filled with what are known as Trojan Asteroids – objects that share the orbit of a planet or larger moon. Whereas the best-known Trojans orbit with Jupiter (over 6000), there are also well-known Trojans orbiting within Saturn’s systems of moons, around Earth, Mars, Uranus, and even Neptune.

Until recently, Neptune was thought to have 12 Trojans. But thanks to a new study by an international team of astronomers – led by Hsing-Wen Lin of the National Central University in Taiwan – five new Neptune Trojans (NTs) have been identified. In addition, the new discoveries raise some interesting questions about where Neptune’s Trojans may come from.

For the sake of their study – titled “The Pan-STARRS 1 Discoveries of Five New Neptune Trojans“- the team relied on data obtained by the Panoramic Survey Telescope and Rapid Response System (Pan-STARRS). This wide-field imaging facility – which was founded by the University of Hawaii’s Institute for Astronomy – has spent the last decade searching the Solar System for asteroids, comets, and Centaurs.

PS1 at dawn. The mountain in the distance is Mauna Kea, about 130 kilometers southeast. Credit: pan-starrs.ifa.hawaii.edu
The PS1 telescope at dawn, with the mountain of Mauna Kea visible in the distance. Credit: pan-starrs.ifa.hawaii.edu

The team used data obtained by the PS-1 survey, which ran from 2010 to 2014 and utilized the first Pan-STARR telescope on Mount Haleakala, Hawaii. From this, they observed seven Trojan asteroids around Neptune, five of which were previously undiscovered. Four of the TNs were observed orbiting within Neptune’s L4 point, and one within its L5 point.

The newly detected objects have sizes ranging from 100 to 200 kilometers in diameter, and in the case of the L4 Trojans, the team concluded from the stability of their orbits that they were likely primordial in origin. Meanwhile, the lone L5 Trojan was more unstable than the other four, which led them to hypothesize that it was a recent addition.

As Professor Lin explained to Universe Today via email:

“The 2 of the 4 currently known L5 Neptune Trojans, included the one L5 we found in this work, are dynamically unstable and should be temporary captured into Trojan cloud. On the other hand, the known L4 Neptune Trojans are all stable. Does that mean the L5 has higher faction of temporary captured Trojans? It could be, but we need more evidence.”

In addition, the results of their simulation survey showed that the newly-discovered NT’s had unexpected orbital inclinations. In previous surveys, NTs typically had high inclinations of over 20 degrees. However, in the PS1 survey, only one of the newly discovered NTs did, whereas the others had average inclinations of about 10 degrees.

Animation showing the path of six of Neptune's L4 trojans in a rotating frame with a period equal to Neptune's orbital period.. Credit: Tony Dunn/Wikipedia Commons
Animation showing the path of six of Neptune’s L4 trojans in a rotating frame with a period equal to Neptune’s orbital period.. Credit: Tony Dunn/Wikipedia Commons

From this, said Lin, they derived two possible explanations:

“The L4 “Trojan Cloud” is wide in orbital inclination space. If it is not as wide as we thought before,  the two observational results are statistically possible to generate from the same intrinsic inclination distribution. The previous study suggested >11 degrees width of inclination, and most likely is ~20 degrees. Our study suggested that it should be 7 to 27 degrees, and the most likely is ~ 10 degrees.”

“[Or], the previous surveys were used larger aperture telescopes and detected fainter NT than we found in PS1. If the fainter (smaller) NTs have wider inclination distribution than the larger ones, which means the smaller NTs are dynamically “hotter” than the larger NTs, the disagreement can be explained.”

According to Lin, this difference is significant because the inclination distribution of NTs is related to their formation mechanism and environment. Those that have low orbital inclinations could have formed at Neptune’s Lagrange Points and eventually grew large enough to become Trojans asteroids.

Illustration of the Sun-Earth Lagrange Points. Credit: NASA

On the other hand, wide inclinations would serve as an indication that the Trojans were captured into the Lagrange Points, most likely during Neptune’s planetary migration when it was still young. And as for those that have wide inclinations, the degree to which they are inclined could indicate how and where they would have been captured.

“If the width is ~ 10 degrees,” he said, “the Trojans can be captured from a thin (dynamically cold) planetesimal disk. On the other hand, if the Trojan cloud is very wide (~ 20 degrees), they have to be captured from a  thick (dynamically hot) disk. Therefore, the inclination distribution give us an idea of how early Solar system looks like.”

In the meantime, Li and his research team hope to use the Pan-STARR facility to observe more NTs and hundreds of other Centaurs, Trans-Neptunian Objects (TNOs) and other distant Solar System objects. In time, they hope that further analysis of other Trojans will shed light on whether there truly are two families of Neptune Trojans.

This was all made possible thanks to the PS1 survey. Unlike most of the deep surveys, which are only ale to observe small areas of the sky, the PS1 is able to monitor the whole visible sky in the Northern Hemisphere, and with considerable depth. Because of this, it is expected to help astronomers spot objects that could teach us a great deal about the history of the early Solar System.

Further Reading: arXiv

New Soyuz Mission A Go After Technical Delays

The Soyuz MS-01 spacecraft preparing to launch from the Baikonur Cosmodrome, in Kazakhstan, on Monday, July 4th, 2016. Credit: (NASA/Bill Ingalls)

On Saturday, September 17th, the Russian space agency (Roscosmos) stated that it would be delaying the launch of the crewed spacecraft Soyuz MS-02. The rocket was scheduled to launch on Friday, September 23rd, and would be carrying a crew of three astronauts – two Russia and one American – to the ISS.

After testing revealed technical flaws in the mission (which were apparently due to a short circuit), Rocosmos decided to postpone the launch indefinitely. But after after days of looking over the glitch, the Russians space agency has announced that it is prepared for a renewed launch on Nov. 1st.

The mission crew consists of mission commander Sergey Ryzhikov, flight engineer Andrey Borisenko and NASA astronaut Shane Kimbrough. Originally scheduled to launch on Sept. 23rd, the mission would spend the next two days conducting a rendezvous operation before docking with the International Space Station on Sept. 25th.

The crew of MS-02 (from left to right) - Shane Kimgrough, Sergey Ryzhikov and Andrey Borisenko, pictured in Red Square in Moscow. Credit: NASA/Bill Ingalls
The crew of MS-02 (from left to right): Shane Kimgrough, Sergey Ryzhikov and Andrey Borisenko, pictured in Red Square in Moscow. Credit: NASA/Bill Ingalls

The station is currently being staffed by three crew members – MS-01 commander Anatoly Ivanishin, NASA astronaut Kate Rubins and Japanese astronaut Takuya Onish. These astronauts arrived on the station on Sept.6th, and all three were originally scheduled to return to Earth on October 30th.

Meanwhile, three more astronauts – commander Oleg Novitskiy, ESA flight engineer Thomas Pesquet and NASA astronaut Peggy Whitson – were supposed to replace them as part of mission MS-03, which was scheduled to launch on Nov. 15th. But thanks to the technical issue that grounded the MS-02 flight, this schedule appeared to be in question.

However, the news quickly began to improve after it seemed that the mission might be delayed indefinitely. On Sept.18th, a day after the announcement of the delay, the Russian International News Agency (RIA Novosti) cited a source that indicated that the spacecraft could be replaced and the mission could be rescheduled for next month:

“RIA Novosti’s source noted that the mission was postponed indefinitely because of an identified short circuit during the pre-launch checks. It is possible that the faulty ship “MS – 02 Alliance” can be quickly replaced on the existing same rocket, and then the launch to the ISS will be held in late October.”

Three newly arrived crew of Expedition 48 in Soyuz MS-01 open the hatch and enter the International Space Station after docking on July 9, 2016. Credit: NASA TV

Then, on Monday, Sept.19th, another source cited by RIA Novosti said that the State Commission responsible for the approval of a new launch date would be reaching a decision no sooner than Tuesday, Sept. 20th. And as of Tuesday morning, a new launch date appears to have been set.

According to news agency, Roscomos notified NASA this morning that the mission will launch on Nov.1st. Sputnik International confirmed this story, claiming that the source was none other than Alexander Koptev – a NASA representative with the Russian Mission Control Center.

“The Russian side has informed the NASA central office of the preliminary plans to launch the manned Soyuz MS-02 on November 1,” he said.

It still not clear where the technical malfunction took place. Since this past Saturday, Russian engineers have been trying to ascertain if the short circuit occurred in the descent module or the instrument module. However, the Russians are already prepared to substitute the Soyuz spacecraft for the next launch, so there will be plenty of time to locate the source of the problem.

The Soyuz MS-01 spacecraft launches from the Baikonur Cosmodrome with Expedition 48-49 crewmembers Kate Rubins of NASA, Anatoly Ivanishin of Roscosmos and Takuya Onishi of the Japan Aerospace Exploration Agency (JAXA) onboard, Thursday, July 7, 2016 , Kazakh time (July 6 Eastern time), Baikonur, Kazakhstan. Photo Credit: NASA/Bill Ingalls
The Soyuz MS-01 spacecraft launches from the Baikonur Cosmodrome on July 7th, 2016. Credit: NASA/Bill

The Soyuz MS is the latest in a long line of revisions to the venerable Soyuz spacecraft, which has been in service with the Russians since the 1960s. It is perhaps the last revision as well, as Roscosmos plans to develop new crewed spacecraft in the coming decades.

The MS is an evolution of the Soyuz TMA-M spacecraft, another modernized version of the old spacecraft. Compared to its predecessor, the MS model’s comes with updated communications and navigation subsystems, but also boasts some thruster replacements.

The first launch of the new spacecraft – Soyuz MS-01 – took place on July 7th, 2016, aboard a Soyuz-FG launch vehicle, which is itself an improvement on the traditional R-7 rockets. Like the MS-02 mission, MS-01 spent two days undergoing a checkout phase in space before rendezvousing with the ISS.

As such, it is understandable why the Russians would like to get this mission underway and ensure that the latest iteration of the Soyuz MS performs well in space. Until such time as the Russians have a new crewed module to deliver astronauts to the ISS, all foreseeable missions will come down to craft like this one.

Further Reading: Roscosmos, Spaceflightnow.com

What is Tornado Alley?

A tornado near Anadarko, Oklahoma. Credit: NSSL/NOAA

Tornadoes are a fascinating force of nature, as awe-inspiring as they are destructive. They form periodically due to the convergence of weather patterns, and often leave plenty of devastation in their wake. And for those who live in the active tornado regions of the world, they are an unfortunate fact of life.

Such is the nature of life for those who live in the infamous “Tornado Alley”, a region that extends from the southern US into parts of Canada. This area is so-named because of the frequency with which tornadoes take place. Compared to other active regions of the world, this area experiences the highest frequency of violent tornadoes.

Origin of the Name:

The term “Tornado Alley” was first used in 1952 as the title of a research project about severe weather in the US. This project was conducted by U.S. Air Force meteorologists Maj. Ernest J. Fawbush and Capt. Robert C. Miller, and covered a region extending from areas of Texas to locations throughout the mid-western US.

Tornado at Union City, Oklahoma Credit, NOAA Photo Library
Tornado at Union City, Oklahoma. Credit: NOAA Photo Library

The term has since caught on thanks to media sources as well meteorologist and climatologists, though many use the term “Great Plains Tornado Belt” as well.

Geographical Area:

The geographical boundaries of “Tornado Alley” have never been very clearly defined and no official definition has been adopted by the National Weather Service (NWS). As a result, different definitions and boundaries have been adopted based on different sets of criteria. For instance, the National Severe Storms Laboratory (NSSL) states:

“‘Tornado Alley’ is just a nickname made up by the media for an area of relatively high tornado occurrence; it is not a clearly defined area. Is tornado alley the area with the most violent tornadoes, or is it the area with the most tornado-related deaths, or the highest frequency or tornadoes? It depends on what kind of information you want!”

While no region of the US is entirely free of tornadoes, they occur more frequently in the mid-western US – spanning areas of Texas to parts of Oklahoma, Kansas, South Dakota, Iowa, Illinois, Missouri, New Mexico, Colorado, North Dakota, and Minnesota.

Tornado Alley
Artist’s impression of the geographical region known as “Tornado Alley”. Credit: Dan Craggs/Wikipedia Commons

Texas reports the most tornadoes of any state, whereas Kansas and Oklahoma rank first and second respectively in the number of tornadoes per area. Florida also reports a high number and density of tornado occurrences, though tornadoes there rarely reach the strength of those that sometimes occur in the southern plains.

However, the Canadian prairies, eastern Colorado and western Pennsylvania are often included in the boundaries. And last, several smaller areas have been designated as being their own “Tornado Alley” – which include the Texas/Oklahoma/Kansas core, the Upper Midwest, the lower Ohio Valley, the Tennessee Valley and the lower Mississippi valley.

There is also the term “Dixie Alley”, a name coined by Allen Peasons, a former director of the National Severe Storms Forecasting Center (NSSFC), in 1971. This name refers to the lower Mississippi Valley and upper Tennessee Valley were tornadoes occur frequently.

Nevertheless, most definitions focus on the geographical region known as the Great Plains where no major mountain ranges are located. This is important because mountains act as breaks on weather systems, forcing them to dump the majority of their moisture before crossing over them (the reason why the southwestern US has a more arid climate).

 Image from Federal Emergency Management Agency, a United States government agency, booklet FEMA 320 Third Edition, Section 1, Figure 1.1, page 3, titled Taking Shelter from the Storm: Building a Safe Room Inside your House. Credit: FEMA
Image from Federal Emergency Management Agency booklet, “Taking Shelter from the Storm: Building a Safe Room Inside your House” (3rd ed.). Credit: FEMA

In the case of the Great Plains, the region’s lack of these natural barriers leaves it open to cold fronts from Canada and warm fronts from Mexico and the Gulf Coast. When cold and warm front collide, they create supercells and thunderstorm systems that lead to tornadoes.

Impact:

Due to the frequency of tornadoes in certain areas of the United States, building codes and warning systems have been implemented. These include the institution of special building codes, construction of storm cellars, sirens, preparedness drills, education programs, and regular weather coverage by local media outlets.

According to the National Climatic Data Center, during the period of 1991 to 2010, those states that have the most experienced an average of 5.7 (Minnesota) to 12.2 (Florida) tornadoes. Using a long-term average (based on data collected between 1950 and 2012), the entire “Alley” experiences about 268 tornadoes per year.

In the southeastern United States, where housing is less robust and many people live in mobile homes, causalities are particularly high. According to the NOAA, almost 3600 tornadoes have occurred in the United States, which resulted in more than 20,000 deaths, between 1680 and 2000.

The track of the tornado that struck Moore, Oklahoma on May 20, 2013 is visible from space in this false color image taken on June 2, 2013 by the Advanced Spaceborne Thermal Emission and Reflection Radiometer (ASTER) on NASA’s Terra satellite.

Meanwhile, data from the Tornado History Project shows there were 5,587 confirmed fatalities blamed on tornadoes across the United States between 1950 and 2012. Of those, 1,110 occurred in Tornado Alley. The injuries caused by tornadoes are much higher, with a reported 64,054 injuries being attributed to tornadoes during the same period – over 15,000 of which occurred in Tornado Alley.

The worst year on record was 2011, when tornado activity spiked leading to 1,704 confirmed tornadoes and 553 confirmed deaths. This includes the 158 deaths that resulted from the tornado that struck Joplin, Missouri, on May 22nd, which was also the deadliest since modern record-keeping began in 1950.

In financial terms, the cost of tornadoes is also quite high. In fact, the Insurance Information Institute reports that between 1993 and 2012, the average insured loss per year was $7.78 billion for severe thunderstorm events, including tornadoes. In 2011, during the spike in storms, an estimated $27 billion was filed for in insurance claims.

No matter how you slice it, living in regions where tornadoes are known to frequent is both a dangerous and expensive prospect. As our understanding of tornadoes grows, we are able to predict where they will form and what paths they will take with greater accuracy. As such, we can reduce the cost in human and monetary terms over time.

Deadly Tornado Rips Across Indiana and Kentucky
Satellite image showing the after-effects of the deadly tornado that ripped through Indiana and Kentucky. Credit: NASA Landsat Project Science Office and USGS EROS

But in the long run, the greatest safeguards against injuries and death are public awareness and education. Tornadoes are also an important aspect of Climate Change, since changes in our environment are likely to effect and exacerbate extreme weather patterns.

We have written many articles about tornadoes for Universe Today. Here’s How Do Tornadoes Form?, What was the Largest Tornado Ever Recorded?, New Gigantic Tornado Spotted on Mars, and Huge “Tornado” on the Sun.

If you’d like more info on tornado, check out the National Oceanic and Atmospheric Administration Homepage. And here’s a link to NASA’s Earth Observatory.

We’ve also recorded an episode of Astronomy Cast all about planet Earth. Listen here, Episode 51: Earth.

Sources:

What is the Temperature of the Earth’s Crust?

The Earth's layers, showing the Inner and Outer Core, the Mantle, and Crust. Credit: discovermagazine.com

As you may recall learning in geology class, the Earth is made up of distinct layers. The further one goes towards the center of the planet, the more intense the heat and pressure becomes. Luckily, for those of us living on the crust (the outermost layer, where all life lives) the temperature is relatively steady and pleasant.

In fact, one of the things that makes planet Earth habitable is the fact that the planet is close enough to our Sun to receive enough energy to stay warm. What’s more, its “surface temperatures” are warm enough to sustain liquid water, the key to life as we know it. But the temperature of Earth’s crust also varies considerably depending on where and when you are measuring it.

Earth’s Structure:

As a terrestrial planet, Earth is composed of silicate rocks and metals which are differentiated between a solid metal core, a molten outer core, and a silicate mantle and crust. The inner core has an estimated radius of 1,220 km, while the outer core extends beyond it to a radius of about 3,400 km.

The layers of the Earth, a differentiated planetary body. Credit: Wikipedia Commons/Surachit

Extending outwards from the core are the mantle and the crust. Earth’s mantle extends to a depth of 2,890 km beneath the surface, making it the thickest layer of Earth. This layer is composed of silicate rocks that are rich in iron and magnesium relative to the overlying crust. Although solid, the high temperatures within the mantle cause the silicate material to be sufficiently ductile that it can flow on very long timescales.

The upper layer of the mantle is divided into the lithospheric mantle (aka. the lithosphere) and the asthenosphere. The former consists of the crust and the cold, rigid, top part of the upper mantle (which the tectonic plates are composed of) while the asthenosphere is the relatively low-viscosity layer on which the lithosphere rides.

Earth’s Crust:

The crust is the absolute outermost layer of the Earth, which constitutes just 1% of the Earth’s total mass. The thickness of the crust varies depending on where the measurements are taken, ranging from 30 km thick where there are continents to just 5 km thick beneath the oceans.

The crust is composed of a variety of igneous, metamorphic and sedimentary rocks and is arranged in a series of tectonic plates. These plates float above the Earth’s mantle, and it’s believed that convection in the mantle causes the plates to be in constant motion.

Sometimes these plates collide, pull apart, or slide alongside each other; resulting in convergent boundaries, divergent boundaries, and transform boundaries. In the case of convergent boundaries, subduction zones are often the result, where the heavier plate slips under the lighter plate – forming a deep trench.

In the case of divergent boundaries, these are formed when tectonic plates pull apart, forming rift valleys on the seafloor. When this happens, magma wells up in the rift as the old crust pulls itself in opposite directions, where it is cooled by seawater to form new crust.

A transform boundary is formed when tectonic plates slide horizontally and parts get stuck at points of contact. Stress builds in these areas as the rest of the plates continue to move, which causes the rock to break or slip, suddenly lurching the plates forward and causing earthquakes. These areas of breakage or slippage are called faults.

The Earth's Tectonic Plates. Credit: msnucleus.org
Illustration of the Earth’s Tectonic Plates and the plate boundaries. Credit: msnucleus.org

Taken together, these three types of tectonic plate action are what is responsible for shaping the Earth’s crust and leading to periodic renewal of its surface over the course of millions of years.

Temperature Range:

The temperature of the Earth’s crust ranges considerably. At its outer edge, where it meets the atmosphere, the crust’s temperature is the same temperature as that of the air. So, it might be as hot as 35 °C in the desert and below freezing in Antarctica. On average, the surface of the Earth’s crust experiences temperatures of about 14°C.

However, the hottest temperature ever recorded was 70.7°C (159°F), which was taken in the Lut Desert of Iran as part of a global temperature survey conducted by scientists at NASA’s Earth Observatory. Meanwhile, the coldest temperature ever recorded on Earth was measured at the Soviet Vostok Station on the Antarctic Plateau – which reached an historic low of -89.2°C (-129°F) on July 21st, 1983.

That’s quite the range already. But consider the fact that the majority of the Earth’s crust lies beneath the oceans. Far from the Sun, temperatures can reach as low as 0-3° C (32-37.5° F) where the water reaches the crust. Still, a lot balmier than a cold night in Antarctica!

And as geologists have known for some time, if you dig down into the continental crust, temperatures will go up. For example, the deepest mine in the world is currently the TauTona gold mine in South Africa, measuring 3.9 km deep. At the bottom of the mine, temperatures reach a sweltering 55 °C, which requires that air conditioning be provided so that it’s comfortable for the miners to work all day.

So in the end, the temperature of Earth’s crust varies considerably. It’s average surface temperature which depends on whether it is being taken on dry land or beneath the sea. And depending on the location, seasons, and time of day, it can range from sweltering to freezing cold!

And yet, Earth’s crust remains the only place in the Solar System where temperatures are stable enough that life can continue to thrive on it. Add to that our viable atmosphere and protective magnetosphere, and we really should consider ourselves to be the lucky ones!

We’ve written many articles about the Earth for Universe Today. Here’s What are the Layers of the Earth?, Ten Interesting Facts about the Earth, What is the Diameter of the Earth?, What is Earth’s Gravity?, The Rotation of the Earth, and What is Earth’s Crust?

an article about the Earth’s outer core, and here’s an article about the Earth’s crust.

If you’d like more info on Earth, check out NASA’s Solar System Exploration Guide on Earth. And here’s a link to NASA’s Earth Observatory.

We’ve also recorded an episode of Astronomy Cast all about planet Earth. Listen here, Episode 51: Earth.

Sources:

What is the Difference Between Active and Dormant Volcanoes?

Volcano Vesuvius. Image credit: Pastorius

Volcanoes are an impressive force of nature. Physically, they dominate the landscape, and have an active role in shaping our planet’s geography. When they are actively erupting, they are an extremely dangerous and destructive force. But when they are passive, the soil they enrich can become very fertile, leading to settlements and cities being built nearby.

Such is the nature of volcanoes, and is the reason why we distinguish between those that are “active” and those that are “dormant”. But what exactly is the differences between the two, and how do geologists tell? This is actually a complicated question, because there’s no way to know for sure if a volcano is all done erupting, or if it’s going to become active again.

Put simply, the most popular way for classifying volcanoes comes down to the frequency of their eruption. Those that erupt regularly are called active, while those that have erupted in historical times but are now quiet are called dormant (or inactive). But in the end, knowing the difference all comes down to timing!

Sarychev volcano, (located in Russia's Kuril Islands, northeast of Japan) in an early stage of eruption on June 12, 2009. Credit: NASA
Sarychev volcano, (located in Russia’s Kuril Islands, northeast of Japan) in an early stage of eruption on June 12, 2009. Credit: NASA

Active Volcano:

Currently, there is no consensus among volcanologists about what constitutes “active”. Volcanoes – like all geological features – can have very long lifespans, varying between months to even millions of years. In the past few thousand years, many of Earth’s volcanoes have erupted many times over, but currently show no signs of impending eruption.

As such, the term “active” can mean only active in terms of human lifespans, which are entirely different from the lifespans of volcanoes. Hence why scientists often consider a volcano to be active only if it is showing signs of unrest (i.e. unusual earthquake activity or significant new gas emissions) that mean it is about to erupt.

The Smithsonian Global Volcanism Program defines a volcano as active only if it has erupted in the last 10,000 years. Another means for determining if a volcano is active comes from the International Association of Volcanology, who use historical time as a reference (i.e. recorded history).

Aleutian island #volcano letting off a little steam after the new year on Jan 2, 2016. #YearInSpace. Credit: NASA/Scott Kelly/@StationCDRKelly

By this definition, those volcanoes that have erupted in the course of human history (which includes more than 500 volcanoes) are defined as active. However, this too is problematic, since this varies from region to region – with some areas cataloging volcanoes for thousands of years, while others only have records for the past few centuries.

As such, an “active volcano” can be best described as one that’s currently in a state of regular eruptions. Maybe it’s going off right now, or had an event in the last few decades, or geologists expect it to erupt again very soon. In short, if its spewing fire or likely to again in the near future, then it’s active!

Dormant Volcano:

Meanwhile, a dormant volcano is used to refer to those that are capable of erupting, and will probably erupt again in the future, but hasn’t had an eruption for a very long time. Here too, definitions become complicated since it is difficult to distinguish between a volcano that is simply not active at present, and one that will remain inactive.

Volcanoes are often considered to be extinct if there are no written records of its activity. Nevertheless, volcanoes may remain dormant for a long period of time. For instance, the volcanoes of Yellowstone, Toba, and Vesuvius were all thought to be extinct before their historic and devastating eruptions.

The area around the Vesuvius volcano is now densely populated. Credit: Wikipedia Commons/Jeffmatt
The area around Mount Vesuvius, which erupted in 79 CE, is now densely populated. Credit: Wikipedia Commons/Jeffmatt

The same is true of the Fourpeaked Mountain eruption in Alaska in 2006. Prior to this, the volcano was thought to be extinct since it had not erupted for over 10,000 years. Compare that to Mount Grímsvötn in south-east Iceland, which erupted three times in the past 12 years (in 2011, 2008 and 2004, respectively).

And so a dormant volcano is actually part of the active volcano classification, it’s just that it’s not currently erupting.

Extinct Volcano:

Geologists also employ the category of extinct volcano to refer to volcanoes that have become cut off from their magma supply. There are many examples of extinct volcanoes around the world, many of which are found in the Hawaiian-Emperor Seamount Chain in the Pacific Ocean, or stand individually in some areas.

For example, the Shiprock volcano, which stands in Navajo Nation territory in New Mexico, is an example of a solitary extinct volcano. Edinburgh Castle, located just outside the capitol of Edinburgh, Scotland, is famously located atop an extinct volcano.

An aerial image of the Shiprock extinct volcano. Credit: Wikipedia Commons
Aerial photograph of the Shiprock extinct volcano. Credit: Wikipedia Commons

But of course, determining if a volcano is truly extinct is often difficult, since some volcanoes can have eruptive lifespans that measure into the millions of years. As such, some volcanologists refer to extinct volcanoes as inactive, and some volcanoes once thought to be extinct are now referred to as dormant.

In short, knowing if a volcano is active, dormant, or extinct is complicated and all comes down to timing. And when it comes to geological features, timing is quite difficult for us mere mortals. Individuals and generations have limited life spans, nations rise and fall, and even entire civilization sometimes bite the dust.

But volcanic formations? They can endure for millions of years! Knowing if there still life in them requires hard work, good record-keeping, and (above all) immense patience.

We have written many articles about volcanoes for Universe Today. Here’s Ten Interesting Facts About Volcanoes, What are the Different Types of Volcanoes?, How Do Volcanoes Erupt?, What is a Volcano Conduit?, and What are the Benefits of Volcanoes?

Want more resources on the Earth? Here’s a link to NASA’s Human Spaceflight page, and here’s NASA’s Visible Earth.

We have also recorded an episode of Astronomy Cast about Earth, as part of our tour through the Solar System – Episode 51: Earth.

Sources:

Have We Really Just Seen The Birth Of A Black Hole?

This artist's drawing shows a stellar black hole as it pulls matter from a blue star beside it. Could the stellar black hole's cousin, the primordial black hole, account for the dark matter in our Universe? Credits: NASA/CXC/M.Weiss

For almost half a century, scientists have subscribed to the theory that when a star comes to the end of its life-cycle, it will undergo a gravitational collapse. At this point, assuming enough mass is present, this collapse will trigger the formation of a black hole. Knowing when and how a black hole will form has long been something astronomers have sought out.

And why not? Being able to witness the formation of black hole would not only be an amazing event, it would also lead to a treasure trove of scientific discoveries. And according to a recent study by a team of researchers from Ohio State University in Columbus, we may have finally done just that.

The research team was led by Christopher Kochanek, a Professor of Astronomy and an Eminent Scholar at Ohio State. Using images taken by the Large Binocular Telescope (LBT) and Hubble Space Telescope (HST), he and his colleagues conducted a series of observations of a red supergiant star named N6946-BH1.

Artist’s impression of the star in its multi-million year long and previously unobservable phase as a large, red supergiant. Credit: CAASTRO / Mats Björklund (Magipics)

To break the formation process of black holes down, according to our current understanding of the life cycles of stars, a black hole forms after a very high-mass star experiences a supernova. This begins when the star has exhausted its supply of fuel and then undergoes a sudden loss of mass, where the outer shell of the star is shed, leaving behind a remnant neutron star.

This is then followed by electrons reattaching themselves to hydrogen ions that have been cast off, which causes a bright flareup to occur. When the hydrogen fusing stops, the stellar remnant begins to cool and fade; and eventually the rest of the material condenses to form a black hole.

However, in recent years, several astronomers have speculated that in some cases, stars will experience a failed supernova. In this scenario, a very high-mass star ends its life cycle by turning into a black hole without the usual massive burst of energy happening beforehand.

As the Ohio team noted in their study – titled “The search for failed supernovae with the Large Binocular Telescope: confirmation of a disappearing star” – this may be what happened to N6946-BH1, a red supergiant that has 25 times the mass of our Sun located 20 million light-years from Earth.

Artistic representation of the material around the supernova 1987A. Credit: ESO/L. Calçada
Artistic representation of the material around the supernova 1987A. Credit: ESO/L.

Using information obtained with the LBT, the team noted that N6946-BH1 showed some interesting changes in its luminosity between 2009 and 2015 – when two separates observations were made. In the 2009 images, N6946-BH1 appears as a bright, isolated star. This was consistent with archival data taken by the HST back in 2007.

However, data obtained by the LBT in 2015 showed that the star was no longer apparent in the visible wavelength, which was also confirmed by Hubble data from the same year. LBT data also  showed that for several months during 2009, the star experienced a brief but intense flare-up, where it became a million times brighter than our Sun, and then steadily faded away.

They also consulted data from the Palomar Transit Factory (PTF) survey for comparison, as well as observations made by Ron Arbour (a British amateur astronomer and supernova-hunter). In both cases, the observations showed evidence of a flare during a brief period in 2009 followed by a steady fade.

In the end, this information was all consistent with the failed supernovae-black hole model. As Prof. Kochanek, the lead author of the group’s paper – – told Universe Today via email:

“In the failed supernova/black hole formation picture of this event, the transient is driven by the failed supernova. The star we see before the event is a red supergiant — so you have a compact core (size of ~earth) out the hydrogen burning shell, and then a huge, puffy extended envelope of mostly hydrogen that might extend out to the scale of Jupiter’s orbit.  This envelope is very weakly bound to the star.  When the core of the star collapses, the gravitational mass drops by a few tenths of the mass of the sun because of the energy carried away by neutrinos.  This drop in the gravity of the star is enough to send a weak shock wave through the puffy envelope that sends it drifting away.  This produces a cool, low-luminosity (compared to a supernova, about a million times the luminosity of the sun) transient that lasts about a year and is powered by the energy of recombination.  All the atoms in the puffy envelope were ionized — electrons not bound to atoms — as the ejected envelope expands and cools, the electrons all become bound to the atoms again, which releases the energy to power the transient.  What we see in the data is consistent with this picture.”

The Large Binocular Telescope, showing the two imaging mirrors. Credit: NASA

Naturally, the team considered all available possibilities to explain the sudden “disappearance” of the star. This included the possibility that the star was shrouded in so much dust that its optical/UV light was being absorbed and re-emitted. But as they found, this did not accord with their observations.

“The gist is that no models using dust to hide the star really work, so it would seem that whatever is there now has to be much less luminous then that pre-existing star.” Kochanek explained. “Within the context of the failed supernova model, the residual light is consistent with the late time decay of emission from material accreting onto the newly formed black hole.”

Naturally, further observations will be needed before we can know whether or not this was the case. This would most likely involve IR and X-ray missions, such as the Spitzer Space Telescope and the Chandra X-ray Observatory, or one of he many next-generation space telescopes to be deployed in the coming years.

In addition, Kochanek and his colleagues hope to continue monitoring the possible black hole using the LBT, and by re-visiting the object with the HST in about a year from now. “If it is true, we should continue to see the object fade away with time,” he said.

The James Webb Space Telescope. Image Credit: NASA/JPL
Future missions, like the James Webb Space Telescope, will be able to observe possible failed supernovae/blackholes to confirm their existence. Credit: NASA/JPL

Needless to say, if true, this discovery would be an unprecedented event in the history of astronomy. And the news has certainly garnered its share of excitement from the scientific community. As Avi Loeb – a professor of astronomy at Harvard University – expressed to Universe Today via email:

“The announcement on the potential discovery of a star that collapsed to make a black hole is very interesting. If true, it will be the first direct view of the delivery room of a black hole. The picture is somewhat messy (like any delivery room), with uncertainties about the properties of the baby that was delivered. The way to confirm that a black hole was born is to detect X-rays. 

“We know that stellar-mass black holes exist, most recently thanks to the discovery of gravitational waves from their coalescence by the LIGO team. Almost eighty years ago Robert Oppenheimer and collaborators predicted that massive stars may collapse to black holes. Now we might have the first direct evidence that the process actually happens in nature.

But of course, we must remind ourselves that given its distance, what we could be witnessing with N6946-BH1 happened 20 million years ago. So from the perspective of this potential black hole, its formation is old news. But to us, it could be one of the most groundbreaking observations in the history of astronomy.

Much like space and time, significance is relative to the observer!

Further Reading: arXiv