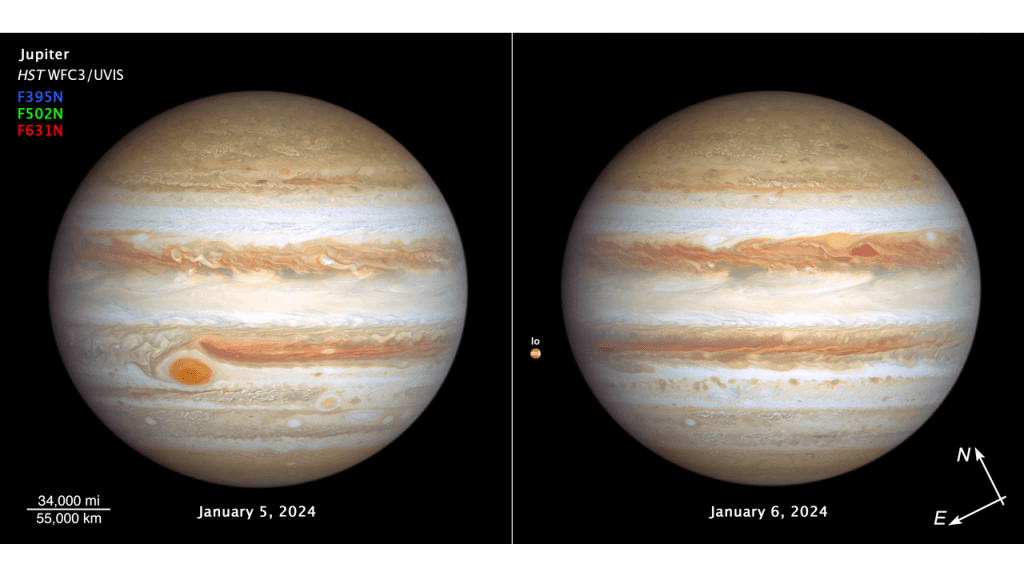
Each year, the Hubble Space Telescope focuses on the giant planets in our Solar System when they're near the closest point to Earth, which means they'll be large and bright in the sky. Jupiter had its photos taken on January 5-6th, 2024, showing off both sides of the planet. Hubble was looking for storm activity and changes in Jupiter's atmosphere.
The images are part of OPAL, the Outer Planet Atmospheres Legacy program. These yearly images provide a long-time baseline of observations of the outer planets, helping to understand their atmospheric dynamics and evolution as gas giants. Jupiter was at perigee -- its closest point to Earth -- back in November 2023.
Jupiter's colorful clouds present an ever-changing medley of shapes and colors, as it is the stormiest place in the Solar System. Its atmosphere is tens of thousands of kilomters/miles deep, and this stormy atmosphere gives the planet its banded appearance. Here you can find cyclones, anticyclones, wind shear, and other large and fantastic storms.
The largest and most famous storm on Jupiter is the Great Red Spot. In the image on the left, you can see the Great Red Spot and a smaller spot to its lower right known as Red Spot Jr. The two spots pass each other every two years on average. In the right image, several smaller storms are rotating in alternating atmospheric bands.
"The many large storms and small white clouds are a hallmark of a lot of activity going on in Jupiter's atmosphere right now," said OPAL project lead Amy Simon of NASA's Goddard Space Flight Center in Greenbelt, Maryland.

NASA explains that the bands are produced by air flowing in different directions at various latitudes with speeds approaching 560 km/h (350 miles per hour). Lighter-hued areas where the atmosphere rises are called zones, while the darker regions where air falls are called belts. When these opposing flows interact, storms and turbulence appear.
Hubble tracks these dynamic changes every year (see a few of our previous articles about Hubble's view of Jupiter here, here and here.) There is always lots of activity and changes taking place from year to year.
Toward the far-left edge of the right-side image is Jupiter's tiny moon Io. The variegated orange color is where volcanic outflow deposits are seen on Io's surface.