
This 4th of July weekend brings us one more reason to celebrate. On July 5th at approximately 11:00 AM EDT/15:00 UT, our fair planet Earth reaches aphelion, or its farthest point from the Sun at 1.0167 Astronomical Units (A.U.s) or 152,096,000 kilometres distant.
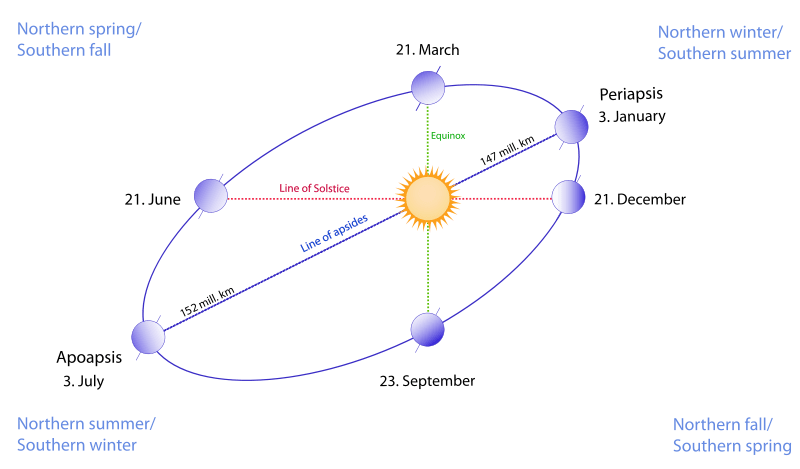
Though it may not seem it to northern hemisphere residents sizzling in the summer heat, we’re currently 3.3% farther from the Sun than our 147,098,290 kilometre (0.9833 A.U.) approach made in early January.
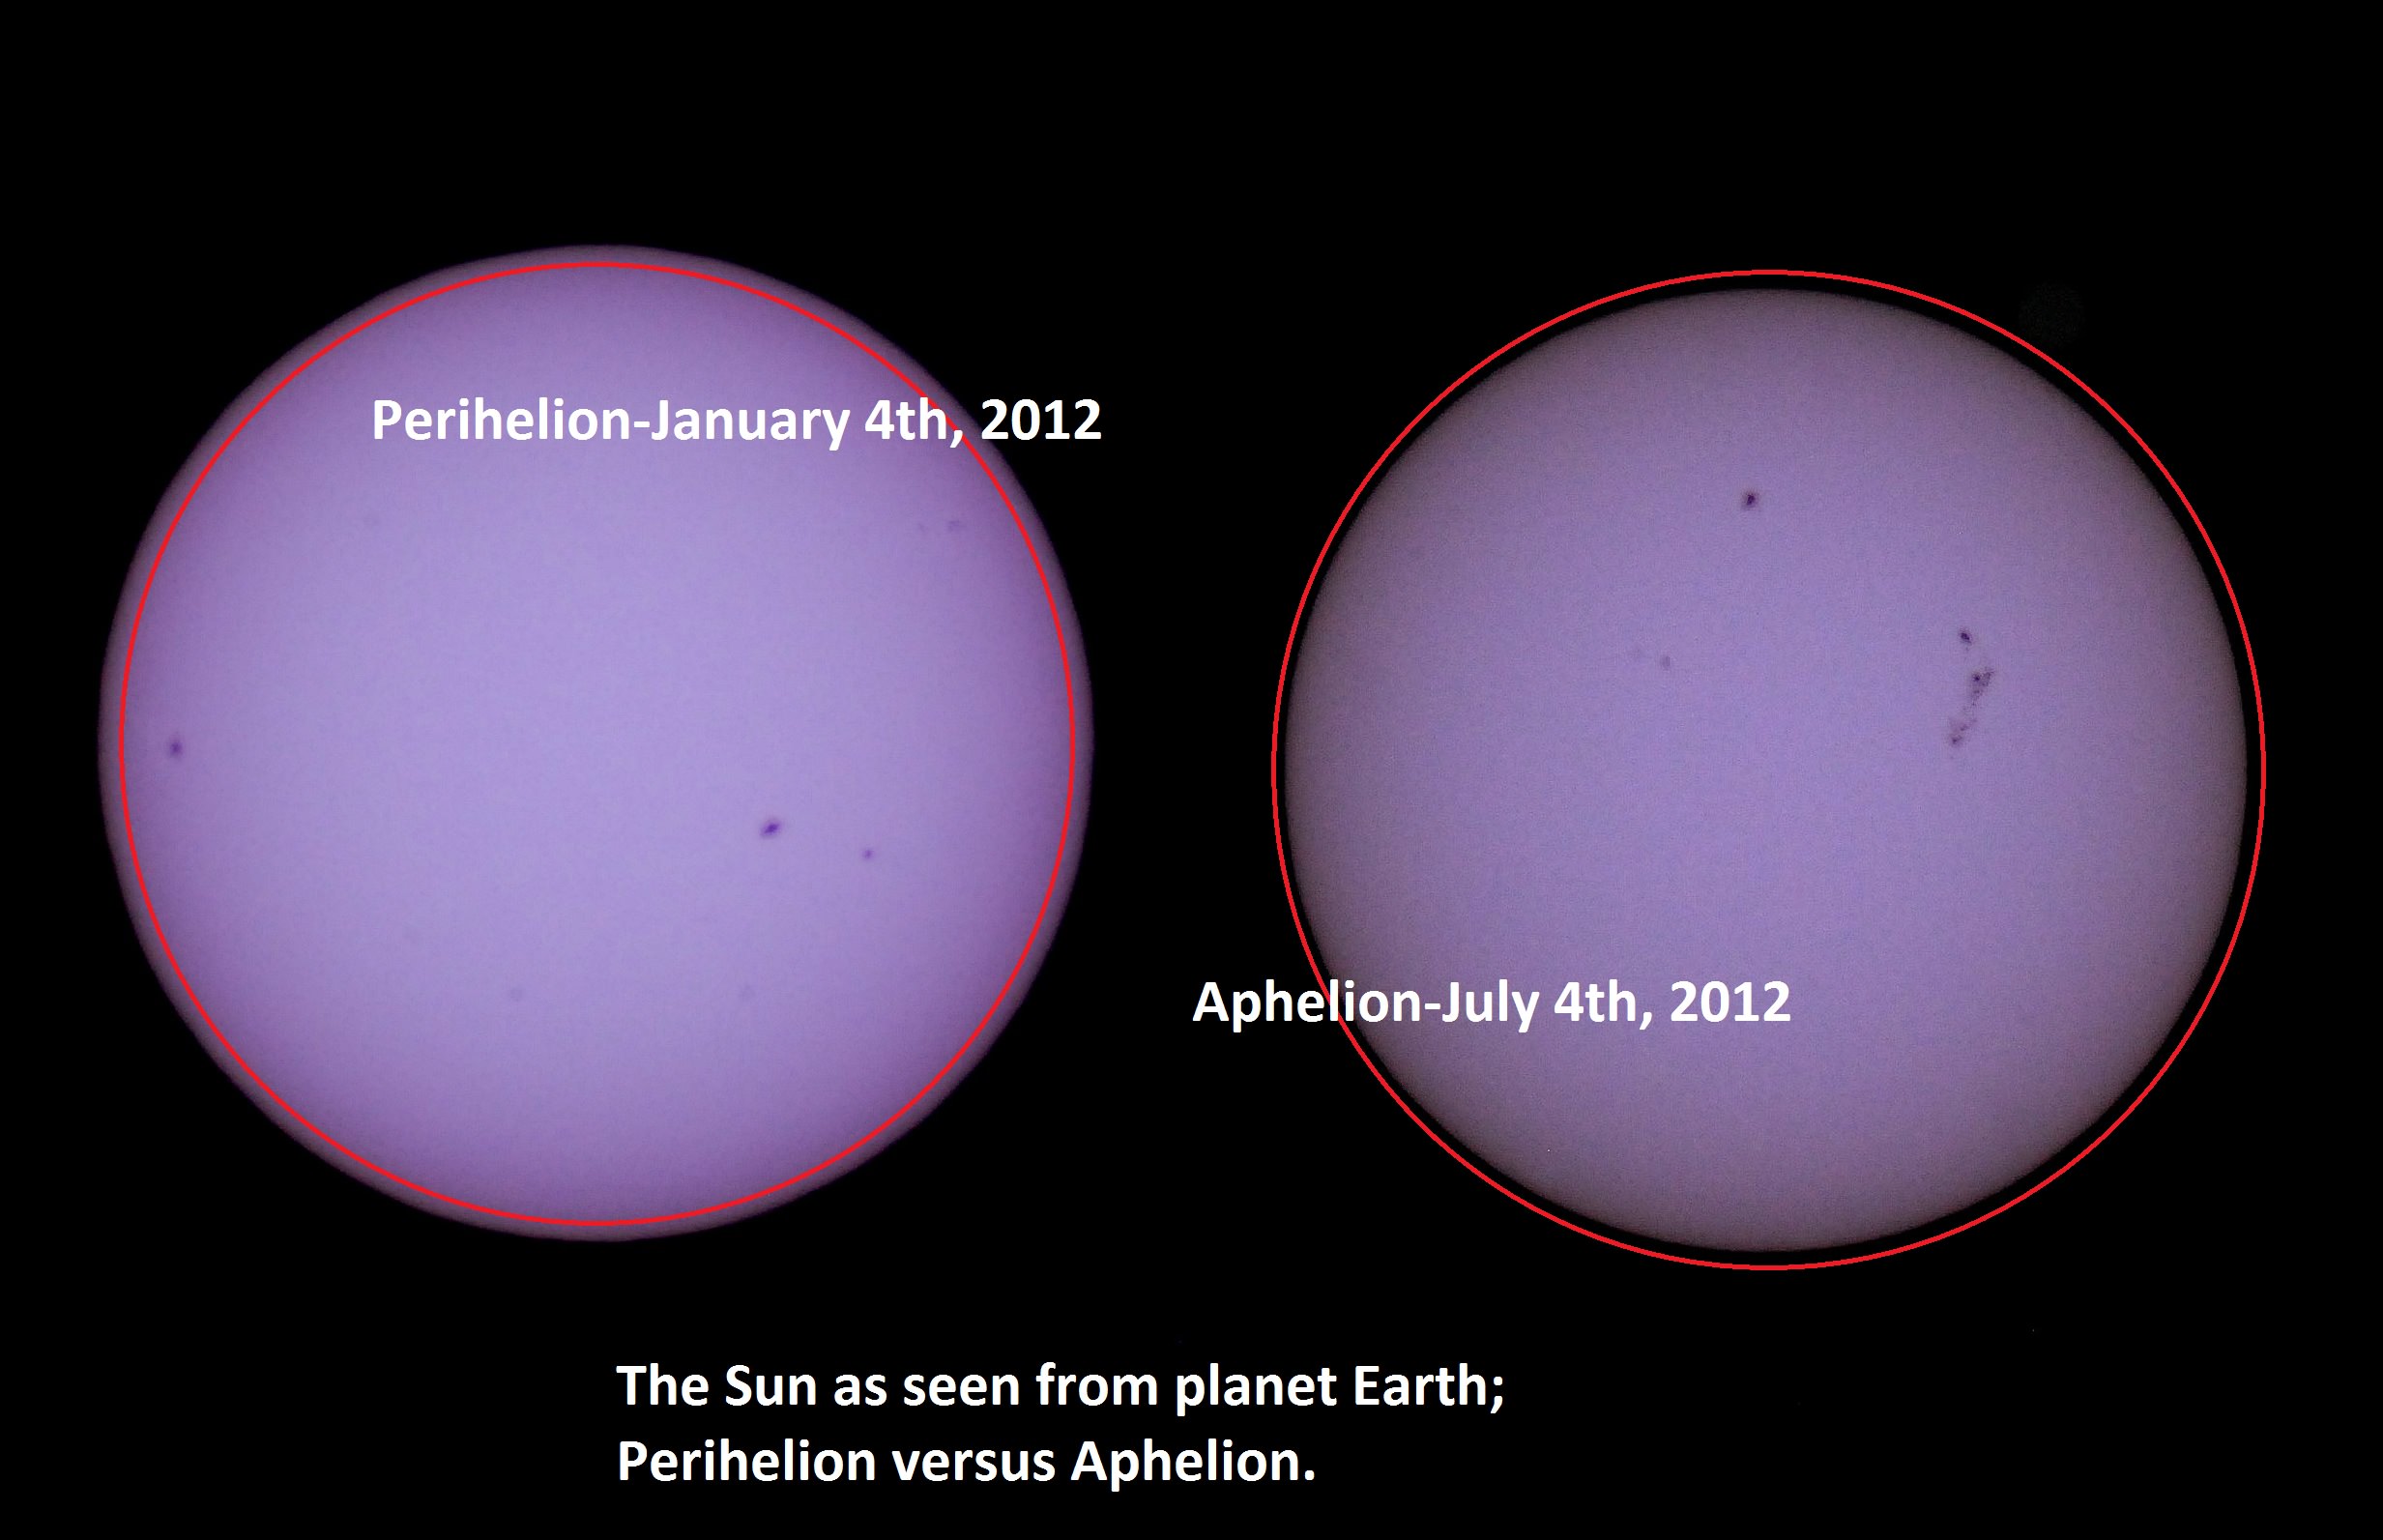
We thought it would be a fun project to capture this change. A common cry heard from denier circles as to scientific facts is “yeah, but have you ever SEEN it?” and in the case of the variation in distance between the Sun and the Earth from aphelion to perihelion, we can report that we have!
We typically observe the Sun in white light and hydrogen alpha using a standard rig and a Coronado Personal Solar Telescope on every clear day. We have two filtered rigs for white light- a glass Orion filter for our 8-inch Schmidt-Cassegrain, and a homemade Baader solar filter for our DSLR. We prefer the DSLR rig for ease of deployment. We’ve described in a previous post how to make a safe and effective solar observing rig using Baader solar film.

We’ve been imaging the Sun daily for a few years as part of our effort to make a home-brewed “solar rotation and activity movie” of the entire solar cycle. We recently realized that we’ve imaged Sol very near aphelion and perihelion on previous years with this same fixed rig, and decided to check and see if we caught the apparent size variation of our nearest star. And sure enough, comparing the sizes of the two disks revealed a tiny but consistent variation.
It’s a common misconception that the seasons are due to our distance from the Sun. The insolation due to the 23.4° tilt of the rotational axis of the Earth is the dominant driving factor behind the seasons. (Don’t they still teach this in grade school? You’d be surprised at the things I’ve heard!) In the current epoch, a January perihelion and a July aphelion results in milder climatic summers in the northern hemisphere and more severe summers in the southern. The current difference in solar isolation between hemispheres due to eccentricity of Earth’s orbit is 6.8%.
The orbit of the Earth also currently has one of the lowest eccentricities (how far it deviates for circular) of the planets at 0.0167, or 1.67%. Only Neptune (1%) and Venus (0.68%) are “more circular.”
The orbital eccentricity of the Earth also oscillates over a 413,000 year period between 5.8% (about the same as Saturn) down to 0.5%. We’re currently at the low end of the scale, just below the mean value of 2.8%.
Variation in eccentricity is also coupled with other factors, such as the change in axial obliquity the precession of the line of apsides and the equinoxes to result in what are known as Milankovitch cycles. These variations in extremes play a role in the riddle of climate over hundreds of thousands of years. Climate change deniers like to point out that there are large natural cycles in the records, and they’re right – but in the wrong direction. Note that looking solely at variations in the climate due to Milankovitch cycles, we should be in a cooling trend right now. Against this backdrop, the signal of anthropogenic climate forcing and global dimming of albedo (which also masks warming via cloud cover and reflectivity) becomes even more ominous.
Aphelion can presently fall between July 2nd at 20:00 UT (as it did last in 1960) and July 7th at 00:00 UT as it last did on 2007. The seemingly random variation is due to the position of the Earth with respect to the barycenter of the Earth-Moon system near the time of aphelion. The once every four year reset of the leap year (with the exception of the year 2000!) also plays a lesser role.
I love observing the Sun any time of year, as its face is constantly changing from day-to-day. There’s also no worrying about light pollution in the solar observing world, though we’ve noticed turbulence aloft (in the form of bad seeing) is an issue later in the day, especially in the summertime. The rotational axis of the Sun is also tipped by about 7.25° relative to the ecliptic, and will present its north pole at maximum tilt towards us on September 8th. And yes, it does seem strange to think in terms of “the north pole of the Sun…”
We’re also approaching the solar maximum through the 2013-2014 time frame, another reason to break out those solar scopes. This current Solar Cycle #24 has been off to a sputtering start, with the Sun active one week, and quiet the next. The last 2009 minimum was the quietest in a century, and there’s speculation that Cycle #25 may be missing all together.
And yes, the Moon also varies in its apparent size throughout its orbit as well, as hyped during last month’s perigee or Super Moon. Keep those posts handy- we’ve got one more Super Moon to endure this month on July 22nd. The New Moon on July 8th at 7:15UT/3:15 AM EDT will occur just 30 hours after apogee, and will hence be the “smallest New Moon” of 2013, with a lot less fanfare. Observers worldwide also have a shot at catching the slender crescent Moon on the evening of July 9th. This lunation and the sighting of the crescent Moon also marks the start of the month of Ramadan on the Muslim calendar.
Be sure to observe the aphelion Sun (with proper protection of course!) It would be uber-cool to see a stitched together animation of the Sun “growing & shrinking” from aphelion to perihelion and back. We could also use a hip Internet-ready meme for the perihelion & aphelion Sun- perhaps a “MiniSol?” A recent pun from Dr Marco Langbroek laid claim to the moniker of “#SuperSun;” in time for next January’s perihelion;

Could a new trend be afoot?
I took a pic in January 2013 of the perihelion Sun with my Canon Digital Rebel Xti and 70-300mm zoom lens and a Rainbow Symphony Solar Filter. I bought a new camera since then but still have the Xti and will get it out on Friday (probably will also take a pic with my 60D and another one in January so I have pics with my new camera as well).
Interesting info, David.
This tidbit of info fits well with my own personal observations of what’s really happening with Helios. What I can’t understand is why no one else has put it all together yet.
Let’s look at the simple, observable facts:
First and foremost, the greatest observable fact in my mind is the Sun’s position in our skies (Northern Hemisphere). Simply put, the Sun is about 25 degrees out of it’s “normal” rise and set points. Many people have posted videos on YouTube documenting this odd change.
Second observable change seems to be the “feel” of the sunlight on your skin. It’s much more intense than I’ve ever seen (or felt) before.
Third Observable change: The highest number of CMEs and highest number of X-class flares that hit the Earth directly. Without going into solar mechanics, these CMEs can be directly linked to much of Earths intense weather extremes like; 500+ tornadoes in less than a year in the US. The highest number of Earthquakes and Volcanic activity ever, in recorded history.
In March of 2008, Japan was shifted 8+ feet towards North America in one very violent (and deadly) earthquake. The week prior to that quake the Earth was hit by a series of 3 or 4 X-class+ CME events. No one seems to have caught this little fact. The relationship between Earthquakes and CME events can be tracked through history when the 2 events are compared side-by-side starting in March, 2008 and moving backwards in time a distinct correlation emerges. On average, three to seven days after a CME the number and intensity of quakes in the region where the CME actually impacts the planet’s surface can be observed (possible earthquake early warning systems could be built using this premise I’ve discovered). The time delay between the flare impact (Fi) and a notable quake activity increase (Qi) is due to the increased energy input from the Sun’s EM field strength spike. The Earths Core Spin Speed (Css) increases in direct response to the excess energy in Earths EM field. The effect is only temporary. Quake and Volcanic activity increase as a way to dispel the excess EM energy absorbed by Earths EM field from CME discharge that carries with it, highly energetic particles that usually make up our recently confirmed “Solar Wind”.
Well, that’s as short an explanation as I can give of my theory but, in this model, everything that has been deemed “never before seen” in our history can be explained by my theory.
Any thoughts?
You wrote:
“What I can’t understand is why no one else has put it all together yet.
Let’s look at the simple, observable facts:
First and foremost, the greatest observable fact in my mind is the Sun’s
position in our skies (Northern Hemisphere). Simply put, the Sun is
about 25 degrees out of it’s “normal” rise and set points. Many people
have posted videos on YouTube documenting this odd change.”
Thoughts:
This is a Bunch of B.S.
You’re saying: No one noticed that “the Sun is about 25 degrees out of it’s “normal” rise and set points” ?
The sun is clearly not off from it’s “normal” rise and set points… it’s exactly right on in my observations.
Youtube videos documenting this “odd change” fit right in with Chemtrails and Goblins.
The rest of your post wouldn’t stand up to any most basic peer review.
tinyurl.com/l3cselt