Is the Solar System Really a Vortex?

Is this really how the Solar System works? (Rendering by DjSadhu)

The short answer? No. Not in the way that a popular animated gif insinuates, at least.

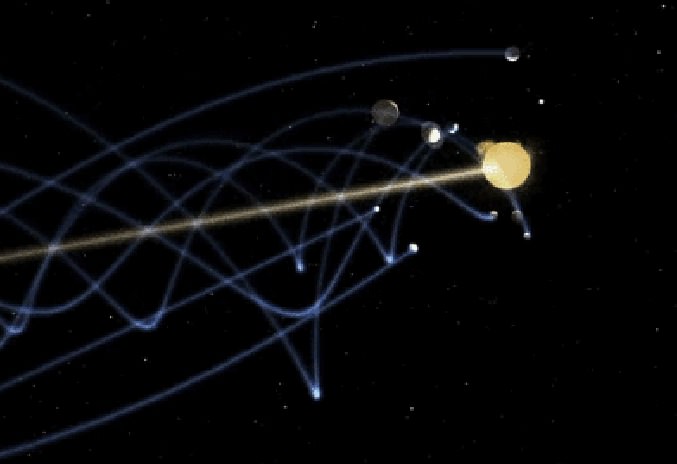
If you’re even a casual space fan you may have seen a viral gif animation showing our solar system traveling through space, the motions of the planets tracing corkscrew “vortex” paths around a line-driving Sun. While it’s definitely intriguing to watch (in that mesmerizingly-repetitive gif fashion) and rendered with a talented flair for design, there are two fundamental problems with it. One: it’s not entirely correct, scientifically, and two: its creator’s intention is to illustrate a decidedly un-scientific point of view about the Solar System and the Universe as a whole.

For the long answer, I now offer up the stage to astrophysicist Rhys Taylor, who recently posted an in-depth article describing why the planets do yet move… just not like that.

Reposted with permission from Rhys Taylor’s blog, Physicists (Formerly) of the Caribbean:

There’s this annoying space GIF roaming the internet causing trouble. Perhaps you’ve seen it. No ? Well, here it is.

Solar system "vortex" gif (by DjSadhu)
Solar system “vortex” gif (by DjSadhu)

What it purports to show is the motion of the Solar System through space. But the accuracy of this has been utterly derided as an affront to scientific dignity. Which is a shame, because the video version is really quite nicely done, with good camera movement and a catchy soundtrack. The principle antagonist is notorious “Bad Astronomer” Phil Plait, who wrote a convincing and virulent attack on the video. I decided to investigate for myself.

Like many people, I was at first glance really quite impressed with the video, and didn’t have any major objections to it. Obviously the orbits and size of the planets are not to scale (and I think their orbital speeds have be altered too), but that’s just to make them visible. Fair enough. But then I read Phil Plait’s analysis, and it seems that things are much, much worse than that. Says Plait :

“Sadhu shows the Sun leading the planets, ahead of them as it goes around the galaxy… This is not just misleading, it’s completely wrong.”

He clarifies :

Sometimes the planets really are ahead of the Sun as we orbit in the Milky Way, and sometimes trail behind it (depending on where they are in their orbit around the Sun).” [my italics]

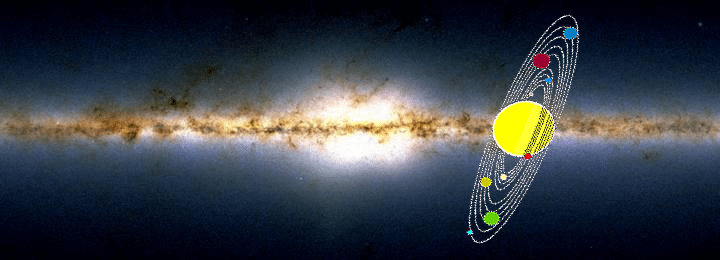
The orbits of the major planets of the solar system all lie in a narrow plane (like being in economy class! hahaha… sorry), which is tilted at about 60 degrees to the disc of stars that forms the Milky Way. Like this:

Credit : Science Minus Details

We’ll return to the tilt in a moment. But first, if the Sun was really leading the planets, then the thing is completely ludicrous (and this is quite a major part of Plait’s argument). Yet I’m not so sure the viral gif does show the Sun leading the planets. Having read through the author’s website, I can’t find any evidence that he suggests this. In fact, some of other videos on his website clearly show that this isn’t the case:

It seems to me that the appearance of the Sun leading the planets in the gif is just the result of a projection effect – i.e. that things can look different from different angles. On the other hand, Plait read the source material for Sadhu’s model, so maybe there’s something in there that’s more explicit. I’ve glanced at it, but couldn’t find anything stating this precisely. Actually I couldn’t find a whole lot that was even vaguely coherent, but we’ll return to this later. For now, just keep in mind that Sadhu is using an alternative model, even though that may not always be evident.

What the gif definitely does not show is the fact that the orbits of the planets are tilted at about 60 degrees to the direction of the Sun’s motion. Says Plait :

“In the helical model, he shows the planets as orbiting around the Sun perpendicular to the motion of the Sun around the galaxy; “face-on”, if you like.This is wrong. Because the orbits of the planets are tipped by 60°, not 90°, they can sometimes be ahead and sometimes behind the Sun. That right there, and all by itself, shows this helical depiction is incorrect.”

There can be no mistaking that Sadhu’s video shows the orbits with the wrong tilt. But is that so critical? Well actually no, not really. Fact is that if you include the tilt, you still see the planets making a “spiral” pattern (technically it’s a helix) as they move through space. The overall appearance just isn’t that massively different compared to a 90-degree tilt.

Solar system model by Rhys Taylor (Click to play)

So what’s the big deal? What does the author claim in this internet sensation that’s so outrageous? Well, not much. That particular video/gif are actually fairly inoffensive, to my mind. The most basic notion that the planets trace helical paths through space is perfectly correct. What honestly surprises me is that this is so incredibly popular on the internet. If you weren’t aware that the Sun orbits the center of the galaxy — which, since the planets orbit it, necessitates that they trace out helical paths — then the education system has seriously failed. But do not despair! This can be remedied very, very easily.

But we’re not done yet. There’s a sting in the tail, and it’s a big one. The gif doesn’t show it, but the video version ends with the worrying remarks that:

“Rotational motion and vortex motion are completely different things.”*
“Life spirals.” [Picture of leaves]
“Life is vortex, not just rotation.” [Picture of developing ferns, then a flower, the Milky Way, the DNA double helix, etc.]
“The Solar System is part of life. Think about this while racing through space.”

*Yes, they are. Plait notes: “They’re different in more than just name; they’re actually very different physical motions with different properties—you can get helical motion without the particles in it interacting, like in the solar system, but in a vortex the particles interact through drag and friction.” Basically, claiming that the Solar System is a vortex is simply wrong. Sadhu appears not to have checked the word “vortex” in a dictionary.

I could forgive even these rather hippyish sentiments, if they were no more than that. Alas, they’re symptomatic of a much larger problem. Plait’s merciless attack is full of sound and fury, but it’s also signifying something. Reading more of the author’s website, it turns out he is actively promoting quackery. It’s on a par with the excellent Space Mirror Mystery* (the idea that everything further away than about 150 million km is just a reflection in a giant mirror), but less funny.

*I was delighted to find that this website is back online. Seriously, read it. It’s epic.

From Sadhu’s website:

“In this diagram it seems the Solar System travel to the left. When the Earth is also traveling[sic] to the left (for half a year) it must go faster than the Sun. Then in the second half of the year, it travels in a ‘relative opposite direction’ so it must go slower than the Sun. Then, after completing one orbit, it must increase speed to overtake the Sun in half a year. And this would go for all the planets. Just like any point you draw on a frisbee will not have a constant speed, neither will any planet.”

Apparently he thinks this is a problem. Worryingly, it suggests that he didn’t show the 60-degree orbital tilt not for mere simplicity, but because he doesn’t believe it’s possible. Which — if true — is utter madness, pure and simple. There’s absolutely no reason the planetary speeds have to be constant as they move around the galaxy — the massive gravitational pull of the Sun is keeping them firmly in its orbit, regardless of how those orbits are inclined.

“Secondly, most planets are visible throughout the entire year. In a ‘flat’ model, every single planet would hide behind the Sun at least once a year. They don’t. Now the heliocentric model isn’t entirely flat, but mostly.”

Fine. The heliocentric model isn’t flat, which perfectly explains why planets aren’t eclipsed by the Sun once per year. What need to state this ? Is he really saying that this is a problem in a heliocentric model…? SERIOUSLY?

“Fact of the matter is that if the helical model is correct and our Solar System is a traveling[sic] vortex, it will change how we feel about our journey. For me personally the heliocentric model feels like a useless marry[sic]-go-round: after one year we are back to square one. The helical model feels much more like progress, growth, a journey through space in which we never ever come back to our starting point. We are NOT in a big marry[sic]-go-round. We are on a journey.”

Planets trace a helical path in space because our Solar System is orbiting the center of the galaxy. Big bloody deal. It’s that simple. You don’t need a wacky alternative model of the Solar System for this – it’s happening anyway! As for going on a journey though – well no, not really. Every other star is also orbiting the center of the galaxy, so no, we’re not actually getting anywhere relative to other star systems.

Then there are some pointless ravings about the Mayan calendar.

He also links the following video. Skip to about 2 minutes in:

This has the bizarre quote that :

“The planets do not come back on to their [own] path[s]. They don’t. If they did, we most likely would have the same set of information over and over and over… like a broken record. And we’d probably get bored. It would be like Groundhog Year.”

Then he links a video claiming that the Fibonacci sequence is the fingerprint of God.

None of which changes the fact that his first video/gif has only minor inaccuracies, but at this point I can’t help feeling that this was more by luck than judgement.

Then there’s his second video. This one is more objectively just plain wrong. He shows the Sun tracing out a corkscrew pattern as it orbits the galaxy, which makes no sense. The Sun simply goes around the center of the galaxy (and up and down a little bit) — nothing else. It’s not orbiting anything else at the same time. For it to trace a helix is just nonsense. He seems to have an almost unique case of helix madness.

What of the source material — the alternative model Sadhu uses? Garbage. Utter garbage. I find it difficult to read more than a sentence or two, because it’s verging on incomprehensible. As in almost at the level of TimeCube.

“Three types of time may be recognized:
– An absolute time that is universal and has neither a known starting point nor an end point; not even limited to a measurable parameter.
– For living organisms there is a time for birth and a moment for death. The interval is the life span. This time may be measured with parameters like seconds, minutes, days and so on. Mechanical devices may measure fractions and to some extant reliable. In every case some kind of energy source or gear system is involved.
-–When one is engaged with some work involvement in another activity may be impossible or result to be unnatural. In such cases personal values decide what course to take up and say “no time” to the other work, however important that may be. This time is highly subjective.”

Later:
“The constellations at the background are sufficient evidence to deny the heliocentric orbits for planets. The Sun at 500 light seconds distance, when visible within a cone of 30° maintaining a background of one constellation, say for example Aries, (Hamel at 68ly) the SOLSTICES and EQUINOXES through Zodiac Earth maintains in the opposite constellation at midnight, namely Libra. After six months to maintain heliocentric orbit, the mid day of today should become midnight and the midnight should become midday. This has not taken place!

Well of course it hasn’t — it’s complete gibberish ! Plait may well be right that somewhere in this mess is a model wherein the Sun leads the planets, but I don’t have the time or sheer mental fortitude to read the whole thing. I will note, though, that there’s a paragraph where the author rubbishes the conventional explanation for the ozone hole — and God help us all if that goes viral. That, not petty disputes about whether the orbits of planets are tilted by 60 or 90 degrees, is why such quackery deserves to be shot down without mercy.

“My feeling is that if your take-home message was only that the Solar System moves through space, and the planets trace out pretty spirally paths, then all is well and no harm done. But if it’s leading you to question the heliocentric model, then we’re all buggered.”

–Rhys Taylor, astrophysicist

In conclusion then, the first video and gif of the Solar System as a “vortex” are not really all that bad. Unfortunately, the inaccuracies are not due to some minor over-simplifications, but are symptoms of a some very deep-seated misunderstandings. My feeling is that if your take-home message was only that the Solar System moves through space, and the planets trace out pretty spirally paths, then all is well and no harm done. But if it’s leading you to question the heliocentric model, then we’re all buggered.

___________________

Thanks to Rhys Taylor for the guest post of his entertaining and informative article — at the very least, you got to watch “The Galaxy Song” again! Read more from Rhys (and check out some really nice infographics too) on his blog here.

A New Look at Saturn’s Northern Hexagon

Raw Cassini image captured on 26 Feb. 2013 (NASA/JPL/SSI)

Freshly delivered from Cassini’s wide-angle camera, this raw image gives us another look at Saturn’s north pole and the curious hexagon-shaped jet stream that encircles it, as well as the spiraling vortex of clouds at its center.

Back in November we got our first good look at Saturn’s north pole in years, now that Cassini’s orbit is once again taking it high over the ringplane. With spring progressing on Saturn’s northern hemisphere the upper latitudes are getting more and more sunlight — which stirs up storm activity in its atmosphere.

The bright tops of upper-level storm clouds speckle Saturn’s skies, and a large circular cyclone can be seen near the north pole, within the darker region contained by the hexagonal jet stream. This could be a long-lived storm, as it also seems to be in the images captured on November 27.

About 25,000 km (15,500 miles) across, Saturn’s hexagon is wide enough to fit nearly four Earths inside!

The Saturn hexagon as seen by Voyager 1 in 1980 (NASA)

The hexagon was originally discovered in images taken by the Voyager spacecraft in the early 1980s. It encircles Saturn at about 77 degrees north latitude and is estimated to whip around the planet at speeds of 354 km/h (220 mph.)

Watch a video of the hexagon in motion here.

The rings can be seen in the background fading into the shadow cast by the planet itself. A slight bit of ringshine brightens Saturn’s nighttime limb.

Cassini was approximately 579,653 kilometers (360,180 miles) from Saturn when the raw image above (W00079643) was taken.

Image credit: NASA/JPL/Space Science Institute


Incredible Raw Image of Saturn’s Swirling North Pole

Ok, are you ready for this?

I know… WOW.

This swirling maelstrom of clouds is what was seen over Saturn’s north pole earlier today, November 27, by NASA’s Cassini spacecraft. This is a raw image, acquired in polarized light, from a distance of 238,045 miles (383,097 kilometers)… all I did was remove some of the hot pixels that are commonly found on Cassini images taken with longer exposures.

Again… WOW.

My attempt at a color composite can be seen below, plus another treat:

It’s rough, and a little muddy because the clouds were moving between image channels (not to mention the blue channel image was rather underexposed) but here’s a color-composite of the same feature, made from images taken from a slightly different perspective:

Color composite of Saturn’s north polar vortex

Pretty darn cool… Cassini does it yet again!

The images above show an approximately 3,000-4,000-km-wide cyclone above Saturn’s north pole. Saturn is also known to have a long-lived hexagonal jet stream feature around its north pole as well, but that is not shown in those images as it runs along a lower latitude. Instead, you can see that HERE:

Saturn’s northern hexagon

Captured with a wider angle, in this image the hexagon structure can be made out as well as the cyclone, which sits at the center just over the pole. Saturn’s hexagon is about 25,000 km (15,500 miles) in diameter… large enough to fit almost four Earths inside. This image was also acquired today.

An RGB composite of this feature is below:

Saturn’s northern hexagon – color composite

It’s been a few years since we’ve gotten such a good look at Saturn’s north pole… thanks to Cassini’s new orbital trajectory, which is taking it high above the ring plane and poles of Saturn, we now have the opportunity to view the gas giant’s dynamic upper latitudes again. I’m sure this is just a taste of what’s to come!

(Image credit: NASA/JPL/Space Science Institute. Color composites by Jason Major)

Pictures From T-86: Cassini’s Latest Flyby of Titan

On September 26-27 Cassini executed its latest flyby of Titan, T-86, coming within 594 miles (956 km) of the cloud-covered moon in order to measure the effects of the Sun’s energy on its dense atmosphere and determine its variations at different altitudes.

The image above was captured as Cassini approached Titan from its night side, traveling about 13,000 mph (5.9 km/s). It’s a color-composite made from three separate raw images acquired in red, green and blue visible light filters.

Titan’s upper-level hydrocarbon haze is easily visible as a blue-green “shell” above its orange-colored clouds.

Cassini captured this image as it approached Titan’s sunlit limb, grabbing a better view of the upper haze. Some banding can be seen in its highest reaches.

The haze is the result of UV light from the Sun breaking down nitrogen and methane in Titan’s atmosphere, forming hydrocarbons that rise up and collect at altitudes of 300-400 kilometers. The sea-green coloration is a denser photochemical layer that extends upwards from about 200 km altitude.

In this image, made from data acquired on Sept. 27, Titan’s south polar vortex can be made out just within the southern terminator. The vortex is a relatively new feature in Titan’s atmosphere, first spotted earlier this year. It’s thought that it’s a region of open-cell convection forming above the moon’s pole, a result of the approach of winter to Titan’s southern half.

Read: Cassini Spots Surprising Swirls Above Titan’s South Pole

This T-86 flyby was was one of a handful of opportunities to profile Titan’s ionosphere from the outermost edge of Titan’s atmosphere. In addition Cassini was able to look for any changes to Ligeia Mare, a methane lake last observed in spring of 2007.

Now that Titan has been under scrutiny for a full year of Saturn’s seasons — which lasts 29.7 Earth-years — astronomers now know that varying amounts of solar radiation can drastically change situations both within Saturn’s atmosphere and on its surface.

“As with Earth, conditions on Titan change with its seasons. We can see differences in atmospheric temperatures, chemical composition and circulation patterns, especially at the poles,” said Dr. Athena Coustenis from the Paris-Meudon Observatory in France. “For example, hydrocarbon lakes form around the north polar region during winter due to colder temperatures and condensation. Also, a haze layer surrounding Titan at the northern pole is significantly reduced during the equinox because of the atmospheric circulation patterns. This is all very surprising because we didn’t expect to find any such rapid changes, especially in the deeper layers of the atmosphere.”

“It’s amazing to think that the Sun still dominates over other energy sources even as far out as Titan, over 1.5 billion kilometres from us.”
– Dr. Athena Coustenis, Paris-Meudon Observatory

The image above, acquired on Sept. 28, was added to this post on Oct. 1. It was taken from a distance of  649,825 miles (1,045,792 kilometers.)

Cassini’s next targeted approach to Titan — T-87 — will occur on November 13.

Get more news from the Cassini mission here.

Image credits: NASA/JPL/Space Science Institute. All color composites by Jason Major. Images have not been validated or calibrated by the SSI team.


(Do you love the Cassini mission as much as we do? Vote on your favorite Cassini “Shining Moment” here, in honor of the 15th anniversary of Cassini’s launch on October 15! Amazing to think it’s already been 15 years — 8 of those in orbit around Saturn!)

Surprising Swirls Above Titan’s South Pole

View of Titan's South Pole, showing a vortex. Credit: NASA

Thanks to Cassini’s new vantage point granted by its inclined orbit researchers have gotten a new look at the south pole of Titan, Saturn’s largest moon. What they’ve recently discovered is a swirling vortex of gas forming over the moon’s pole, likely the result of the approach of winter on Titan’s southern hemisphere.

What we’re seeing here is thought to be an open cell convection process in Titan’s upper atmosphere. In open cells, air sinks in the center of the cell and rises at the edge, forming clouds at cell edges. However, because the scientists can’t see the layer underneath the layer visible in these new images, they don’t know what other mechanisms may be at work.

A stable atmospheric event that’s found here on Earth as well, open cell convection can be compared to the action of boiling water.

Titan has already been seen to have a thicker area of high-altitude haze over its north pole, and as autumn progresses toward winter in Titan’s south during the course of Saturn’s 29.7-year-long orbit this may very well be the beginnings of a southern polar hood.

An animation of this southern vortex can be found here.

“We suspect that this maelstrom, clearly forming now over the south pole and spinning more than forty times faster than the moon’s solid body, may be a harbinger of what will ultimately become a south polar hood as autumn there turns to winter.  Of course, only time will tell.”

– Carolyn Porco, Cassini Imaging Team Leader

Discoveries like this are prime examples of why it was so important for Cassini to have an extended, long-duration mission around Saturn, so that seasonal changes in the planet and moons could be closely observed. New seasons bring new surprises!

The southern vortex structure was also captured in raw images acquired by Cassini on June 28. A color-composite made from three of those raw images is below (the vortex can be seen at center just right of the terminator):

You can find more images from Cassini on the CICLOPS Imaging Team site.

Image credits: NASA/JPL/Space Science Institute. Bottom RGB composite by Jason Major.

Pacific Glory

An optical phenomenon known as a “glory” is seen over a cloud-covered Pacific Ocean in this image from NASA’s Aqua satellite, acquired on June 20, 2012. Although the colors may make it look like a rainbow, the process behind its formation is somewhat different.

As vortices spiral off the leeward side of Guadalupe Island, off the western coast of Baja California, a shimmering spectrum of colors highlights a glory just west of the island. Glories are created when light from the Sun reflects back toward an observer off water droplets within clouds or fog. They are often seen from airplanes as a bright ring of light encircling a silhouetted shadow of the aircraft below, but are also visible from the ground and, sometimes, even from space.

From the NASA Earth Observatory website:

Although glories may look similar to rainbows, the way light is scattered to produce them is different. Rainbows are formed by refraction and reflection; glories are formed by backward diffraction. The most vivid glories form when an observer looks down on thin clouds with droplets that are between 10 and 30 microns in diameter. The brightest and most colorful glories also form when droplets are roughly the same size.

From the ground or an airplane, glories appear as circular rings of color. The space shuttle Columbia observed a circular glory from space in 2003. In the image above, however, the glory does not appear circular. That’s because MODIS scans the Earth’s surface in swaths perpendicular to the path followed by the satellite. And since the swaths show horizontal cross sections through the rings of the glory, the glory here appears as two elongated bands of color that run parallel to the path of the satellite, rather than a full circle.

Glories always appear around the spot directly opposite the Sun, from the perspective of the viewer. This spot is called the anti-solar point. To visualize this, imagine a line connecting the Sun, a viewer, and the spot where the glory appears. In this case, the anti-solar point falls about halfway between the two colored lines of the glory.

Click here to download the full-size image.

NASA image courtesy Jeff Schmaltz, LANCE MODIS Rapid Response. Read more here.

New Research Finds Venus’ Winds, They Are A-Changin’

Image of Venus in ultraviolet light by ESA's Venus Express.


[/caption]

Venus, Earth’s hotheaded neighbor, may have more variability in its weather patterns than previously believed. Using infrared data obtained by ground-based telescopes in Hawaii and Arizona researchers have found that Venus’ mesosphere and thermosphere are less consistent in temperature than layers closer to its surface.

But first let’s talk about Venus itself.

Possibly the most inhospitable of planets in our solar system, Venus is the victim of a runaway greenhouse effect. Our neighboring world is a virtual oven… with a rocky surface baked by 800ºF temperatures and crushed beneath the weight of its own incredibly dense atmosphere, standing “sea level” on Venus would be like being 3,300 feet underwater, just in terms of pressure per square inch. And as if the heat and pressure weren’t enough, Venus’ skies are full of clouds made of corrosive sulphuric acid, lit by bolts of lightning and and whipped along by hurricane-force planetwide winds. All Earth-based probes that have ever landed there only lasted moments on the surface before succumbing to Venus’ destructive environment.

Venus is, quite literally, hellish.

Venus' south polar vortex imaged in infrared. A darker region corresponds to higher temperature and thus lower altitude. Credit: ESA/VIRTIS/INAF-IASF/Obs. de Paris-LESIA.

Unlike Earth, Venus does not have much of an axial tilt. This means there’s little, if any, seasonal variation on Venus. (Actually it does have a tilt… Venus is rotated almost completely upside-down relative to its poles, and so in effect still has very little axial tilt.) And since its cloud cover is so dense and it lacks a hydrologic cycle to move heat energy around, it pretty much stays at a constant level of “extreme broil” all across Venus’ surface.

Surface weather on Venus, although unpleasant, is consistent.

Yet based on an international team’s new research this is not the case higher up in Venus’ atmosphere. A new look at old data has uncovered changing weather patterns visible in infrared light at about 68 miles (110 kilometers) above the planet’s surface in the cold, clear air above the acid clouds.

“Any variability in the weather on Venus is noteworthy, because the planet has so many features to keep atmospheric conditions the same,” said Dr. Tim Livengood, a researcher with the National Center for Earth and Space Science Education and the University of Maryland, now stationed at NASA’s Goddard Space Flight Center in Greenbelt.

Dr. Theodor Kostiuk of NASA Goddard explains further: “Although the air over the polar regions in these upper atmospheric layers on Venus was colder than the air over the equator in most measurements, occasionally it appeared to be warmer. In Earth’s atmosphere, a circulation pattern called a ‘Hadley cell’ occurs when warm air rises over the equator and flows toward the poles, where it cools and sinks. Since the atmosphere is denser closer to the surface, the descending air gets compressed and warms the upper atmosphere over Earth’s poles. We saw the opposite on Venus.”

Many factors could be contributing to Venus’ upper-atmospheric variabilities, such as interactions between opposing winds blowing around the planet at over 200 mph, giant vortexes that churn around its poles, and possibly even solar activity, like solar storms and coronal mass ejections which may create turbulence in Venus’ upper atmosphere.

“The mesosphere and thermosphere of Venus are dynamically active. Wind patterns resulting from solar heating and east to west zonal winds compete, possibly resulting in altered local temperatures and their variability over time.”

– Lead author Dr. Guido Sonnabend, University of Cologne, Germany

Artist concept of Venus' surface. (NASA)

The team also found that the temperatures of Venus’ atmosphere change over time, spanning weeks, months, years… even decades. Temperatures measured in 1990-91 are warmer than in 2009, and equatorial temperatures were even warmer in 2007.

“In addition to all these changes, we saw warmer temperatures than those predicted for this altitude by the leading accepted model,” said Kostiuk. “This tells us that we have lots of work to do updating our upper atmospheric circulation model for Venus.”

Even though Venus is compositionally similar to Earth and has a similar size as well, at some point in its history it lost all of its water to space and became the cloud-covered oven it is today. Studying Venus will help scientists learn how this may have happened and – hopefully! –  learn how to prevent the same fate from ever befalling Earth.

The paper, led by Dr. Guido Sonnabend of the University of Cologne, Germany and co-authored by Drs. Livengood and Kostiuk, appeared July 23 in the online edition of the journal Icarus.

Read more on the NASA feature article here.

A Varying Venusian Vortex

Animation of Venus' southern polar vortex made from VIRTIS thermal infrared images; white is cooler clouds at higher altitudes.

Our neighboring planet Venus really is a world of extremes; searing surface temperatures, crushing air pressure, sulfuric acid clouds…Venus pretty much pushes the envelope on every aspect of rocky-planet existence. And now here’s one more thing that made scientists do a double-take: a shape-shifting vortex swirling around Venus’ south pole!

The presence of a cyclonic storm around Venus’ poles – both north and south –  has been known since Mariner 10’s pass in 1974 and then afterwards during the Pioneer Venus mission when a downwardly-spiraling formation of clouds over the planet’s north pole was imaged in infrared. It wasn’t until ESA’s Venus Express orbiter arrived in 2006 that the cyclone at the south pole was directly observed via the Visible and Infrared Thermal Imaging Spectrometer (VIRTIS) instrument…and it proved to be much stranger than anything previously expected. Continue reading “A Varying Venusian Vortex”