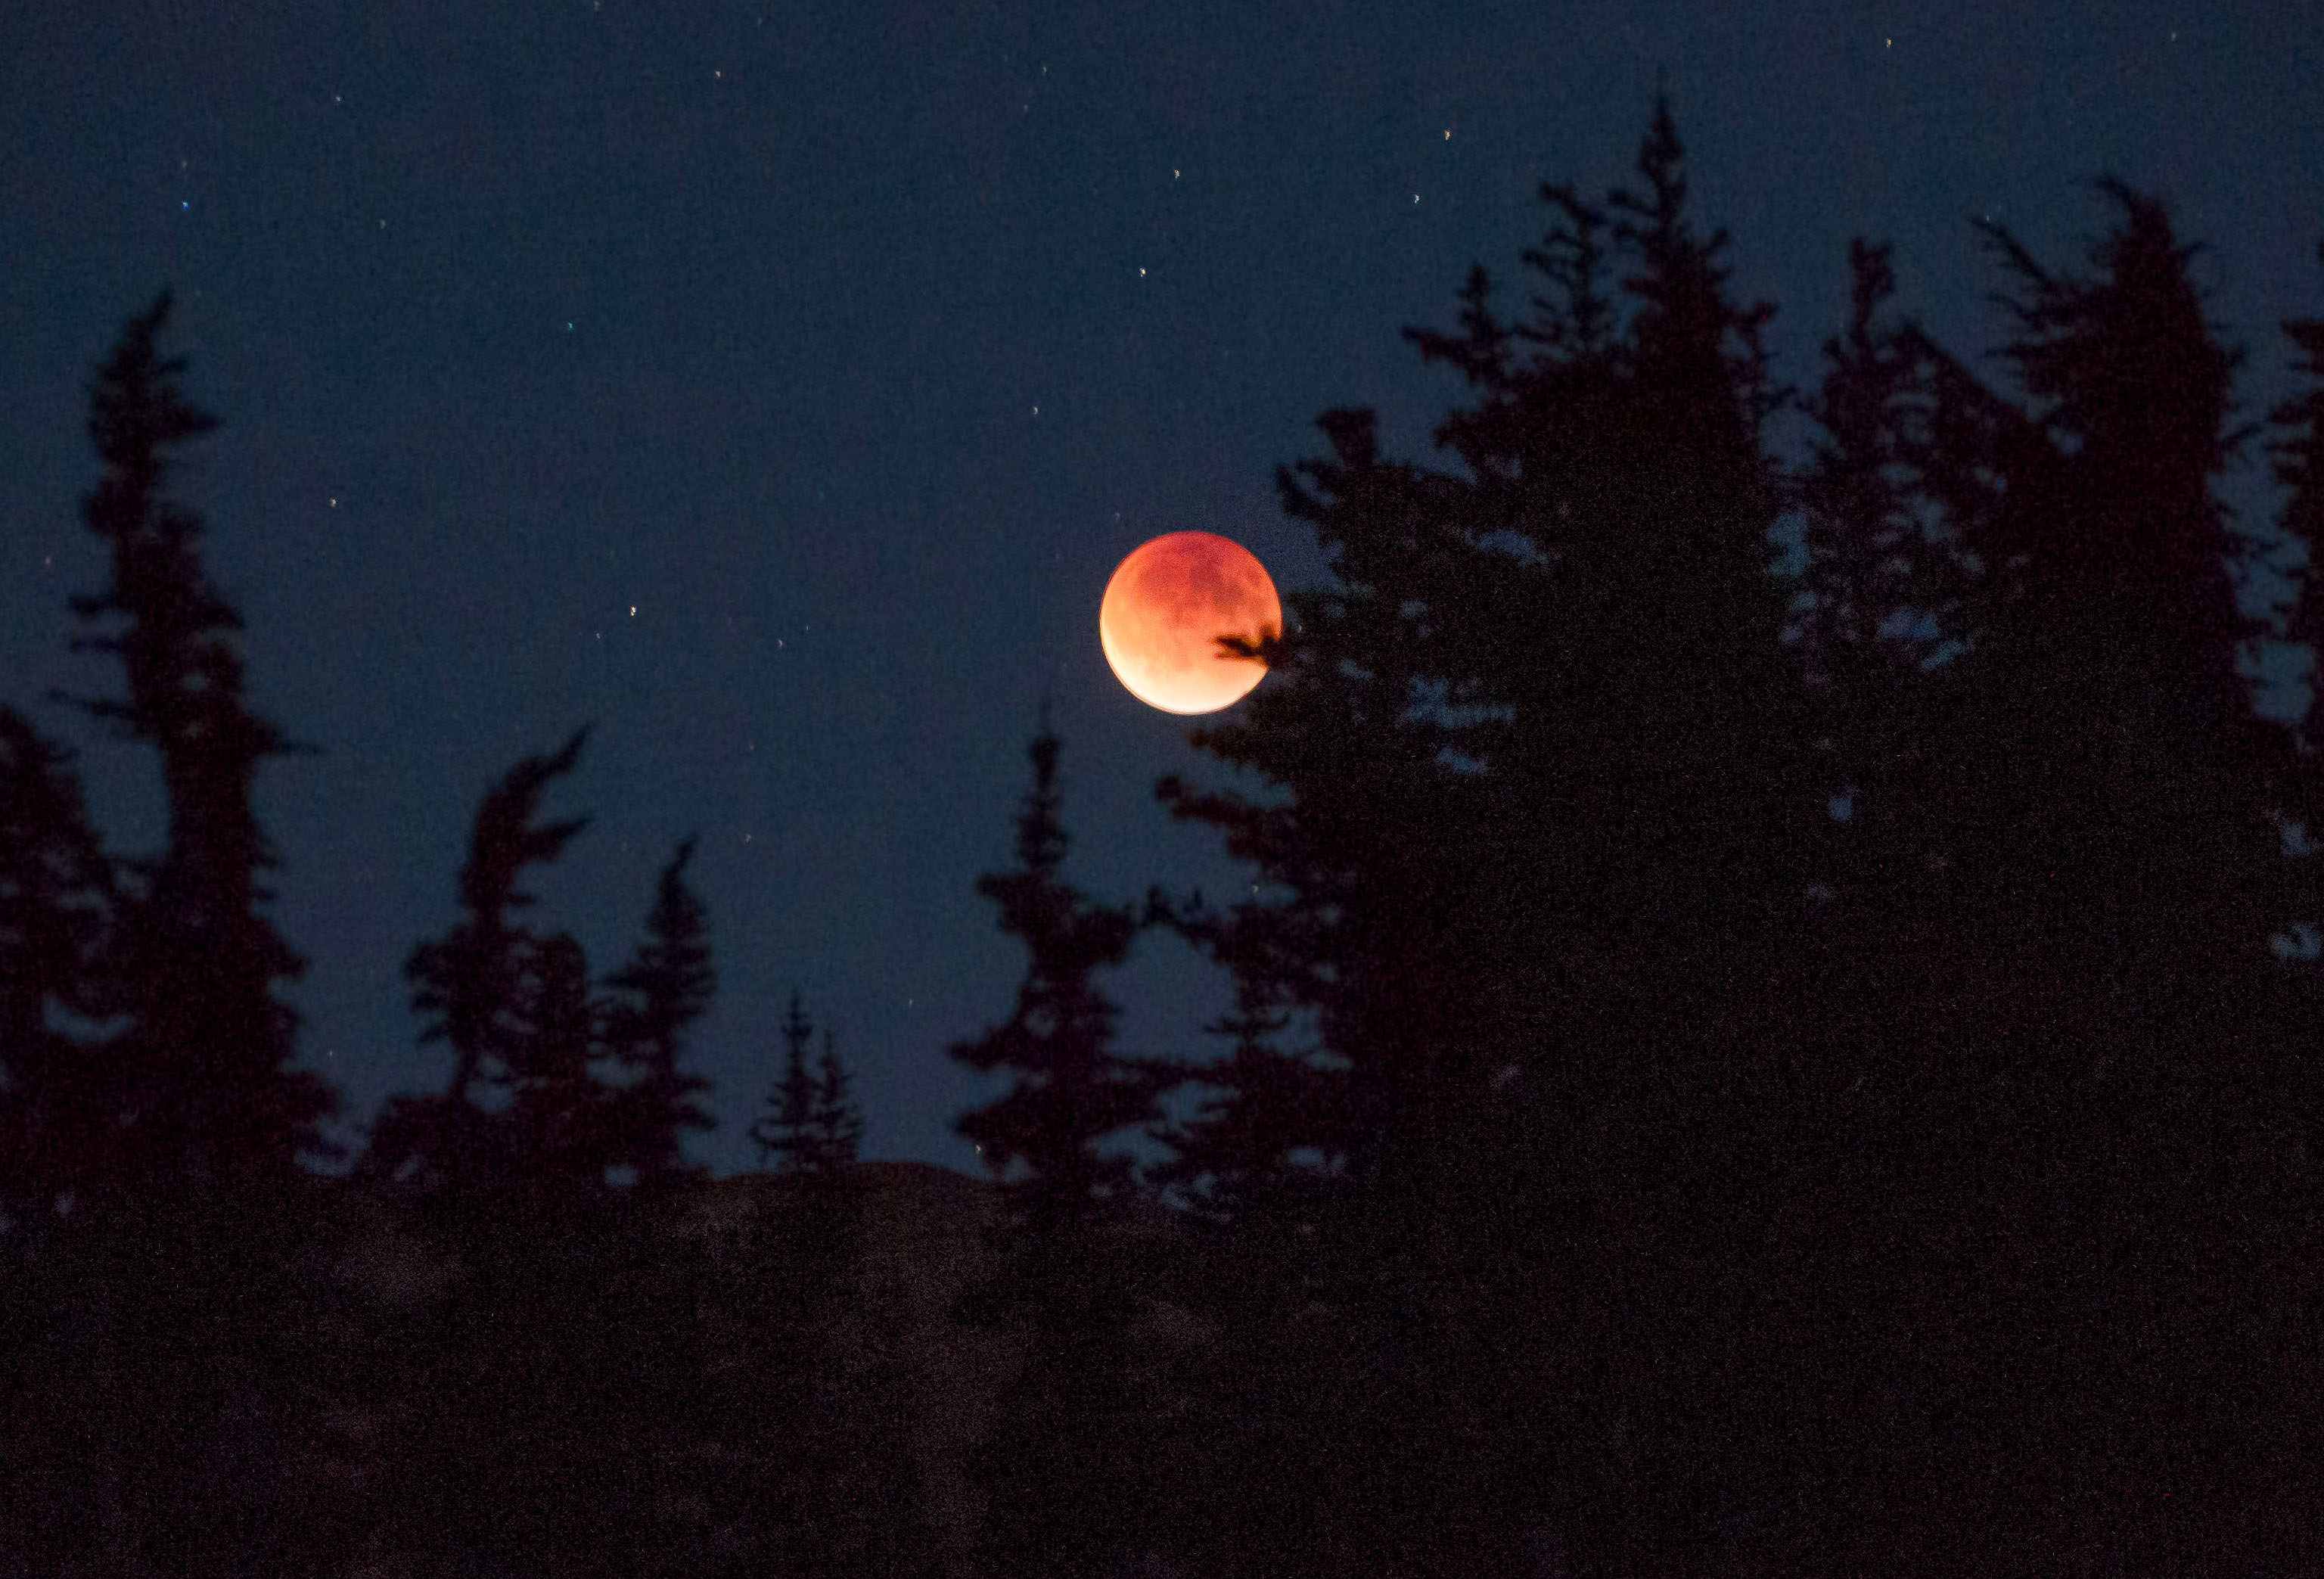
The September 17, 2015 total lunar eclipse - the last of the recent tetrad of lunar eclipses over the past 17 months - was darker than expected. Several factors described below were in play. This photo was taken in Washington's Olympic National Park. Credit: Rick Klawitter
First off, a huge thank you to everyone who made and sent their Danjon scale estimate of the totally-eclipsed Moon’s brightness to Dr. Richard Keen, University of Colorado atmospheric scientist. Your data were crucial to his study of how aerosols in Earth’s atmosphere and other factors influence the Moon’s appearance.
Grateful for your help, Keen received a total of 28 observations from 7 different countries.
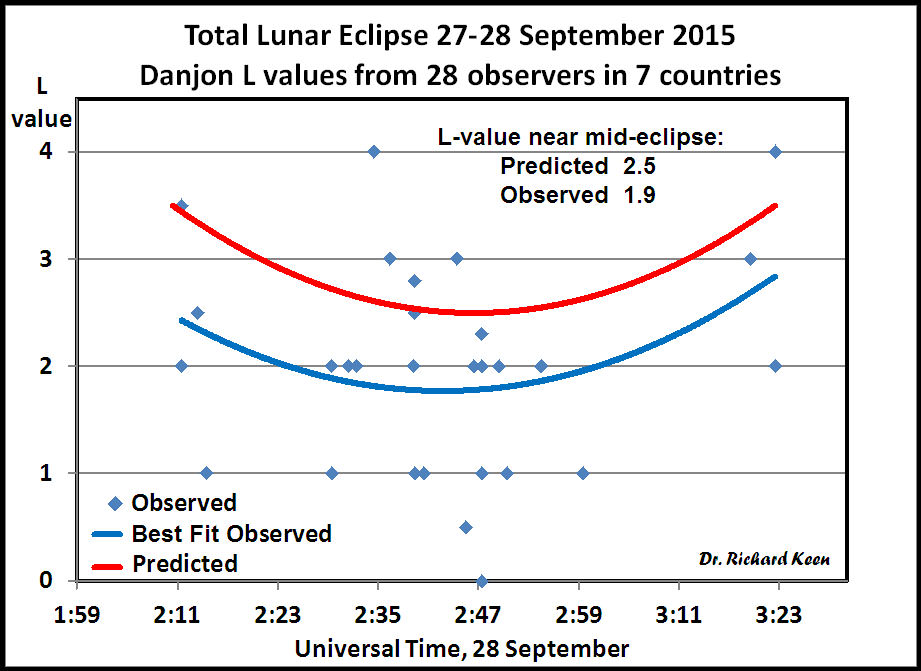
Graph created by Dr. Richard Keen plotting Danjon L values submitted by Universe Today readers and others that compare predicted values (top curve) with observed values. The Moon was about half as bright during totality as expected with L=1.9. Credit: Dr. Richard A. Keen
Using the Danjon information and estimates of the Moon’s brightness using the reverse binocular method, Keen crunched the data and concluded that the Moon was about 0.6 L (Danjon) units darker than expected and 0.4 magnitude dimmer, a brightness reduction of 33%. This agrees well with my own observation and possibly yours, too. No wonder so many stars sparkled near the Moon that night.
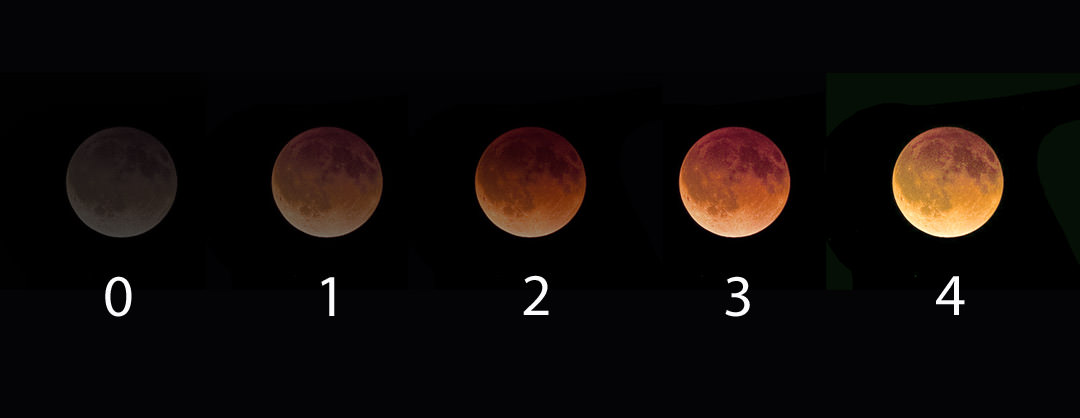
Lunar eclipse brightness is rated on the Danjon scale where “0” equals a dark gray totality and “4” a bright, coppery yellow. Credit: Bob King
I think it’s safe to say, most of us expected a normal or even bright totality. So why was it dark? Several factors were at play — one to do with the Moon’s location in Earth’s shadow, the other with a volcanic eruption and a third with long-term, manmade pollution.
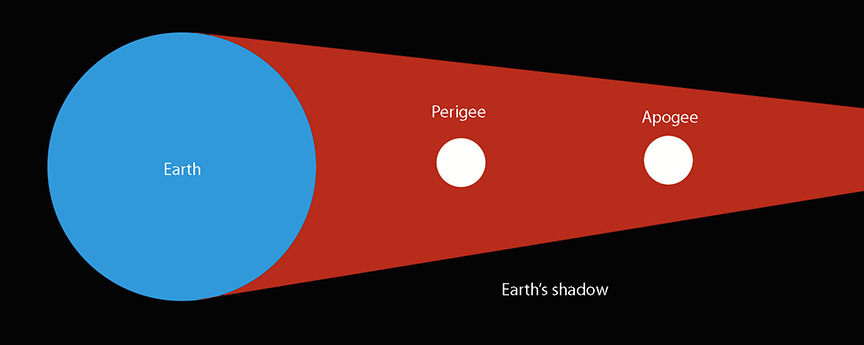
During a perigean eclipse, the Moon passes more deeply into Earth’s shadow compared to one that happens near apogee, when the moon is most distant from Earth. Moon distances not to scale and for illustration only. Credit: Bob King
You’ll recall that the eclipse occurred during lunar perigee, when the Moon swings closest to Earth in its 27-day orbit. Being closer, it also tracked deeper into Earth’s umbra or inner shadow which narrows the farther back of the planet it goes. An apogean Moon (farthest from Earth) passes through a more tapered cone of darkness closer to the penumbra, where sunlight mixes with shadow. A Moon nearer Earth would find the umbral shadow roomier with the light-leaking penumbra further off in the distance.
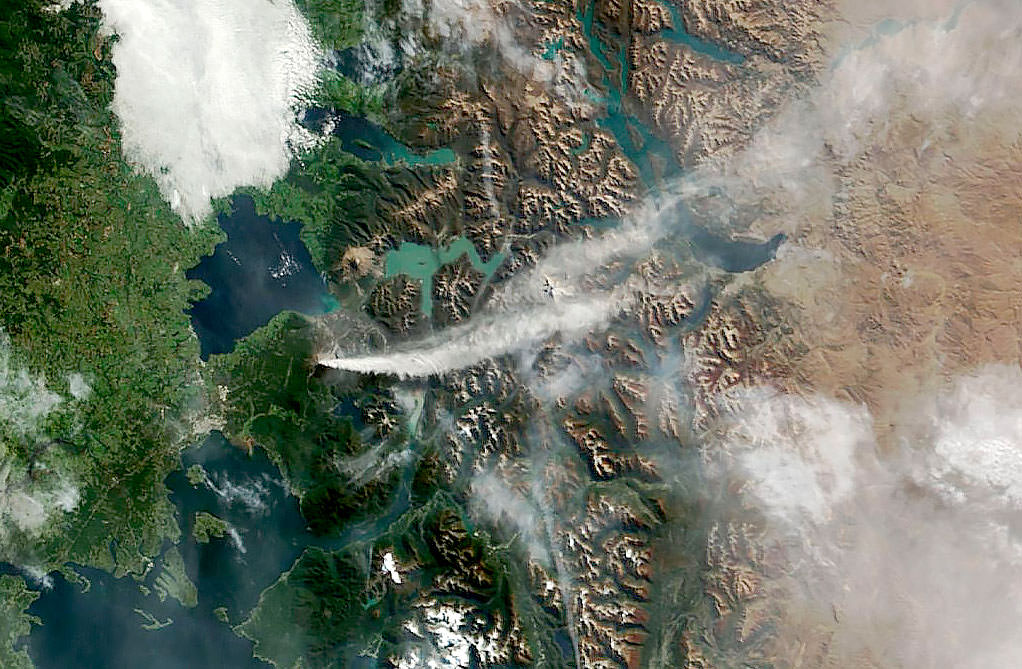
On April 24, 2015, NASA’s Terra satellite acquired this photo of the ash and gas plume from Calbuco volcano in southern Chile. Credit: NASA
But there’s more. Working independently, Steve Albersof NOAA and Brazilian astronomer Helio Vital suggested another reason: aerosols in the atmosphere. “Earth’s stratosphere is no longer completely clean of volcanic ashes,” said Vital in an e-mail communication. “In fact, lingering aerosols (ash, dust, sulfuric acid droplets) from the explosion of Calbuco five months ago may be to blame for that excessive darkening.”
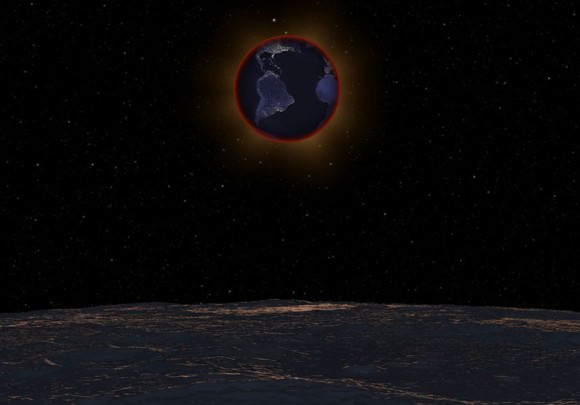
With the lunar horizon in the foreground, the Earth passes in front of the Sun on September 27, 2015 in this simulation, revealing the red ring of sunrises and sunsets along the limb of the planet responsible for illuminating the Moon during the eclipse. The clarity of the stratosphere at eclipse time can greatly affect lunar brightness during totality. The Earth and Sun are in Virgo for observers on the Moon with the bright star Beta Virginis at top. Click to see the video. Credit: NASA’s Scientific Visualization Studio
While much of the debris blasted into the stratosphere made for colorful sunsets in the southern hemisphere, some of that material has likely made its way to the northern hemisphere. Albers has noticed an increase in yellow and purple sunsets in his home town of Boulder in recent months, telltale signs of volcanic spew at play.
Forest fires that raged across the western states and Canadian provinces all spring and summer may also have contributed. Most of that smoke usually stays in the lower part of the atmosphere, but some may have found its way to the stratosphere, the very layer responsible for transmitting most of the sunlight that falls into Earth’s shadow and colors the moon.
Graph showing magnitude estimates of the Moon’s brightness during totality using the reverse binocular method. The predicted magnitude was -1.7 (a little brighter than Sirius) vs. the observed -1.3. Credit: Dr. Richard A. Keen
Sunlight has to pass through these light-absorbing minerals and chemicals on its way through the atmosphere and into Earth’s shadow. Less light means a darker moon during total eclipse. Coincidentally, much of the totally eclipsed Moon passed through the southern half of the umbra which “increased the effectiveness of the Calbuco aerosols (which are still more concentrated in the southern hemisphere than the northern) at dimming the light within the umbra,” writes Keen.
Oceanus Procellarum and Mare Imbrium are large, dark volcanic plains that contributed to the Moon’s faintness and dark-hued totality. Credit: Bob King
It also so happened that the darkest part of the moon coincided with two vast, dark volcanic plains called Oceanus Procellarum (Ocean of Storms) and Mare Imbrium, artificially enhancing the overall gloom over the northern half of the Moon.
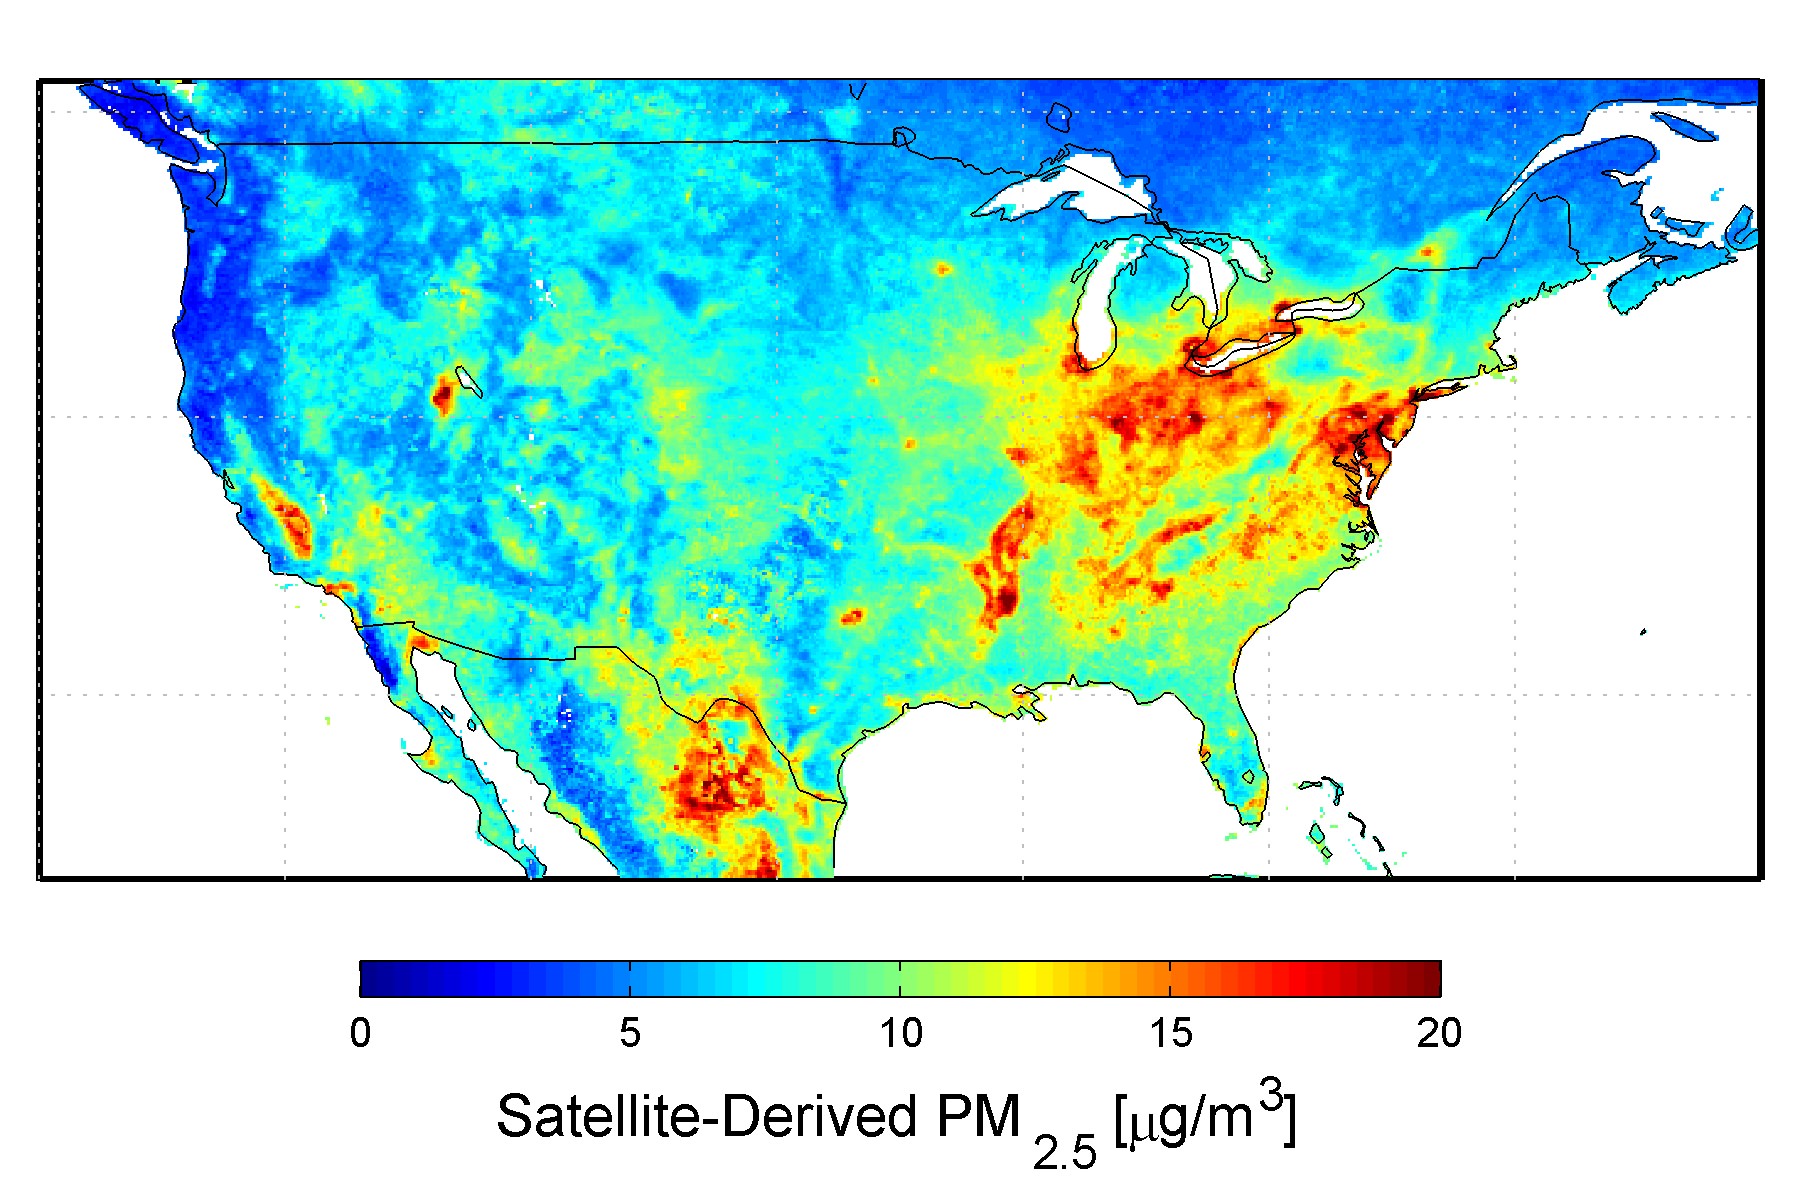
U.S. satellite-derived map of PM2.5 (fine particulate matter which includes sulfates and soot) averaged over 2001-2006. Credit: Dalhousie University, Aaron van Donkelaar
Finally, the human hand may also have played a role in lunar color and brightness. The burning of coal and oil has caused a gradual increase in the amount of human-made sulfate aerosols in the atmosphere since the start of the industrial revolution. According to NASA, at current production levels, human-made sulfate aerosols are believed to outweigh the naturally produced sulfate aerosols. No surprise that the concentration of aerosols is highest in the northern hemisphere where most industrial activity is found.
Isn’t it fascinating that one blood-red Moon can tell us so much about the air we breathe? Thank you again for your participation!
Depending on how clear the atmosphere is, the Moon's color can vary dramatically from one eclipse to another. The numbers, called the Danjon Scale, will help you estimate the color of Sunday night's eclipse. Credit: Bob King
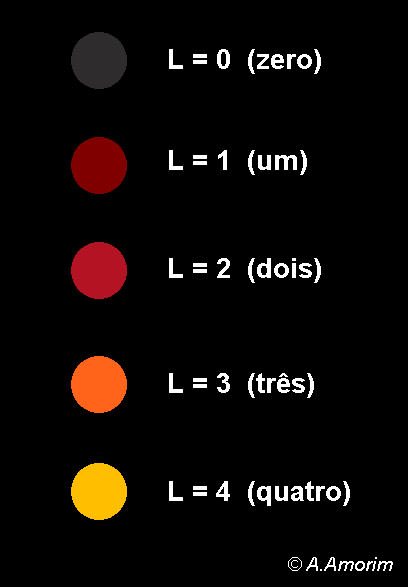
There are many ways to enjoy tomorrow night’s total lunar eclipse. First and foremost is to sit back and take in the slow splendor of the Moon entering and exiting Earth’s colorful shadow. You can also make pictures, observe it in a telescope or participate in a fun science project by eyeballing the Moon’s brightness and color. French astronomer Andre Danjon came up with a five-point scale back in the 1920s to characterize the appearance of the Moon during totality. The Danjon Scale couldn’t be simpler with just five “L values” from 0 to 4:
L=0: Very dark eclipse. Moon almost invisible, especially at mid-totality.
L=1: Dark Eclipse, gray or brownish in coloration. Details distinguishable only with difficulty.
L=2: Deep red or rust-colored eclipse. Very dark central shadow, while outer edge of umbra is relatively bright.
L=3: Brick-red eclipse. Umbral shadow usually has a bright or yellow rim.
L=4: Very bright copper-red or orange eclipse. Umbral shadow has a bluish, very bright rim.
The Danjon Scale is used to estimate the color of the totally eclipsed moon. By making your own estimate, you can contribute to atmospheric and climate change science. Credit: Alexandre Amorim
The last few lunar eclipses have been bright with L values of 2 and 3. We won’t know how bright totality will be during the September 27-28 eclipse until we get there, but chances are it will be on the bright side. That’s where you come in. Brazilian amateur astronomers Alexandre Amorim and Helio Carvalho have worked together to create a downloadable Danjonmeterto make your own estimate. Just click the link with your cellphone or other device and it will instantly pop up on your screen.
On the night of the eclipse, hold the phone right up next to the moon during mid-eclipse and estimate its “L” value with your naked eye. Send that number and time of observation to Dr. Richard Keen at [email protected]. For the sake of consistency with Danjon estimates made before mobile phones took over the planet, also compare the moon’s color with the written descriptions above before sending your final estimate.
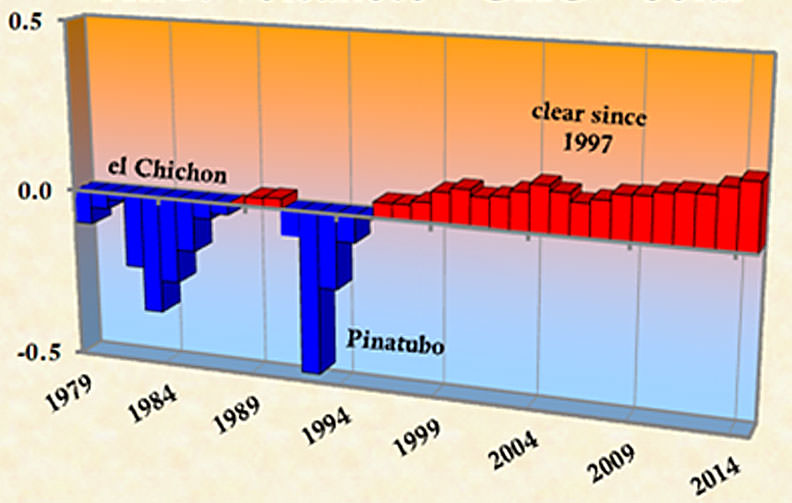
Graph showing the change in heating of the ground in fractions of degrees (vertical axis) as affected by volcanic eruptions and greenhouse warming since 1979. The blue shows volcanic cooling, the red shows greenhouse warming. Notice the rising trend in warming after 1996. Credit: Dr. Richard Keen
Keen, an emeritus professor at the University of Colorado-Boulder Department of Atmospheric and Oceanic Sciences, has long studied how volcanic eruptions affect both the color of the eclipsed moon and the rate of global warming. Every eclipse presents another opportunity to gauge the current state of the atmosphere and in particular the dustiness of the stratosphere, the layer of air immediately above the ground-hugging troposphere. Much of the sunlight bent into Earth’s shadow cone (umbra) gets filtered through the stratosphere.
Volcanoes like Mt. Pinatubo, which erupted in June 1991 in the Philippines, inject tremendous quantities of ash and sulfur compounds high into the atmosphere, where they can temporarily block sunlight and cause a global drop in temperature. Credit: USGS
Volcanoes pump sulfur compounds and ash high into the atmosphere and sully the otherwise clean stratosphere with volcanic aerosols. These absorb both light and solar energy, a major reason why eclipses occurring after a major volcanic eruption can be exceptionally dark with L values of “0” and “1”.
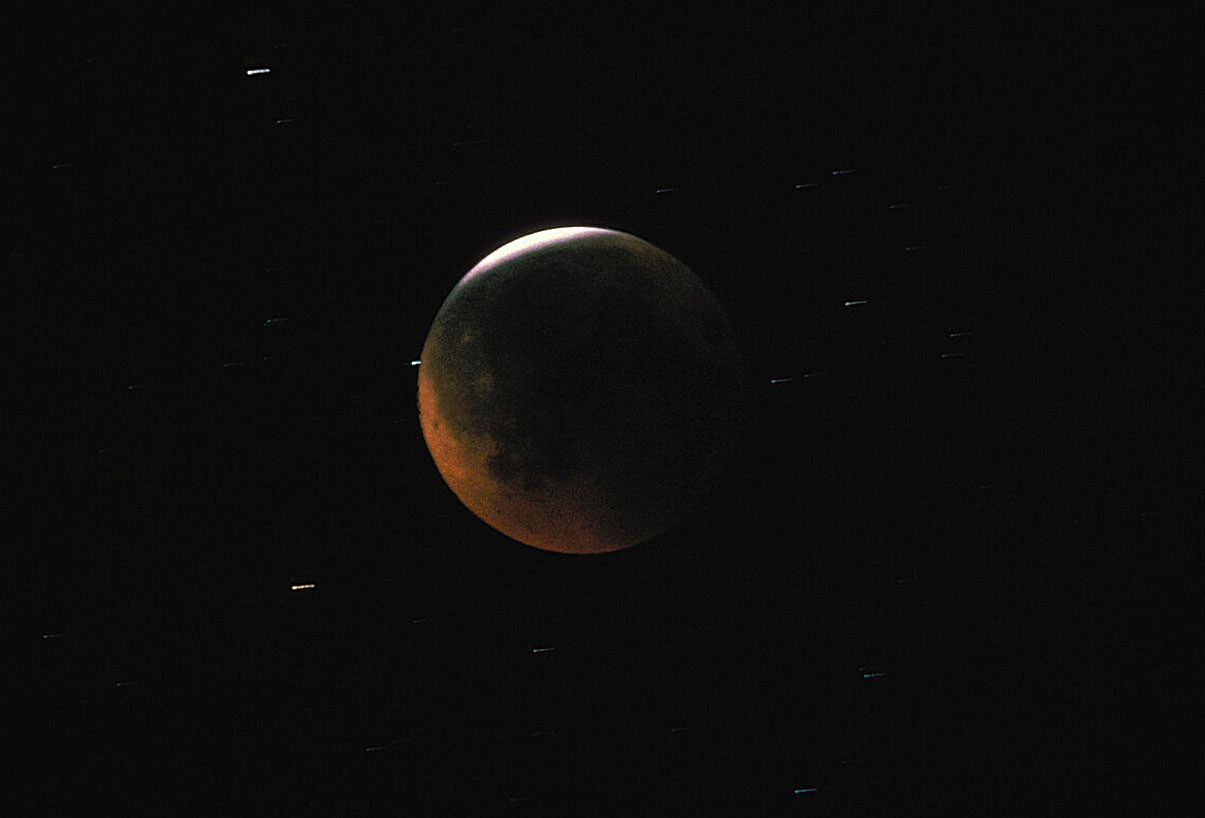
The moon was so dark during the December 1982 eclipse that Dr. Keen required a 3-minute-long exposure at ISO 160 to capture it. Credit: Richard Keen
One of the darkest in recent times occurred on December 30, 1982 after the spectacular spring eruption of Mexico’s El Chichon that hurled some 7 to 10 million tons of ash into the atmosphere. Sulfurous soot circulated the globe for weeks, absorbing sunlight and warming the stratosphere by 7°F (4°C).
Lithograph from the German astronomy magazine Sirius compares the dark, featureless lunar disk during the 1884 eclipse a year after the eruption of Krakatoa (left) with a bright eclipse four years later, after the volcanic aerosols had settled out of the stratosphere (right).
Meanwhile, less sunlight reaching the Earth’s surface caused the northern hemisphere to cool by 0.4-0.6°C. The moon grew so ashen-black during totality that if you didn’t know where to look, you’d miss it.
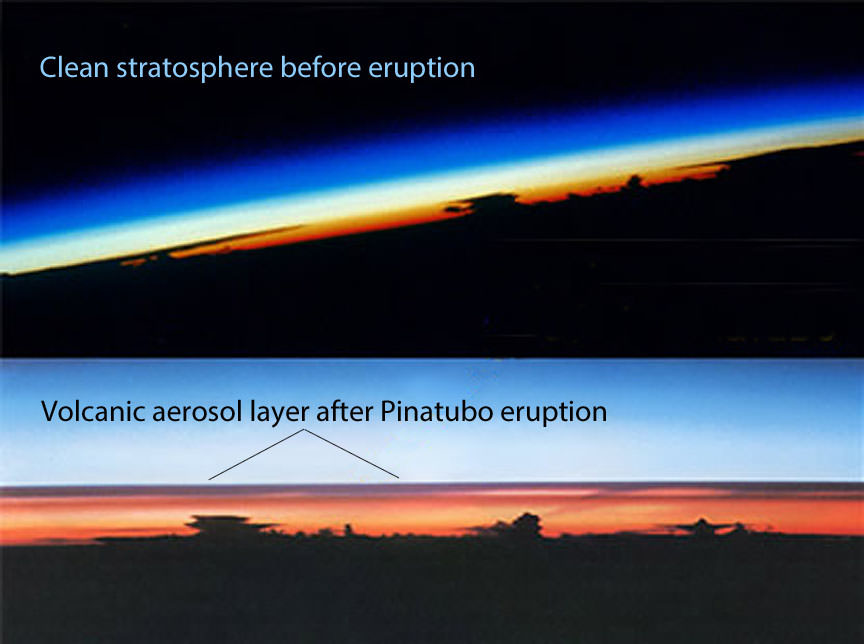
Two photos of Earth’s limb or horizon from orbit at sunset before and after the Mt. Pinatubo eruption. The top view shows a relatively clear atmosphere, taken August 30,1984. The bottom photo was taken August 8, 1991, less than two months after the eruption. Two dark layers of aerosols between 12 and 15 miles high make distinct boundaries in the atmosphere. Credit: NASA
Keen’s research focuses on how the clean, relatively dust-free stratosphere of recent years may be related to a rise in the rate of global warming compared to volcano-induced declines prior to 1996. Your simple observation will provide one more data point toward a better understanding of atmospheric processes and how they relate to climate change.
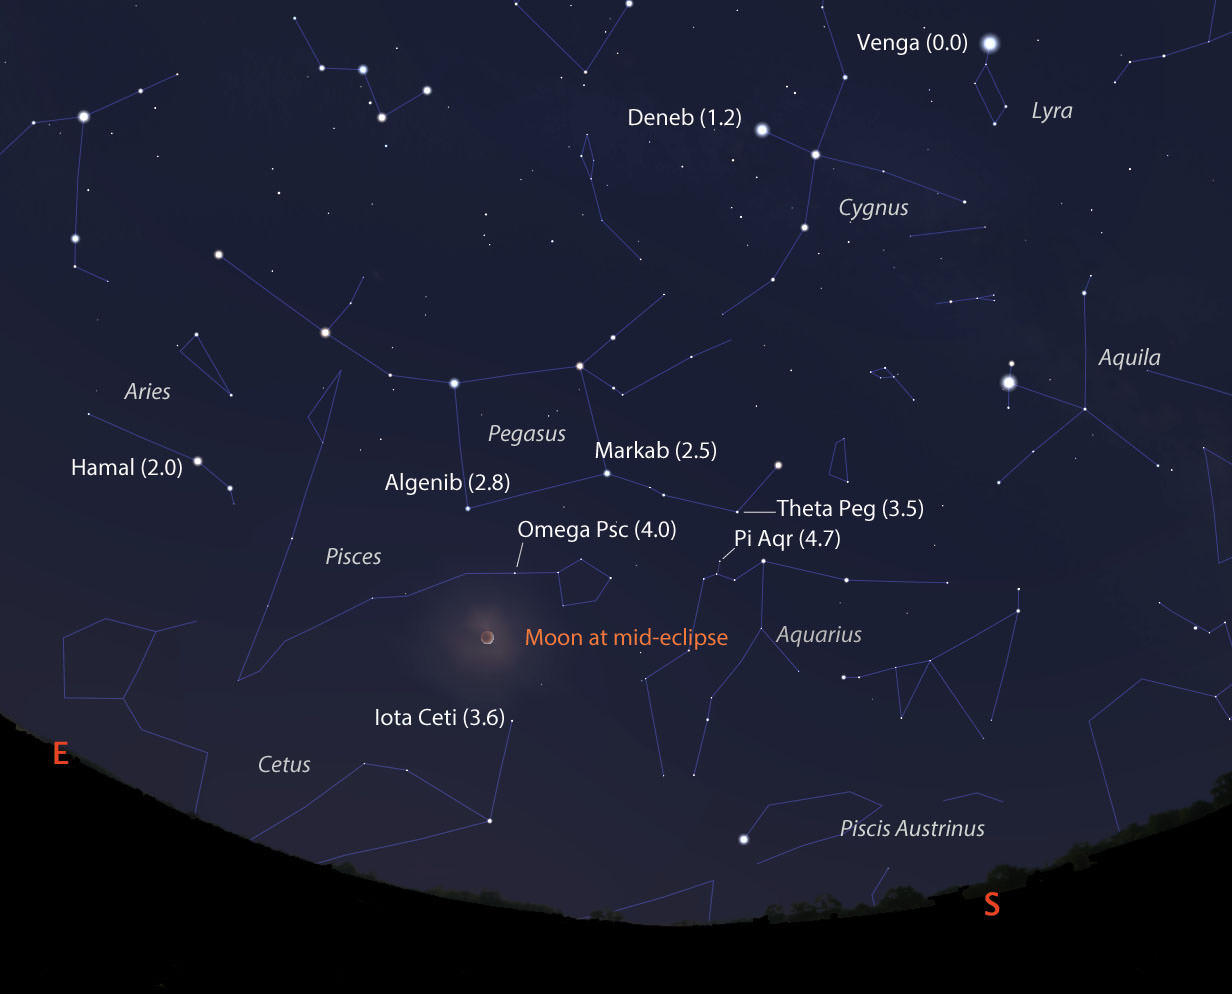
This map shows the Moon during mid-eclipse at 9:48 p.m. CDT. Selected stars are labeled with their magnitudes. Examine the Moon backwards through binoculars and find a star it most closely matches to determine its magnitude. If for instance, the Moon looks about halfway in brightness between Hamal and Deneb, then it’s magnitude 1.6. Click to enlarge. Source: Stellarium
If you’d like to do a little more science during the eclipse, Keen suggests examining the moon’s color just after the beginning and before the end of totality to determine an ‘L’ value for the outer umbra. You can also determine the moon’s overall brightness or magnitude at mid-eclipse by comparing it to stars of known magnitude. The best way to do that is to reduce the moon down to approximately star-size by looking at it through the wrong end of a pair of 7-10x binoculars and compare it to the unreduced naked eye stars. Use this link for details on how it’s done along with the map I’ve created that has key stars and their magnitudes.
The table below includes eclipse events for four different time zones with emphasis on mid-eclipse, the time to make your observation. Good luck on Sunday’s science project and thanks for your participation!
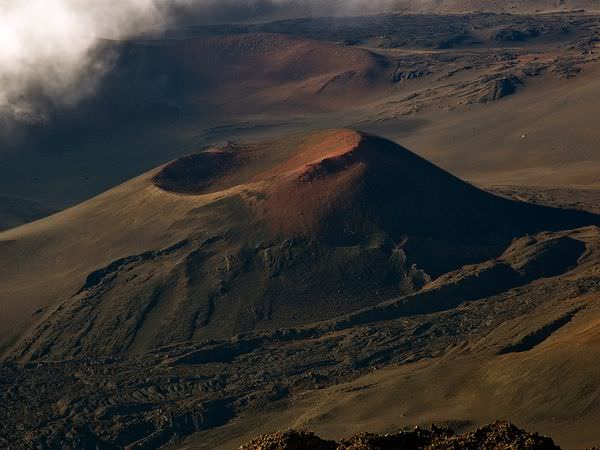
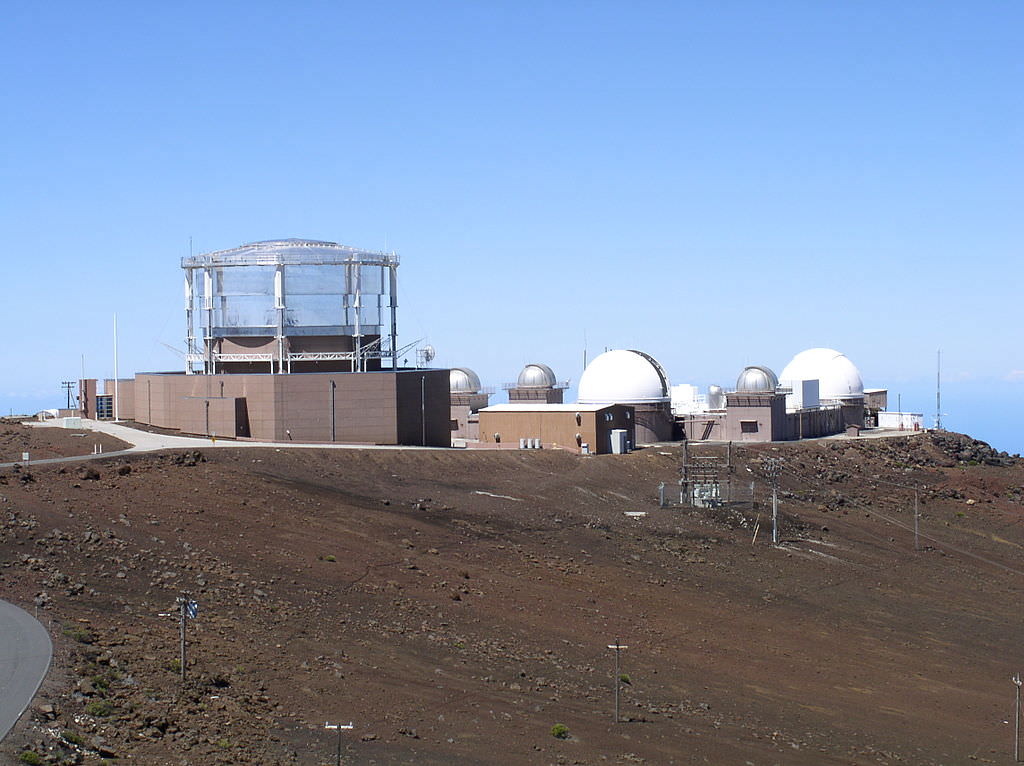
Haleakala, a giant shield volcano, forms the eastern bulwark of the island of Maui. Any volcanoes on an asteroid would not form large cones like this. Credit: National Geographic/Cathy Roberts
Hawaii is famous for its lovely mountains, tropical climate, and majestic oceanfront vistas. Another thing it is famous for is the string of volcanoes that dot its islands. As a land that sits atop a geographic hot spot – i.e. an area deep within the Earth’s mantle from which heat rises, forming magma that is then pushed to the surface – the island is also home to some serious volcanic activity.
Consider Haleakala, the massive shield volcano that constitutes more than 75% of the Hawaiian Island of Maui. The result of volcanic activity that took place roughly 1 million years ago, this volcano has played an active role in the geological and cultural history of the Hawaiian islands. Description and Naming: Like all shield volcanoes, Haleakala was formed from a series of highly fluid magma flows. This is the reason for its general appearance, as well as the designation – i.e. it resembles a broad shield lying on the ground. It’s tallest peak, which is named is Pu’u ‘Ula’ula (“Red Hill”) in native Hawaiian, measures 3,055 m (10,023 ft) tall.
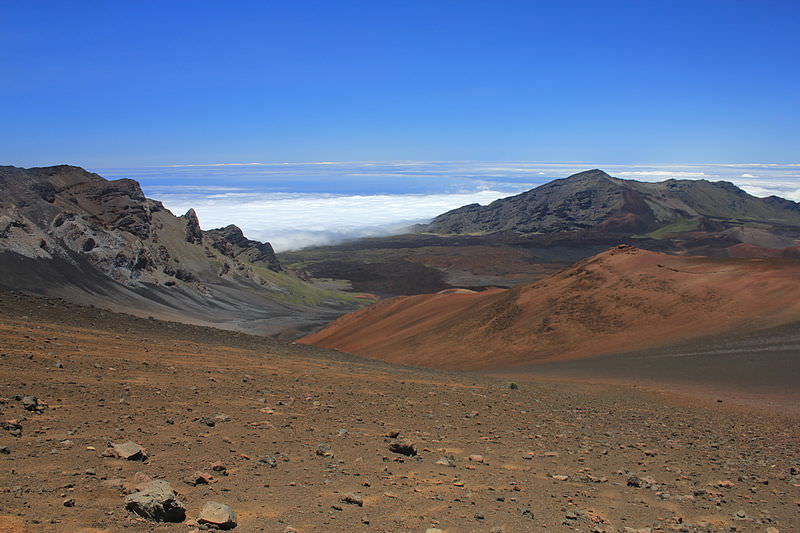
At Haleakala’s summit lies a massive depression (crater) that measures some 11.25 km (7 miles) in diameter and nearly 800 m (2,600 ft) deep. The name Haleakala means literally “House of the Sun”, which was given to the general mountain area by the early Hawaiian people.
Sliding sands trail in the Haleakala Crater, Maui. Credit: Haleakala National Park
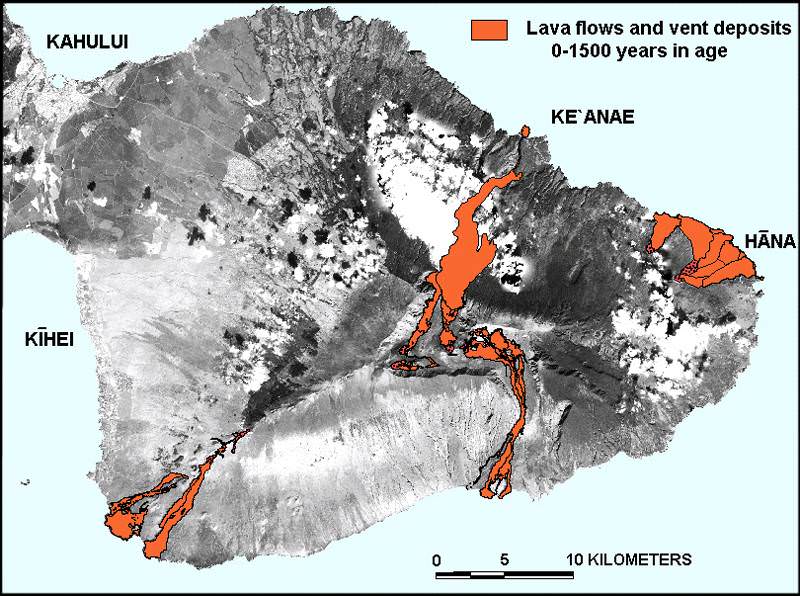
Geology: Haleakala is part of a sequence of lava flows that emerged near the end of East Maui. This region is believed to have begun experiencing lava flows about 2.0 million years ago, and it is estimated that the volcano formed from the ocean floor to its current shield-like shape over the course of the ensuing 600,000 years. The oldest exposed lava flow on East Maui is dated to 1.1 million years ago.
In the past 30,000 years, the volcanism on East Maui has been focused along the southwest and east rift zones. These two volcanic axes together form one gently curving arc that passes from La Perouse Bay (southwest flank of East Maui) through Haleakala Crater to Hana on the east flank.
The alignment of these axes continues east beneath the ocean as Haleakala Ridge, one of the longest rift zones along the Hawaiian Islands volcanic chain. The on-land segment of this lengthy volcanic line of vents is the zone of greatest hazard for future lava flows and cindery ash.
Contrary to popular belief, the Haleakala “crater” is not volcanic in origin, nor can it accurately be called a caldera (which is formed when the summit of a volcano collapses to form a depression). Scientists believe instead that the depression was formed when the headwalls of two large erosional valleys merged at the summit of the volcano.
Modern techniques have allowed geologists to accurately date the lava flows on Maui. Credit: D. Sherrod/USGS
History: Haleakala has produced numerous eruptions in the last 30,000 years, including in the last 500 years. The volcano has figured prominently in the island’s history of human occupation. In Hawaiian folklore, the crater at the summit was home to the grandmother of the demigod Maui. According to the legend, Maui’s grandmother helped him capture the sun and force it to slow its journey across the sky in order to lengthen the day.
Until recently, the East Maui Volcano was thought to have last erupted around 1790, based largely on comparisons of maps made during the voyages of the explorers La Perouse and George Vancouver. Recent advanced dating tests, however, have shown that the last eruption was more likely to have taken place in the 17th century.
Modern geologic mapping efforts began in 1997, which yielded the most detailed and accurate picture of Haleakala’s volcanic history to date. In addition, there are fears that the volcano is not extinct, but just currently dormant, and may erupt again within the next 500 years.
For these reasons, the U.S. Geological Survey maintains a sparse seismic network on Haleakala volcano and conducts periodic surveys, using GPS receivers that gather data about the volcano’s surface deformation or lack thereof.
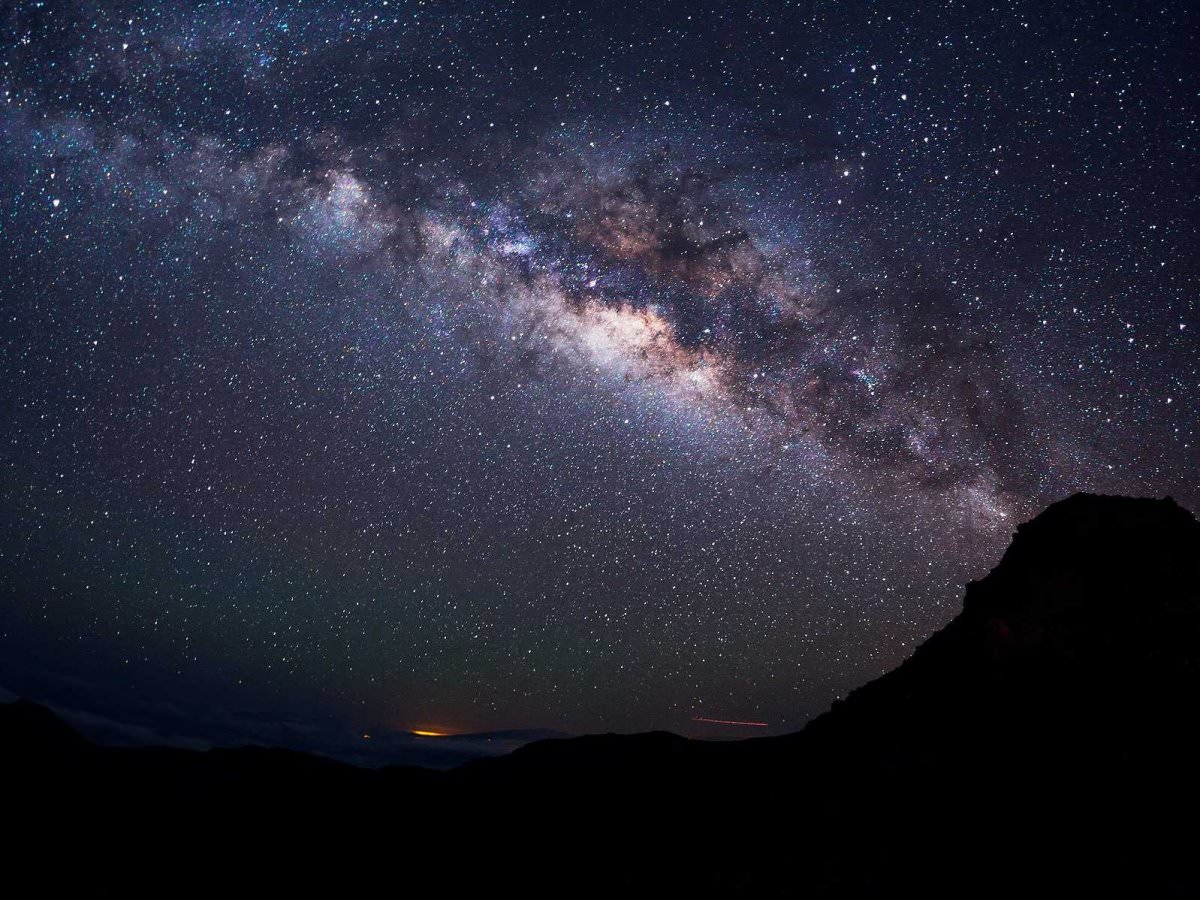
The view from Haleakala at night, Haleakala National Park. Credit: travelbloggerbuzz.com
Modern Uses: In 1916, Haleakala National Park was created, a 30,183-acre (122.15 km2) park surrounding the summit depression, Kipahulu Valley on the southeast, and ‘Ohe‘o Gulch (and pools), extending to the shoreline in the Kipahulu area. Within the park, 19,270 acres (77.98 km2) is a wilderness area, which is why the park area was designated an International Biosphere Reserve in 1980.
The main feature of this part of the park is the famous Haleakala Crater. Two main trails lead into the crater from the summit area – the Halemau’u and Sliding Sands trails. Haleakala is popular with tourists and locals alike, who often venture to its summit – or to the visitor center just below the summit – to view the sunrise. There is lodging in the crater in the form of a few simple cabins.
Because of the clarity and stillness of the air, the summit of Haleakala is one of the most valuable spots for observatories. It is also far enough away from the city lights to avoid light pollution, and above one-third of the planet’s atmosphere. Hence why the summit is the location of an astrophysical research facility – known as “Science City” – which is operated by a number of U.S. government and academic organizations.
These include the U.S. Department of Defense, the University of Hawaii, the Smithsonian Institution, the US Air Force, the Federal Aviation Administration (FAA), and others. Some of the telescopes operated by the US Department of Defense are involved in researching man-made (e.g. spacecraft, monitoring satellites, rockets, and laser technology) rather than celestial objects.
The Science City research faciltiy, located at the summit of the Haleakala volcano. Credit: Wikipedia Commons/Tawker
The scientific program is run in collaboration with defense contractors in the Maui Research and Technology Park in Kihei. Despite concerns that Maui’s growing population will mean increased incidents of light pollution, new telescopes are being added – such as the Pan-STARRS in 2006.
Although another 500 years or more may pass before Haleakala erupts again, it’s also possible that new eruptions will begin in the near future. However, according to the United States Geological Survey (USGS) Volcano Warning Scheme for the United States, the Volcanic-Alert Level as of June 2013 was “normal”. Given the likelihood of significant environmental and property damage, not to mention the potential loss of life, one can only hope this holds true for the foreseeable future.
Sarychev volcano, (located in Russia's Kuril Islands, northeast of Japan) in an early stage of eruption on June 12, 2009. Credit: NASA
What if someone were to tell you that there’s a region in the world where roughly 90% of the world’s earthquakes occur. What if they were to tell you that this region is also home to over 75% of the world’s active and dormant volcanoes, and all but 3 of the world’s 25 largest eruptions in the last 11,700 years took place here.
Chances are, you’d think twice about buying real-estate there. But strangely enough, hundreds of millions of people live in this area, and some of the most densely-packed cities in the world have been built atop its shaky faults. We are talking about the Pacific Ring of Fire, a geologically and volcanically active region that stretches from one side of the Pacific to the other.
Definition:
Also known as the circum-Pacific belt, the “Ring of Fire” is a 40,000 km (25,000 mile) horseshoe-shaped basin that is associated with a nearly continuous series of oceanic trenches, volcanic arcs, and volcanic belts and/or plate movements. This ring accounts for 452 volcanoes (active and dormant), stretching from the southern tip of South America, up along the coast of North America, across the Bering Strait, down through Japan, and into New Zealand – with several active and dormant volcanoes in Antarctica closing the ring.
Tectonic Activity:
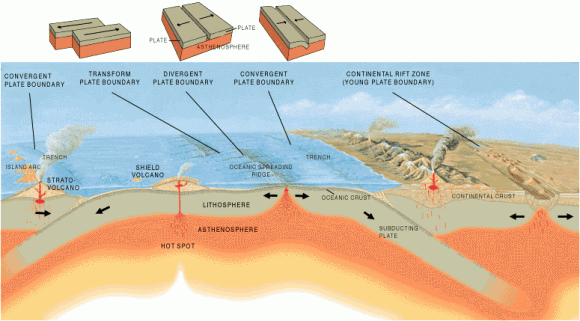
The Ring of Fire is the direct result of plate tectonics and the movement and collisions of lithospheric plates. These plates, which constitute the outer layer of the planet, are constantly in motion atop the mantle. Sometimes they collide, pull apart, or slide alongside each other; resulting in convergent boundaries, divergent boundaries, and transform boundaries.
The Pacific Ring of Fire, a string of volcanic regions extending from the South Pacific to South America. Credit: Public Domain
In the case of the former, subduction zones are often the result, where the heavier plate slips under the lighter plate – forming a deep trench. This subduction changes the dense mantle into buoyant magma, which rises through the crust to the Earth’s surface. Over millions of years, this rising magma creates a series of active volcanoes known as a volcanic arc.
These ocean trenches and volcanic arcs run parallel to one another. For instance, the Aleutian Islands in the U.S. state of Alaska run parallel to the Aleutian Trench. Both geographic features continue to form as the Pacific Plate subducts beneath the North American Plate. Meanwhile, the Andes Mountains of South America run parallel to the Peru-Chile Trench, created as the Nazca Plate subducts beneath the South American Plate.
In the case of divergent boundaries, these are formed when tectonic plates pull apart, forming rift valleys on the seafloor. When this happens, magma wells up in the rift as the old crust pulls itself in opposite directions, where it is cooled by seawater to form new crust. This upward movement and eventual cooling of this magma has created high ridges on the ocean floor over millions of years.
The East Pacific Rise is a site of major seafloor spreading in the Ring of Fire, located on the divergent boundary of the Pacific Plate and the Cocos Plate (west of Central America), the Nazca Plate (west of South America), and the Antarctic Plate. The largest known group of volcanoes on Earth is found underwater along the portion of the East Pacific Rise between the coasts of northern Chile and southern Peru.
The different type of tectonic plate boundaries. Credit: oceanexplorer.noaa.gov
A transform boundary is formed when tectonic plates slide horizontally and parts get stuck at points of contact. Stress builds in these areas as the rest of the plates continue to move, which causes the rock to break or slip, suddenly lurching the plates forward and causing earthquakes. These areas of breakage or slippage are called faults, and the majority of Earth’s faults can be found along transform boundaries in the Ring of Fire.
The San Andreas Fault, stretching along the central west coast of North America, is one of the most active faults on the Ring of Fire. It lies on the transform boundary between the North American Plate, which is moving south, and the Pacific Plate, which is moving north. Measuring about 1,287 kilometers (800 miles) long and 16 kilometers (10 miles) deep, the fault cuts through the western part of the U.S. state of California.
Plate Boundaries:
The eastern section of the Ring of Fire is the result of the Nazca Plate and the Cocos Plate being subducted beneath the westward moving South American Plate. Meanwhile, the Cocos Plate is being subducted beneath the Caribbean Plate, in Central America. A portion of the Pacific Plate along with the small Juan de Fuca Plate are being subducted beneath the North American Plate.
Along the northern portion, the northwestward-moving Pacific plate is being subducted beneath the Aleutian Islands arc. Farther west, the Pacific plate is being subducted along the Kamchatka Peninsula arcs on south past Japan.
The Earth’s Tectonic Plates. Credit: msnucleus.org
The southern portion is more complex, with a number of smaller tectonic plates in collision with the Pacific plate from the Mariana Islands, the Philippines, Bougainville, Tonga, and New Zealand. This portion excludes Australia, since it lies in the center of its tectonic plate.
Indonesia lies between the Ring of Fire along the northeastern islands adjacent to and including New Guinea and the Alpide belt along the south and west from Sumatra, Java, Bali, Flores, and Timor. The famous and very active San Andreas Fault zone of California is a transform fault which offsets a portion of the East Pacific Rise under southwestern United States and Mexico.
Volcanic Activity:
Most of the active volcanoes on The Ring of Fire are found on its western edge, from the Kamchatka Peninsula in Russia, through the islands of Japan and Southeast Asia, to New Zealand. Mount Ruapehu in New Zealand is one of the more active volcanoes in the Ring of Fire, with yearly minor eruptions, and major eruptions occurring about every 50 years.
Krakatau, perhaps better known as Krakatoa, is an island volcano in Indonesia. Krakatoa erupts less often than Mount Ruapehu, but much more spectacularly. Beneath Krakatoa, the denser Australian Plate is being subducted beneath the Eurasian Plate. An infamous eruption in 1883 destroyed the entire island, sending volcanic gas, volcanic ash, and rocks as high as 80 kilometers (50 miles) in the air. A new island volcano, Anak Krakatau, has been forming with minor eruptions ever since.
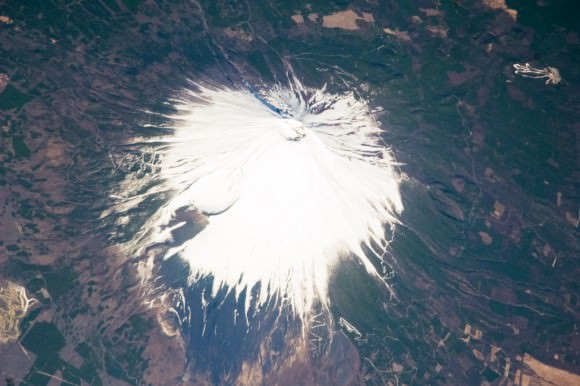
Mount Fuji, Japan, as seen from the ISS. Credit: NASA
Mount Fuji, Japan’s tallest and most famous mountain, is an active volcano in the Ring of Fire. Mount Fuji last erupted in 1707, but recent earthquake activity in eastern Japan may have put the volcano in a “critical state.” Mount Fuji sits at a “triple junction,” where three tectonic plates (the Amur Plate, Okhotsk Plate, and Philippine Plate) interact.
The Ring of Fire’s eastern half also has a number of active volcanic areas, including the Aleutian Islands, the Cascade Mountains in the western U.S., the Trans-Mexican Volcanic Belt, and the Andes Mountains. Mount St. Helens, in the U.S. state of Washington, is an active volcano in the Cascade Mountains.
Below Mount St. Helens, both the Juan de Fuca and Pacific plates are being subducted beneath the North American Plate. Its historic 1980 eruption lasted 9 hours and covered 11 U.S. states with tons of volcanic ash. The eruption caused the deaths of 57 people, over a billion dollars in property damage, and reduced hundreds of square miles to wasteland.
Popocatépetl is one of the most active and dangerous volcanoes in the Ring of Fire, with 15 recorded eruptions since 1519. The volcano lies on the Trans-Mexican Volcanic Belt, which is the result of the small Cocos Plate subducting beneath the North American Plate. Located close to the urban areas of Mexico City and Puebla, Popocatépetl poses a risk to the more than 20 million people that live close enough to be threatened by a destructive eruption.
Map of the Earth showing the relation between fault lines (blue) and zones of volcanic activity (red). Credit: zmescience.com
Earthquakes:
Scientists have known for some time that the majority of the seismic activity occurs along plate boundaries. Hence why roughly 90% of the world’s earthquakes – which is estimated to be around 500,000 a year, one-fifth of which are detectable – occur around the Pacific Rim, where multiple plate boundaries exist.
As a result, earthquakes are a regular occurrence in places like Japan, Indonesia and New Zealand in Asia and the South Pacific; Alaska, British Columbia, California and Mexico in North America; and El Salvador, Guatemala, Peru and Chile in Central and South America. Where fault lines run beneath the ocean, larger earthquakes in these regions also trigger tsunamis.
The most well-known tsumanis to take place in the Ring of Fire include the 2004 Indian Ocean earthquake and tsunami. This was the most devastating tsunami of its kind in modern times, killing around 230,000 people and laying waste to communities throughout Indonesia, Thailand, and Southern Asia.
In 2010, an earthquake triggered a tsunami which caused 4334 confirmed deaths and devastating several coastal towns in south-central Chile, including the port at Talcahuano. The earthquake also generated a blackout that affected 93 percent of the Chilean population.
In 2011, an earthquake off the Pacific coast of Tohoku led to a tsunami that struck Japan and led to 5,891 deaths, 6,152 injuries, and 2,584 people to be declared missing across twenty prefectures. The tsunami also caused meltdowns at three reactors in the Fukushima Daiichi Nuclear Power Plant complex.
The Ring of Fire is a crucial region for many reasons. It serves as one of the main boundary regions for the tectonic plates of over half of the globe. It also affects the lives of millions if not billions of people who live in these regions. For many of the people who live in the Pacific Ring of Fire, the reality of a volcanic eruption or earthquake is commonplace and a challenge they have come to deal with over time.
At the same time, the volcanic activity has also provided many valuable resources, such as rich farmland and the possibility of tapping geothermal activity for heating and electricity. As always, nature gives with one hand and takes with the other!
If you have enjoyed this article there are several others on Universe Today that you will find interesting. Here is one called 10 Interesting Facts About Volcanoes. There is also a great article about plate tectonics.
You can also find some good resources online. There is a companion site for the PBS program Savage Earth that talks about the Ring of Fire. You can also check out the USGS site to see a detailed map of the Pacific Ring of Fire and more detailed information about plate tectonics.
You can also listen to Astronomy Cast. Episode 141 talks about volcanoes.
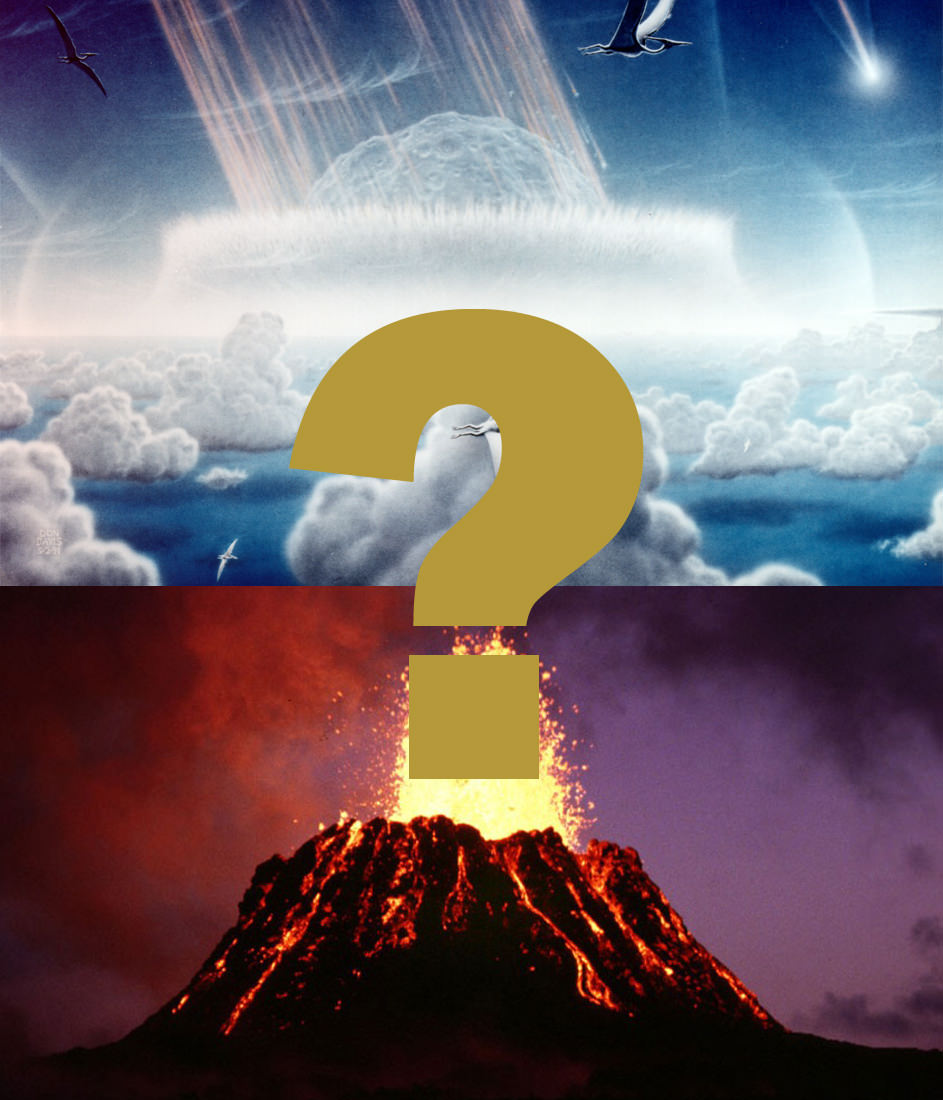
Which is the main culprit for the terminal Cretaceous extinction: the Chicxulub impact or Deccan Traps volcanism? Upper Image: Donald Davis, NASA JPL
Lower Image: USGS
About sixty five and a half million years ago, the Earth suffered its largest known cosmic impact. An asteroid or comet nucleus about 10 km in diameter slammed into what is now the Yucatan peninsula of Mexico. It gouged out a crater 180 to 200 km in diameter: nearly twice as large as the prominent crater Copernicus on Earth’s moon. But did this impact really cause the extinction of the dinosaurs and many other forms of life? Many earth scientists are convinced that it did, but some harbor nagging doubts. The doubters have marshaled a growing body of evidence for another culprit; the enormous volcanic eruptions that produced the Deccan Traps formation in India. The skeptics recently presented their case at a meeting of the Geological Society of America in Vancouver, Canada, on October 19.
The dinosaurs are the most well-known victims of the mass extinction event that ended the Cretaceous period. The extinction claimed almost all large vertebrates on land, at sea, or in the air, as well as numerous species of insects, plants, and aquatic invertebrates. At least 75% of all species then existing on Earth vanished in a short span in relation to the geological timescale of millions of years. The disaster is one of five global mass extinction events that paleontologists have identified over the tenure of complex life on Earth.
The hypothesis that the terminal Cretaceous extinction was caused by a cosmic impact has been the most popular explanation of this catastrophe among earth scientists and the public for several decades. It was proposed in 1980 by the father and son team of Luis and Walter Alvarez and their collaborators. The Alvarez team’s main line of evidence that an impact happened was an enrichment of the metal iridium in sediments dating roughly to the end of the Cretaceous. Iridium is rare in Earth’s crust, but common in meteorites. The link between iridium and impacts was first established by studies of the samples returned by the Apollo astronauts from the Moon.
Over the ensuing decades, evidence of an impact accumulated. In 1991, a team of scientists led by Dr. Alan Hildebrand of the Department of Planetary Sciences at Arizona University, published evidence of a gigantic buried impact crater, called Chicxulub, in Mexico. Other investigators found evidence of materials ejected by the impact, including glass spherules in Haiti and Mexico. Supporters of the impact hypothesis believe that vast amounts of dust hurtled into the stratosphere would have plunged the surface of the planet into the darkness and bitter cold of an “impact winter” lasting for at least months, and perhaps decades. Global ecosystems would have collapsed and mass extinction ensued. But, they’ve had a harder time finding evidence for these consequences than for the impact itself.
Doubters of the Alvarez hypothesis don’t question the ‘smoking gun’ evidence that an impact happened near the end of the Cretaceous, but they don’t think it was the main cause of the extinctions. For one thing, inferring the exact time of the impact from its putative geological traces has proved difficult. Dr. Gerta Keller of the Department of Geosciences of Princeton University, a prominent skeptic of the Alvarez hypothesis, has questioned estimates that make the impact and the extinctions simultaneous. Analyzing core samples taken from the Chicxulub crater, and glass spherule containing deposits in northeastern Mexico, she concludes that the Chicxulub impact preceded the mass extinction by 120,000 years and had little consequence for the fossil record of life in the geological formations which she studied. Of the five major mass extinction events in Earth’s history, she noted in a 2011 paper, none other than the terminal Cretaceous event has ever been even approximately associated with an impact. Several other large impact craters besides Chicxulub have been well studied by geologists and none is associated with fossil evidence of extinctions. On the other hand, four of the five major mass extinctions appear to have some connection with volcanic eruptions.
Keller and other Alvarez skeptics look to a major volcanic event that occurred towards the end of the Cretaceous as an alternate primary cause of the extinction. The Deccan Traps formation in central India is a plateau consisting of multiple layers of solidified lava 3500 m thick. Today, it extends over an area larger than all of France. It was once three times that large. It was formed in a series of three volcanic outbursts that may have been among the largest in Earth’s history. At the October conference, Dr. Theirry Adatte of the Institute of Earth Sciences at the University of Lausanne in France presented evidence that the second of these outbursts was by far the largest, and occurred over a period of 250,000 years prior to the end of the Cretaceous. During this period, 80% of the total lava thickness of the Deccan formation was deposited. The eruptions produced lava flows that may be the longest on Earth, extending more than 1500 km.
The blue area indicates the Deccan Traps, a massive remnant of immense volcanic eruptions at the end of the Cretaceous period that may have contributed to the terminal Cretaceous extinction. Credit: CamArchGrad, English Wikipedia Project
To illustrate the likely environmental consequences of such a super-eruption, Adatte invoked the worst volcanic catastrophe in human history. Over eight months from 1783-84 a major eruption in Laki, Iceland, deposited 14.3 square kilometers of lava and emitted an estimated 122 megatons of toxic sulfur dioxide into the atmosphere. About a quarter of the people and half of the livestock in Iceland died. Across Europe the sky was darkened by a pall of haze, and acid rain fell. Europe and America experienced the most severe winter in history and global climate was disrupted for a decade. Millions of people died from the resulting drought and famine. The Laki incident was nonetheless miniscule by comparison with the second Deccan Traps outburst, which produced 1.5 million square kilometers of lava and an estimated 6,500- 17,000 gigatons of sulfur dioxide.
The Deccan Traps eruptions would also have emitted immense quantities of carbon dioxide. Carbon dioxide is a heat trapping greenhouse gas responsible for the oven-like temperatures of the planet Venus. It is released by the burning of fossil fuels and plays a major role in human-caused global warming on Earth. Thus Geller surmised that the Deccan Traps eruptions could have produced both periods of intense cold due to sulfur dioxide haze, and intense heat due to carbon dioxide induced global warming.
At the October conference she presented the results of her studies of geological formations in Tunisia that preserved a high resolution record of climate change during the time of the main pulse of Deccan Traps volcanic activity. Her evidence shows that near the onset of the 250,000 year pulse, there was a ‘hyperthermal’ period of rapid warming that increased ocean temperatures by 3-4 degrees Celsius. She claimed that temperatures remained elevated through the pulse culminating with a second ‘hyperthermal’ warming of the oceans by an additional 4-5 degrees Celsius. This second hyperthermal warming occurred within a 10,000 year period of mega-eruptions, which corresponded with the terminal Cretaceous extinction. The Chicxulub impact occurred during the 250,000 year pulse, but well prior to the extinctions and the hyperthermal event.
The debate over the relative importance of the Chicxulub impact and the Deccan Trap volcanoes in producing the terminal Cretaceous extinction isn’t over. In May of this year, a team headed by Dr. Johan Vellekoop at the Department of Earth Sciences at Ulrecht University in the Netherlands published evidence of a geologically brief episode of cooling which they claim as the first direct evidence of an “impact winter”. Whatever the outcome of the debate, it seems clear that the end of the Cretaceous, with its super-volcanoes and giant impacts, was not a good time for life on Earth.
G. Keller (2012), The Cretaceous-Tertiary Mass Extinction, Chicxulub Impact, and Deccan Volcanism, Earth and Life, J.A. Talent, Editor, Springer Science and Business media.
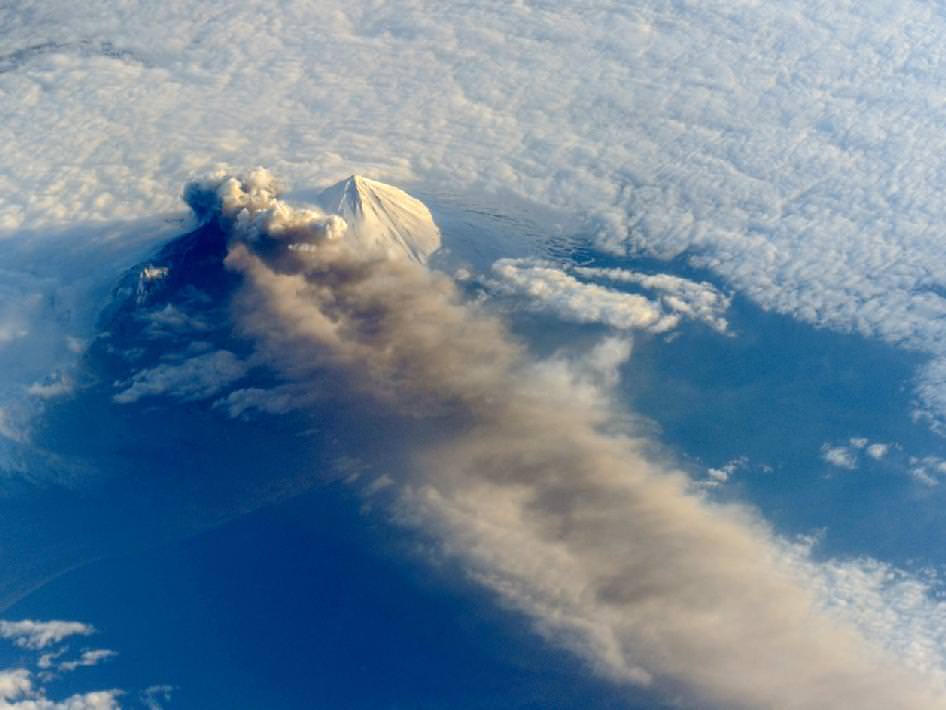
The Pavlof Volcano in Alaska on May 18, 2013. The oblique perspective from the ISS reveals the three dimensional structure of the ash plume, which is often obscured by the top-down view of most remote sensing satellites. Credit: NASA
The Pavlof Volcano began erupting on May 13, 2013, shooting lava into the air and spewing an ash cloud 20,000 feet (6,000 meters) high. This image from the International Space Station was taken on May 18, and provides a unique oblique (sideways) glance at the action. When the photograph was taken, the space station was about 475 miles south-southeast of the volcano (49.1° North latitude, 157.4° West longitude). The volcanic plume extended southeastward over the North Pacific Ocean.
NASA says the oblique perspective reveals the three dimensional structure of the ash plume, which is usually not visible from the top-down views of most remote sensing satellites.
If the volcano keeps erupting and spewing ash at those heights, it could interfere with airline traffic. Pavlov is one of the most frequently erupting volcanoes in the Aleutian arc. It last erupted in August of 2007; it previously had not been active since 1996.
There’s more information — and an impressive set of ground-based images — on the Pavlov Volcano at the Alaska Volcano Observatory website, and here’s a helicopter video of the eruption:
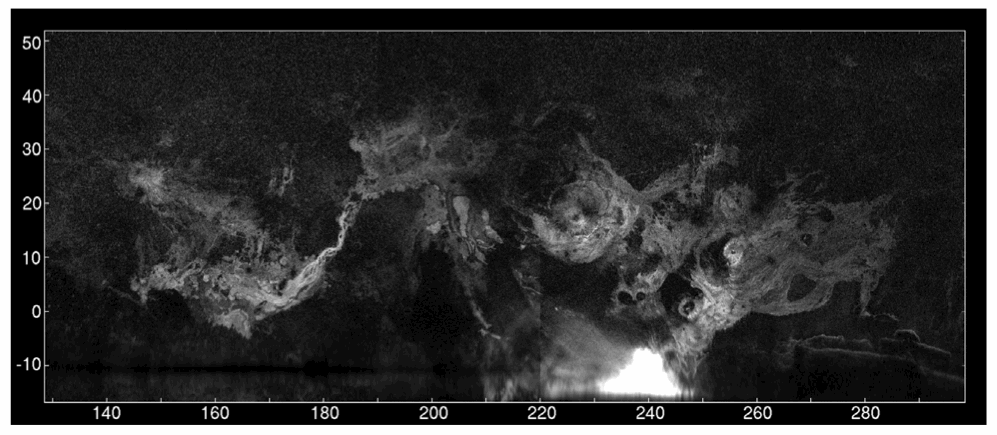
A radar map of Mars’ major volcanic regions created by the Arecibo Observatory in Puerto Rico (John Harmon et al., NAIC)
Even though we currently have several missions exploring Mars both from orbit and on the ground, there’s no reason that robots should be having all the fun; recently a team of radio astronomers aimed the enormous 305-meter dish at Puerto Rico’s Arecibo Observatory at Mars, creating radar maps of the Red Planet’s volcanic regions and capturing a surprising level of detail for Earth-based observations.
The team, led by John Harmon of the National Astronomy and Ionosphere Center, bounced radar waves off Mars from Arecibo’s incredibly-sensitive dish, targeting the volcanic Tharsis, Elysium, and Amazonis regions. Depolarized radar imagery best reveals surface textures; the rougher and less uniform a surface is, the brighter it appears to radar while smooth, flat surfaces appear dark.
What the radar maps portray are very bright — and therefore rough — areas on most of the major volcanoes, although some regions do appear dark, such as the summit of Pavonis Mons.
This likely indicates a covering by smoother, softer material, such as dust or soil. This is actually in line with previous observations of the summit of Pavonis Mons made with the HiRISE camera aboard NASA’s Mars Reconnaissance Orbiter, which showed the summit to appear curiously soft-edged and “out-of-focus”, creating a blurry optical illusion of sorts.
It’s thought that the effect is the result of the build-up of dust over millennia, carried across the planet by dust storms but remaining in place once settled because the Martian wind is just so extremely thin — especially at higher altitudes.
The team also found bright areas located away from the volcanoes, indicating rough flows elsewhere, while some smaller volcanoes appeared entirely dark — again, indicating a possible coating of smooth material like dust or solidified lava flows.
The resolution of the radar maps corresponds to the wavelength of the signals emitted from Arecibo; the 12.6 centimeter signal allows for surface resolution of Mars of about 3 km.
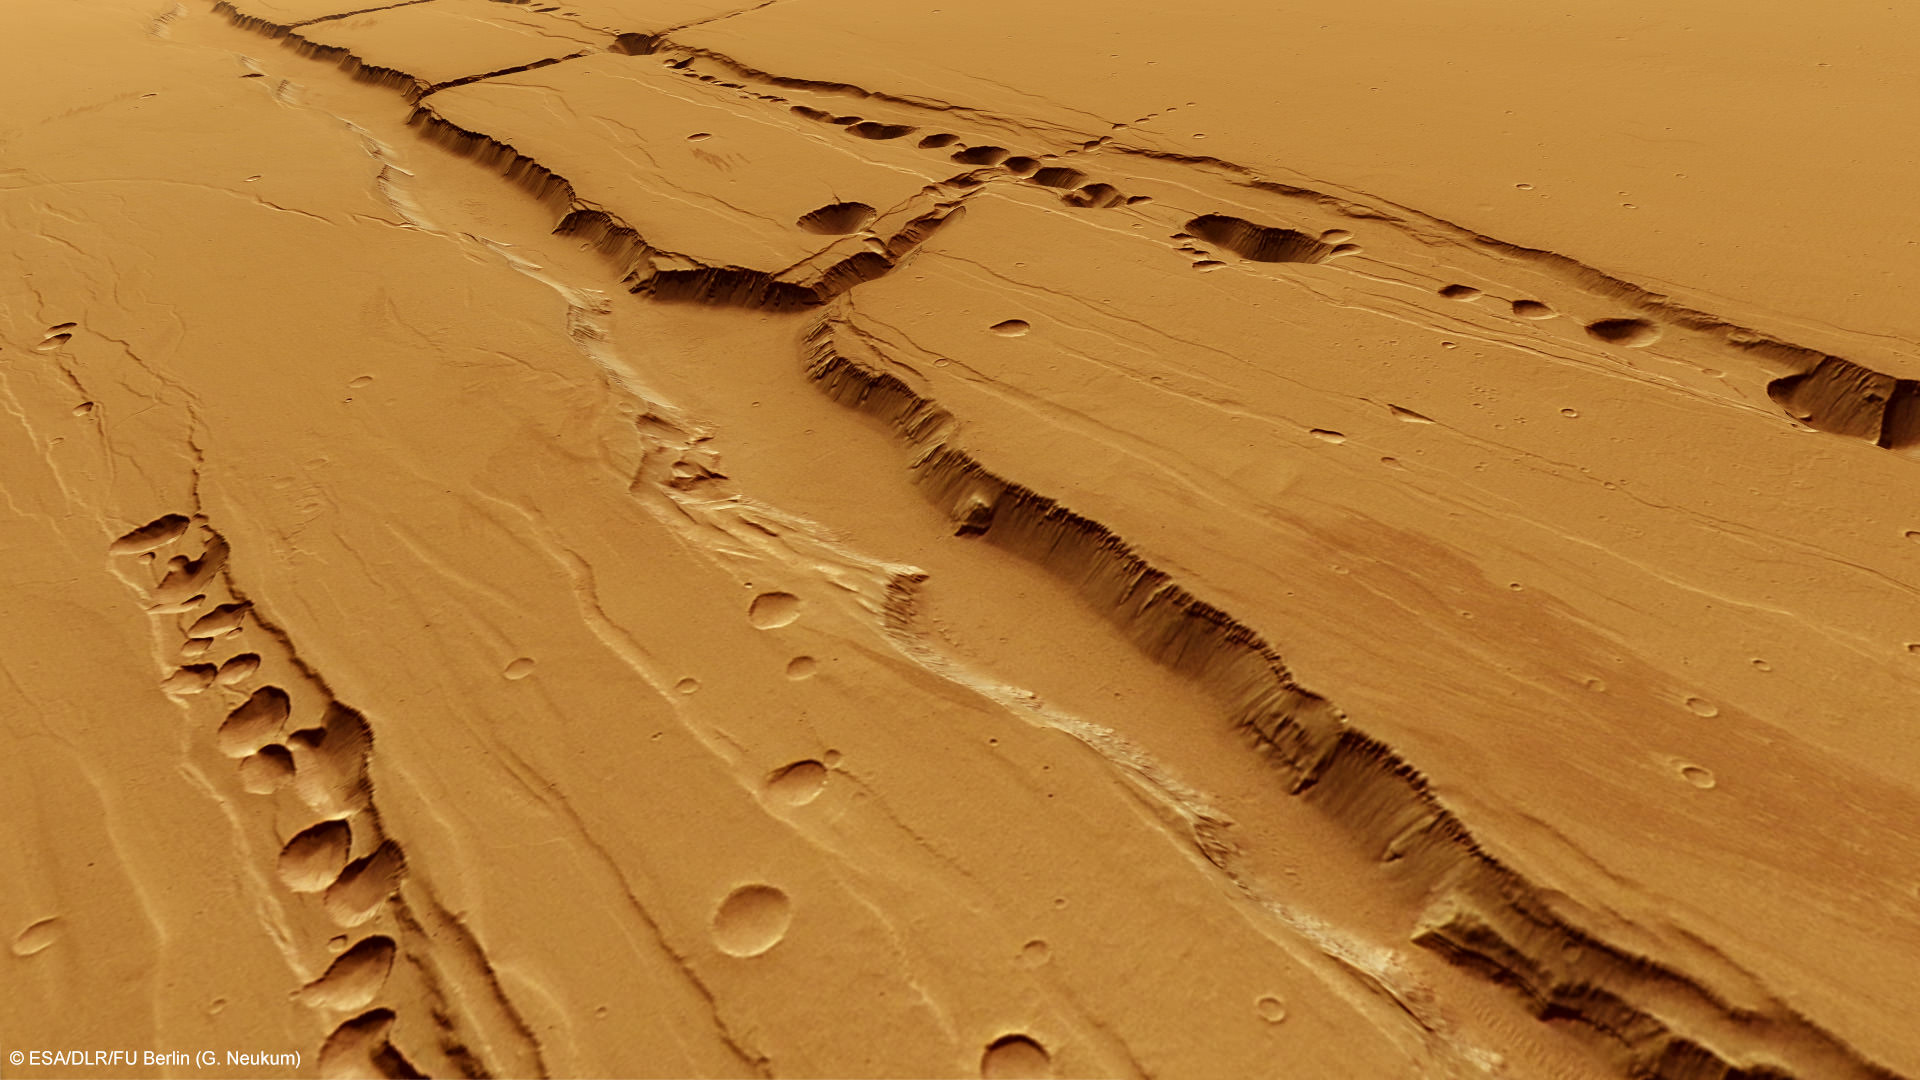
Computer-generated perspective of the Tractus Catene pit chains. Credit: ESA/DLR/FU Berlin (G. Neukum)
[/caption]
Recent images from ESA’s Mars Express spacecraft reveal long rows of crater-like depressions lining the flanks of ancient Martian volcanoes located in the planet’s vast Tharsis region. Rather than being the result of impact events, these “pit chains” were likely caused by underground lava flows — and could be a prime location for look for life.
Like similar features found on Earth, lava tubes on Mars are the result of rivers of magma that carved channels beneath the surface. When these channels empty out, a hollow tube is left. If the roof of a particularly large tube is near the surface the roof can eventually collapse, creating a surface depression… or, in some cases, opening up to the surface entirely.
Even though volcanism on Mars isn’t currently active — the last eruptions probably took place at least over a million years ago — the features left by volcanic activity are still very much present today and likely well-preserved beneath the Martian surface.
Shielded from harsh solar and cosmic radiation, the interior of such lava tubes could provide a safe haven for microbial life — especially if groundwater had found its way inside at some point.
Even though the surface of Mars can receive 250 times the radiation levels found on Earth, the layers of soil and rock surrounding the tubes can provide adequate protection for life, whether it be ancient Martian microbes or future explorers from Earth.
A wider image of the Tractus Catena region showing the large shield volcano Ascraeus Mons. Credits: ESA/DLR/FU Berlin (G. Neukum)
Of course, water and protection from radiation aren’t the only factors necessary for life. There also needs to be some source of heat. Fortunately, the pit chains imaged by Mars Express happen to be within one of the most volcano-laden areas of the Red Planet, a region called the Arcadia quadrangle. Within this area exist some of the largest volcanoes on Mars — and the Tractus Catena pits are located right in the middle of them.
If a heat source were ever to have been beneath the surface of Mars, there would be a good chance it would have been here.
And if our own planet is any measure of such things, where there’s heat and water there is often some form of life — however extreme the conditions may be.
“I’d like to see us land ON a volcano,” Dr. Tracy Gregg, a volcanologist with the University of Buffalo, had once told Universe Today back in 2004. “Right on the flanks. Often the best place to look for evidence of life on any planet is near volcanoes.”
“That may sound counterintuitive, but think about Yellowstone National Park , which really is nothing but a huge volcano,” Gregg elaborated. “Even when the weather in Wyoming is 20 below zero, all the geysers, which are fed by volcanic heat, are swarming with bacteria and all kinds of happy little things cruising around in the water. So, since we think that the necessary ingredients for life on Earth were water and heat, we are looking for the same things on Mars.”
As far as any remaining geothermal activity still happening beneath the Martian surface?
“I strongly suspect there are still molten (or at least mushy) magma bodies beneath the huge Tharsis volcanoes,” Gregg had said. (Read the full article here.)
On Earth, lava tubes, caves and underground spaces of all kinds harbor life, often specialized forms that are found no place else. Could this be (or have once been) the case on Mars as well? Only future exploration will tell. Until then, places like Tractus Catena will remain on scientists’ short list of places to look.
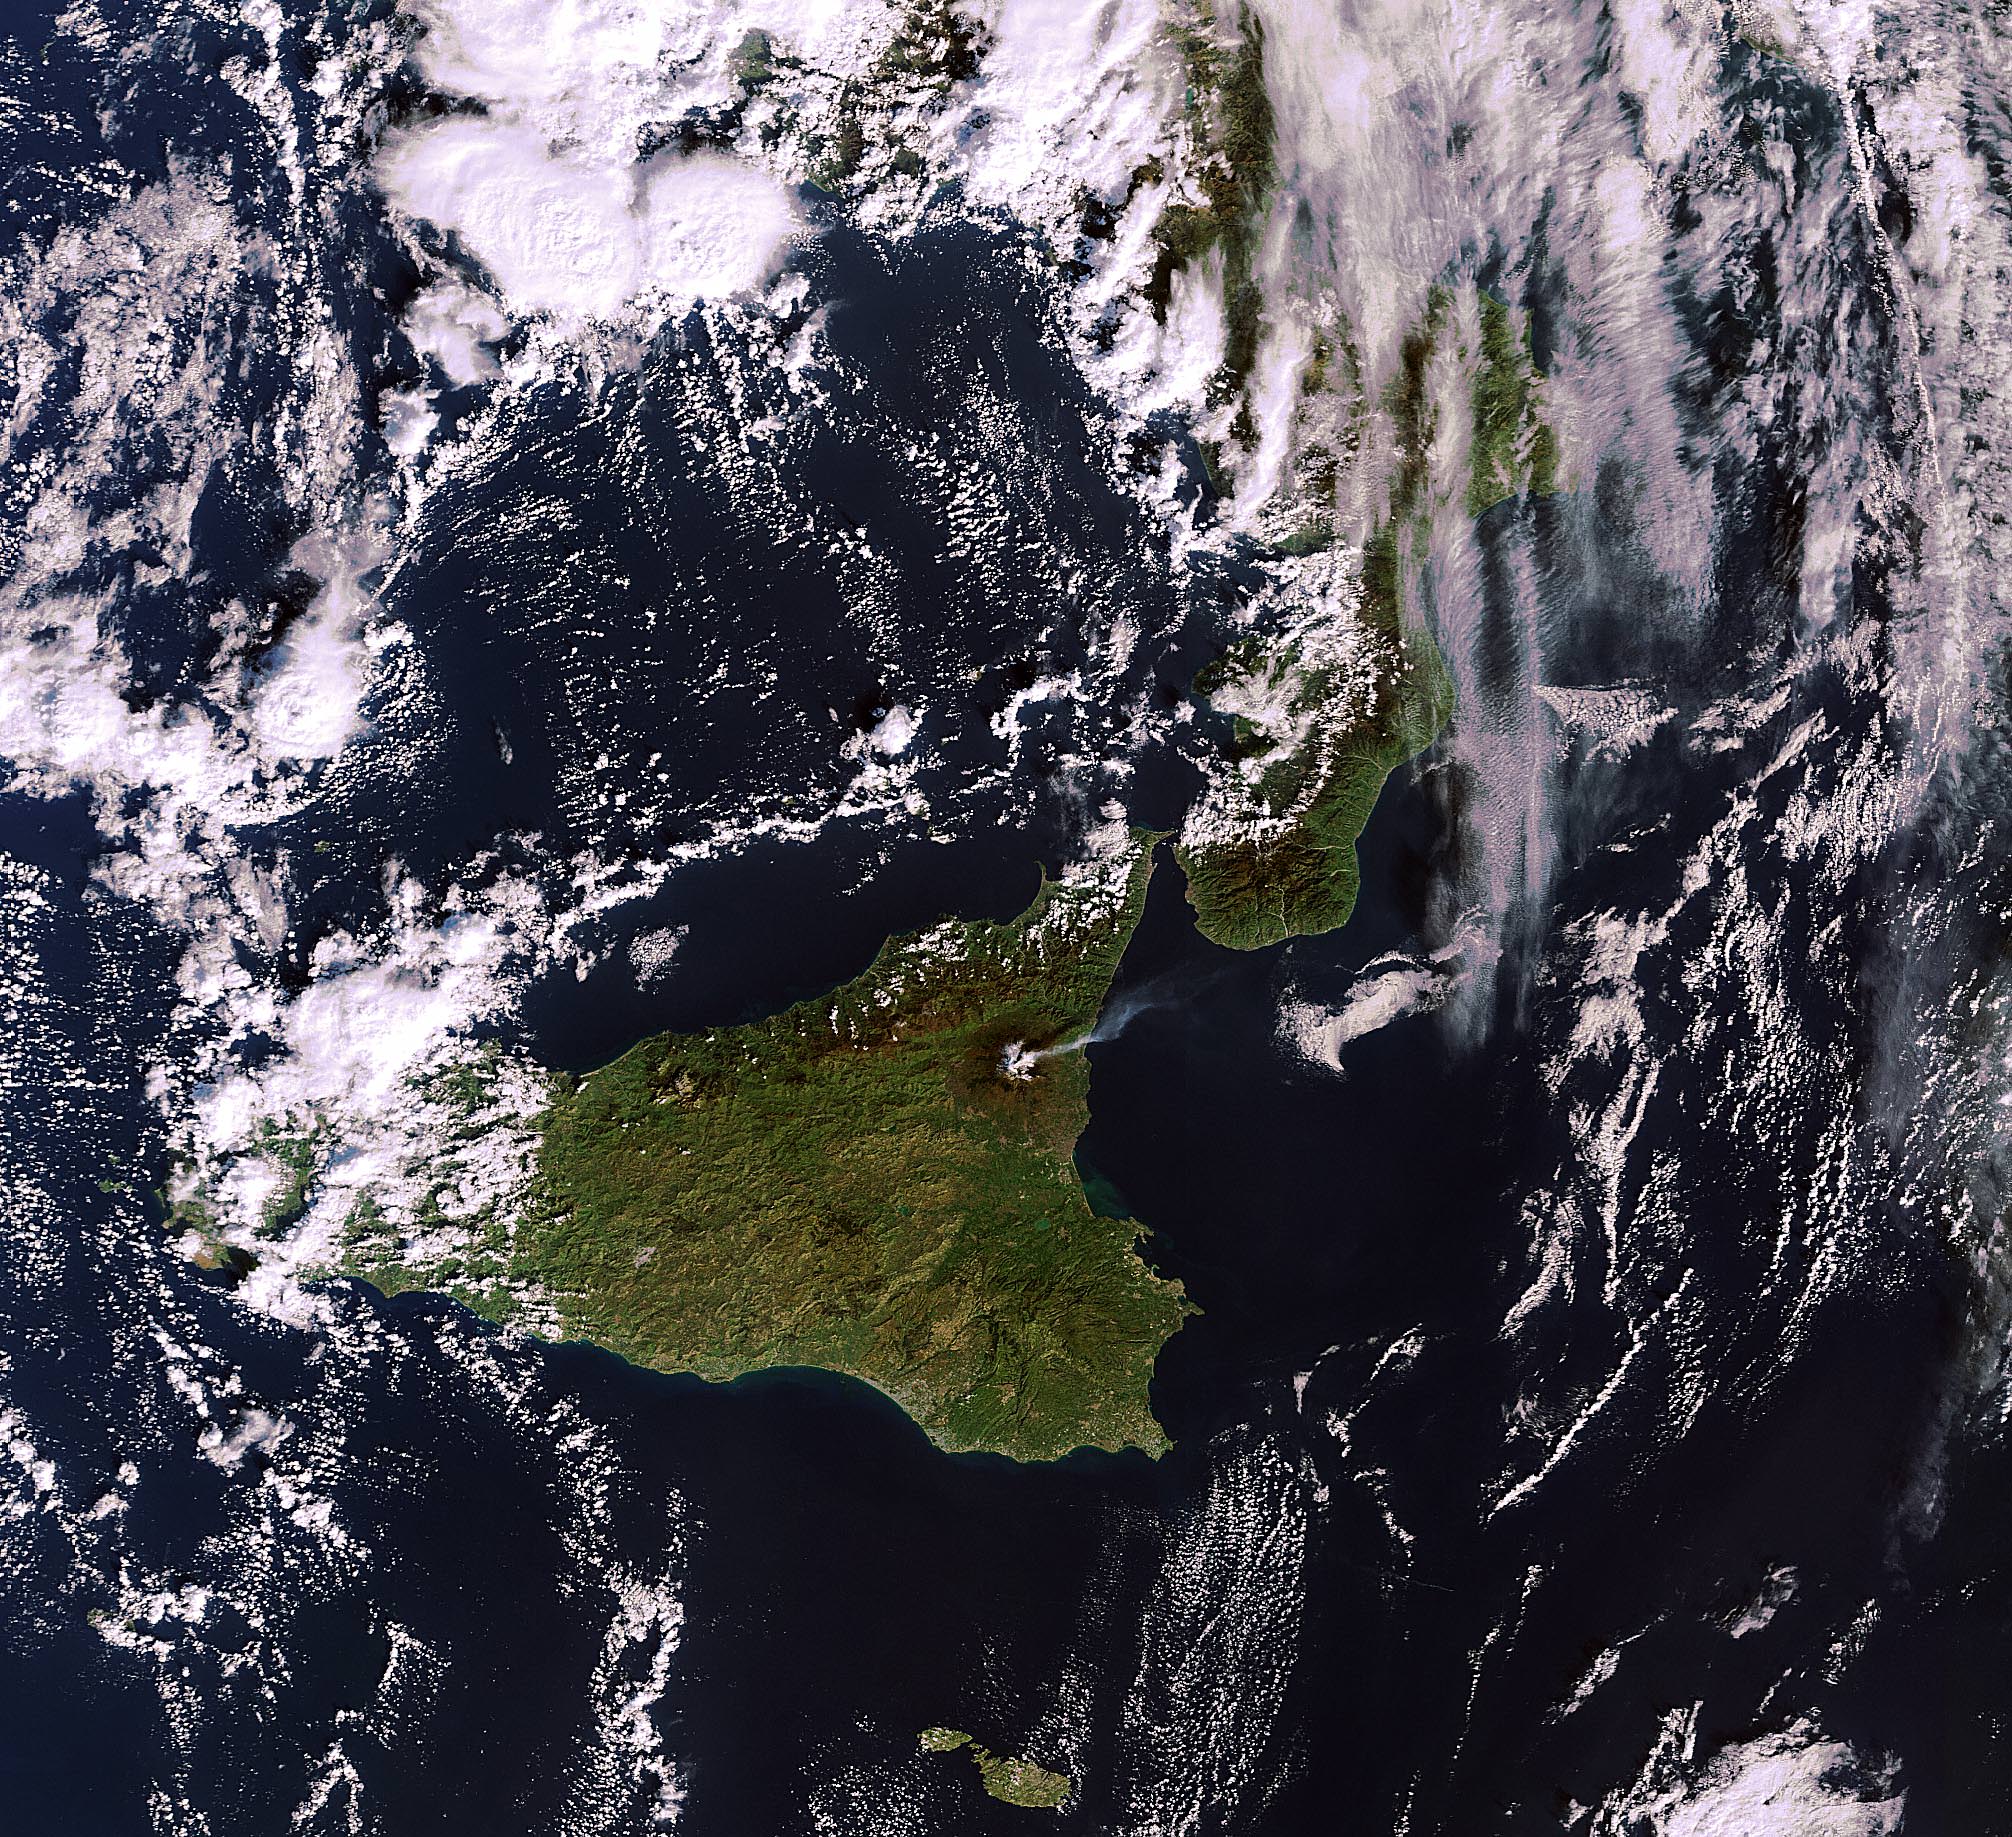
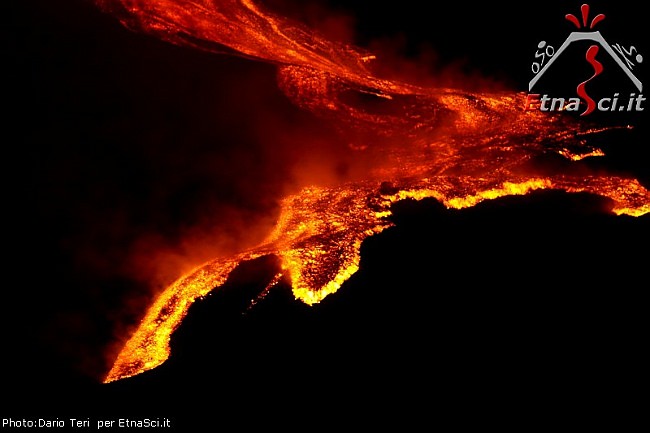
Volcanic eruptions at Mt. Etna from orbiting NASA Terra Satellite. Acquired on January 11, 2011. NASA Earth Observatory Image of the Day on January 15, 2011. Credit: NASA Terra Satellite
[/caption]
Spectacular eruptions from Mt Etna are spewing massive quantities of lava, smoke and ash many hundreds of meters high into the skies above the island of Sicily. Mt Etna is the most active volcano in Europe and one of the most active on all of Earth. The volcano rumbled to life again this week on the evening of January 12, 2011 and lit up the night sky. Mt Etna is 3350 meters high and located on the northeast coast of Sicily near the boot of Italy (see above, below).
Updated: comment or send me your Etna erupting photos/accounts to post below.
This fearsome natural wonder is providing an awe inspiring show from both Earth and Space. Local residents and lucky tourists nearby took stunning videos and photos (below) showing fountains of brilliant lava eruptions streaming mightily from the volcano.
This Envisat MERIS image, acquired on 11 January 2011, shows the plume of smoke billowing into the atmosphere from Mount Etna, Sicily, Italy. Activity gradually increased the following day, peaking in the evening. Credits: ESA
Click to Enlarge all images
Amazing photos from space were captured by Earth orbiting satellites from NASA and ESA. NASA’s Terra satellite took the above image on Jan. 11 as Mt Etna was spewing forth smoke or ash just prior to the volcanic eruptions on Jan. 12. The photo of Etna is NASA’s Earth Observatory Image of the Day, today, Jan. 15, 2011.
ESA’s Envisat likewise snapped a gorgeous view of the billowing plume of smoke rising to space (photo at left) and the international crew aboard the ISS, which currently includes Italian astronaut Paolo Nespoli. Perhaps he’ll send us a shot !
Local news and eyewitness accounts say that tremors from the volcano began increasing on Jan. 11. Emissions of volcanic gases and water vapor have been ongoing since late September 2010. The sounds of explosive tremors from deep inside were also detected months ago.
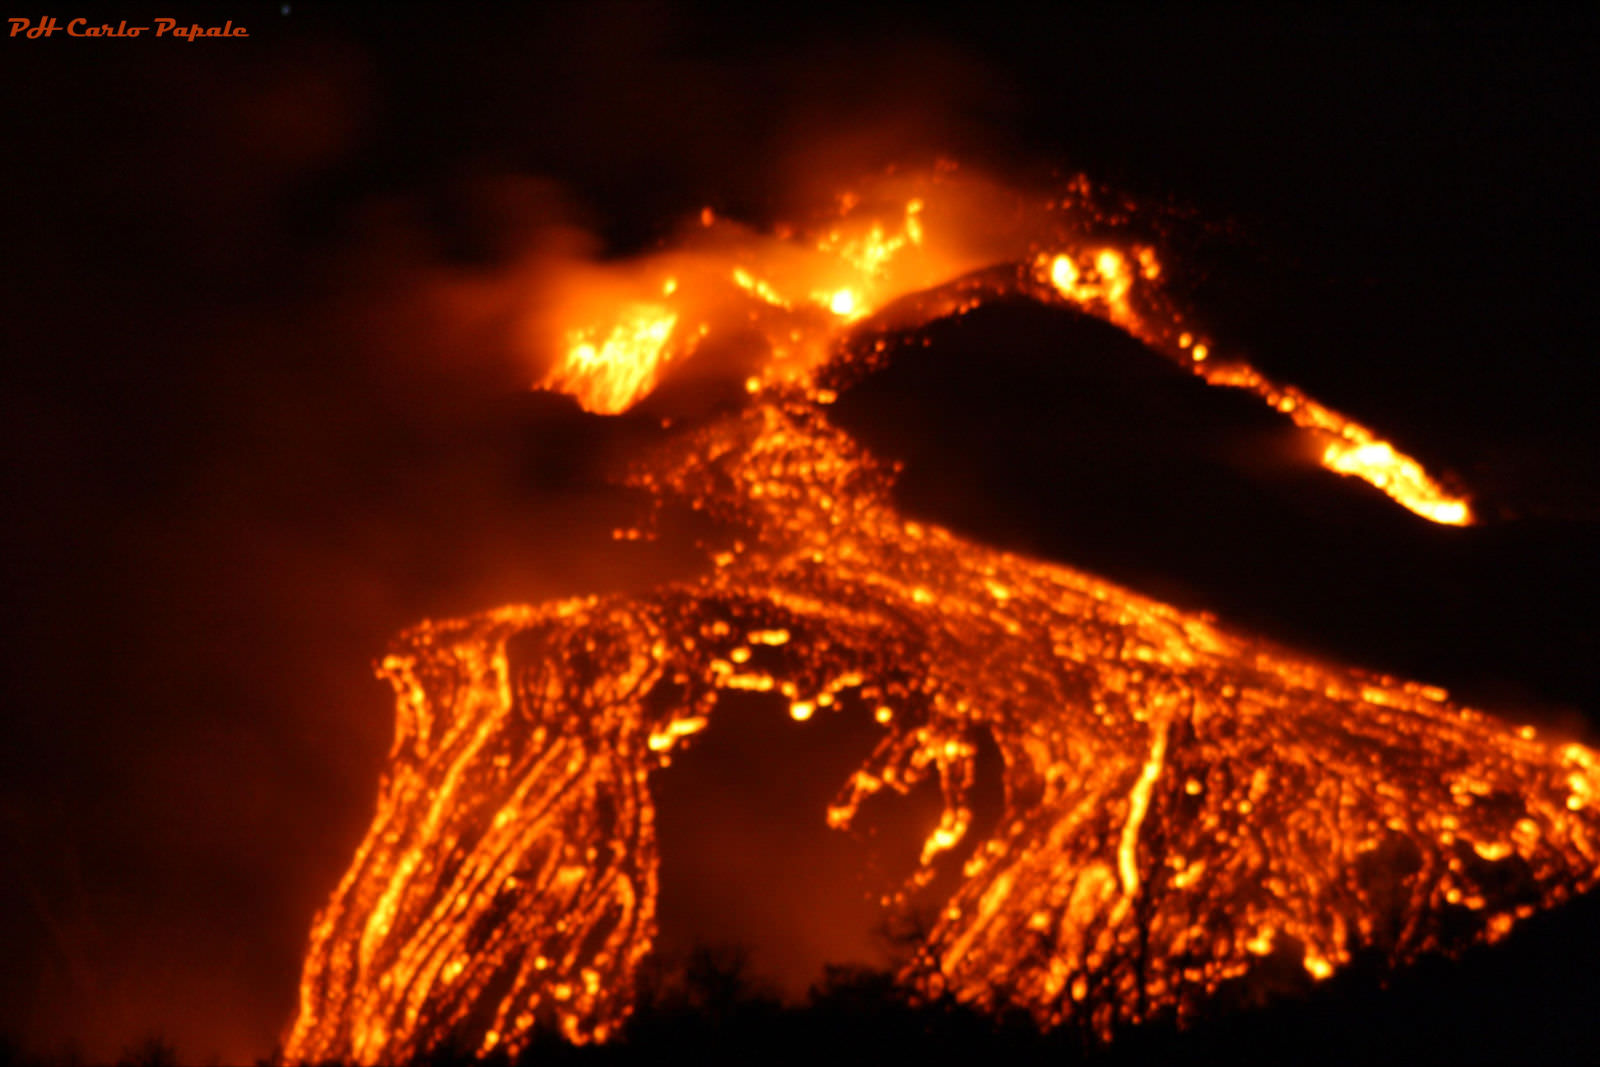
This sizzling hot video – “Etna at Maximum Activity” – is set to music and records the magnificent flowing streams of lava and the thunderous sounds of the crackling, explosive eruptions. Be sure to view at full screen, then just sit back and enjoy !
Plumes of volcanic ash from the eruptions spread across Sicily and forced the closure of the local Fontanarossa airport – nearby to the city of Catania, which is 24 kilometers away.
Rumblings of Mt Etna have been recorded in historical documents dating back to about 1500 BC.
Another short, dramatic video with the raw sounds of the eruption from a group of German tourists visiting the beautiful city of Taormina, Sicily
Eyewitness Description:
“Mount Etna erupted in the evening of January 12, 2011 for around four hours, providing an amazing scenery. We shot this unique video from Taormina on January 12, 2011 at 11.45 p.m. and uploaded it on YouTube.
On the evening of 11th January 2011 an increase in volcanic tremor was recorded at the summit of the volcano. The recorded seismic activity reached a peak at 7 a.m. on 12th January when the source moved from north of NE crater to the SE crater. The eruption started with strombolian explosive activity at SE crater at around 9.p.m. Lava overflowed the eastern rim of SE crater and fed a flow that moved toward the western wall of the Valle del Bove (Valley of the oxen), an ancient huge uninhabited depression on the NE side of the volcano.
The Sicilian communities near the volcano were not threatened by this latest fascinating eruption. Best place to watch the fascinating eruptions of Mount Etna is the town of Taormina, nestled on a hill at 220 meters / 722 feet above the sea level and at a safe linear distance of approx. 28 Km / 17,4 miles from the top craters of the Sicilian volcano.” Fearsome lava eruptions spewing from Mt Etna on Jan. 11, 2011
A few years back, I visited Mt Etna and was incredibly lucky to witness this spectacle of nature myself. It was an unforgettable experience to see the glowing red-orange colored lava flowing out from the bowels of the Earth. It was like a living being with circulating blood.
In the excitement, I did something that in retrospect was incredibly stupid. I stood on a ledge, perhaps 50 cm thick, right above the porthole of the scalding hot lava erupting from the earth beneath my feet. Many others did too.
Sicily is a lovely place of manmade and natural wonders. Don’t pass up an opportunity to see Etna aflame
Look at Etnaweb (in Italian, but Universal) for a fantastic collection of local photos and webcams of the eruption.
Volcanic eruptions are breathtaking events to behold. The residual plumes of smoke and ash can stay aloft for many years and can also effect how we see other astronomical events such as our view of solar and lunar eclipses.
For a more tranquil view of Earth and inspiration from Carl Sagan, click here
NASA’s Spirit robot is positioned next to an ancient and extinct volcanic feature on Mars. Learn more here
Can you envision a place hotter than Etna ? … A scorching, molten hellish world where the temperatures are unimaginably hot
Comment or send me your photos and eyewitness accounts of erupting Mt Etna
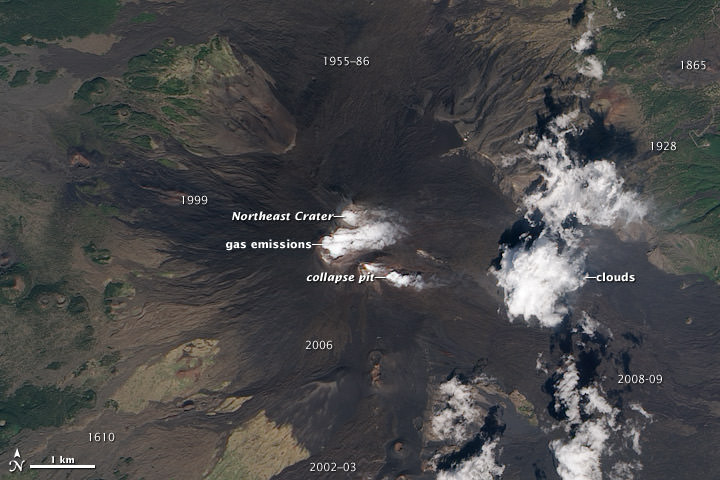
Signs of activity at the summit of Mount Etna, Europe’s most active volcano.
Water vapor and other volcanic gases overflow Etna’s summit craters, spilling out over the volcano’s upper slopes. A steam plume rises from a collapse pit that formed in late 2009, the newest volcanic feature on Etna. Dark lava flows from recent eruptions cover the peak, overlaying lighter, weathered flows from hundreds or thousands of years ago. (Numbers on the image indicate when a flow was erupted.) The oldest lavas are covered by green vegetation. Eruptive cones and fissures also dot the landscape. Frequent explosions deep within the Northeast Crater, which may presage an upcoming eruption, are audible at the summit. These explosions were occurring sporadically every few minutes, as recorded by nearby seismometers. This natural-color satellite image was acquired by the Advanced Land Imager (ALI) aboard (EO-1) on September 26, 2010.Mt Etna photographed by astronauts aboard the International Space Station on August, 2, 2006.
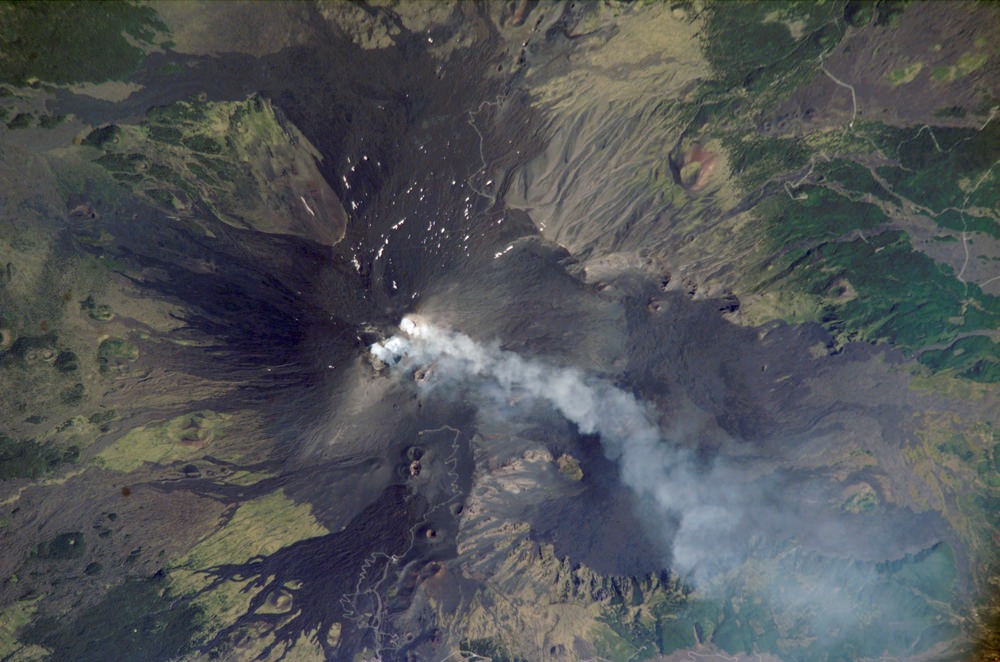
One of the most consistently active volcanoes in the world, Sicily’s Mount Etna has a historical record of eruptions dating back to 1500 BC. This astronaut photograph captures plumes of steam and possibly ash originating from summit craters on the mountain: the Northeast Crater and Central Crater, which includes two secondary craters (Voragine and Bocca Nuova). Locals heard explosions coming from the rim of the Northeast Crater on July 26, 2006, and the plumes shown in this image are likely a continuation of that activity. Credit: NASA.