What Is The Crab Nebula?

supernova explosion
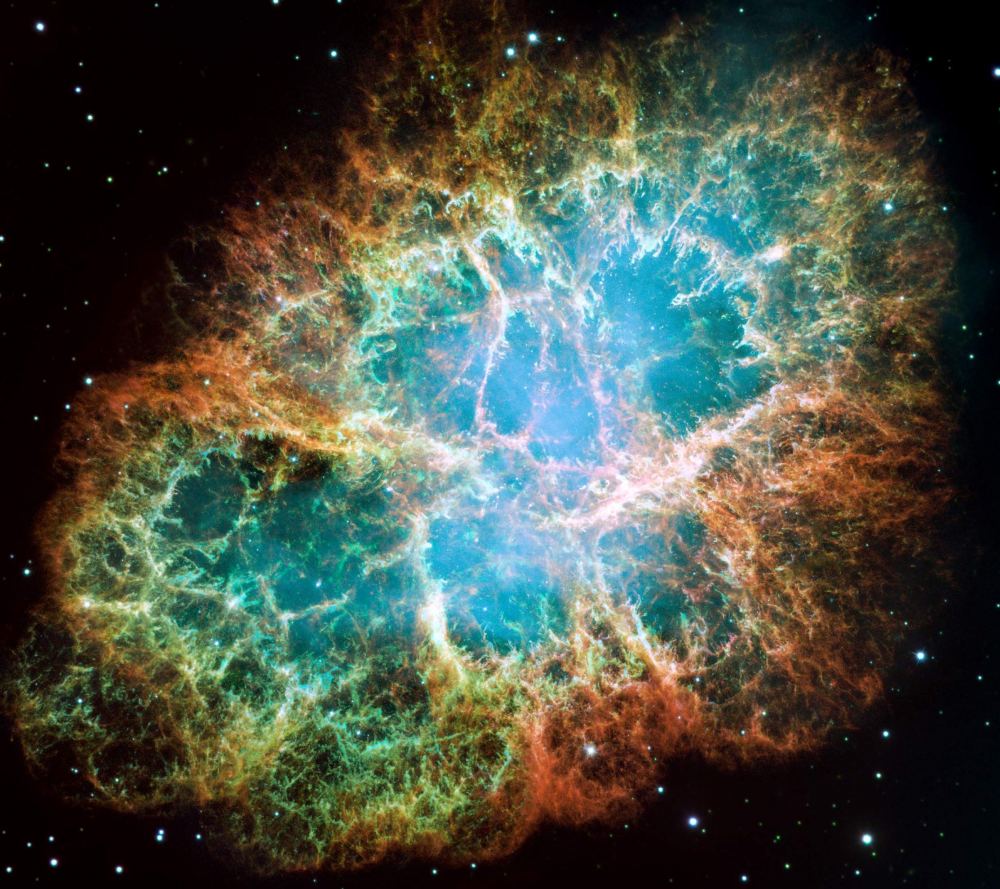
The Crab Nebula; at its core is a long dead star. Did early massive stars die in supernova explosions like this? Image credit: NASA, ESA, J. Hester and A. Loll (Arizona State University)

The Crab Nebula, or M1 (the first object in Messier’s famous catalog), is a supernova remnant and pulsar wind nebula. The name – Crab Nebula – is due to the Earl of Rosse, who thought it looked like a crab; it’s not in the constellation Cancer (the Crab), rather Taurus (the Bull).

The supernova which gave rise to the Crab Nebula was seen widely here on Earth in 1054 (and so it’s called SN 1054 by astronomers); it is perhaps the most famous of the historical supernovae. It is certainly one of the brightest (estimated to be –7 at peak), partly because it is so close (only 6,300 light-years away), and partly because it’s not hidden by dust clouds. The expansion of the nebula – as in seen-to-be-getting-bigger, rather than the-gas-is-moving-very-fast – was first confirmed in 1930.

As it was a core collapse supernova (a massive star which ran out of fuel), it left behind a neutron star; by chance, we are in line with its ‘lighthouse beam’, so we see it as a pulsar (all young neutron stars are pulsars, but not all of them have beams which point to us in one part of the cycle). It’s a pretty fast pulsar; the neutron star rotates once every 33 milliseconds. Because it’s so young and so close, the Crab Nebula pulsar was the first to be detected in the visual waveband, and also in x-rays and gamma rays. Being the source of the tremendous output of energy, from both the pulsar wind nebula and the pulsar itself, and as energy is conserved, the pulsar is slowing down, at a rate of 15 microseconds per year.

The inner part of the Crab Nebula, the pulsar wind nebula, contains lots of really hot (‘relativistic’) electrons spiraling around magnetic fields; this creates the eerie blue glow … synchrotron radiation. This makes the Crab Nebula one of the brightest objects in the x-ray and gamma ray region of the electromagnetic spectrum, and as it is a relatively steady source (unlike most high energy objects) it has given its name to a new astronomical unit, the Crab. For example, a new x-ray source may be 2 mCrab (milli-Crab), meaning 0.002 times as strong an x-ray source as the Crab Nebula.

This SEDS page has a lot more information on the Crab Nebula, both historical and contemporary.

Such an intensively studied object, no wonder there are lots of Universe Today stories on it; for example Nearly a Thousand Years After the Death of a Star, Giant Hubble Mosaic of the Crab Nebula, The Peculiar Pulsar in the Crab Nebula, Astronomers Locate High Energy Emissions from the Crab Nebula, and Evidence of Supernovae Found in Ice Core Sample.

Astronomy Cast’s Neutron Stars and Their Exotic Cousins has more on pulsars, and Nebulae more on nebulae.

Sources: Caltech Astronomy, SEDS, Stanford University SLAC

Chandrasekhar Limit

Subrahmanyan Chandrasekhar (credit: University of Chicago Press)

[/caption]
When a human puts on too much weight, there is an increased risk of heart attack; when a white dwarf star puts on too much weight (i.e. adds mass), there is the mother of all fatal heart attacks, a supernova explosion. The greatest mass a white dwarf star can have before it goes supernova is called the Chandrasekhar limit, after astrophysicist Subrahmanyan Chandrasekhar, who worked it out in the 1930s. Its value is approx 1.4 sols, or 1.4 times the mass of our Sun (the exact value depends somewhat on the white dwarf’s composition how fast it’s spinning, etc).

White dwarfs are the end of the road for most stars; once they have used up all their available hydrogen ‘fuel’, low mass stars shed their outermost shells to form planetary nebulae, leaving a high density core of carbon, oxygen, and nitrogen (that’s a summary, it’s actually a bit more complicated). The star can’t collapse further because of electron degeneracy pressure, a quantum effect that comes from the fact that electrons are fermions (technically, only two fermions can occupy a given energy state, one spin up and one spin down).

So what happens in the core of a massive star, one whose core weighs in at more than 1.4 sols? As long as the star is still ‘burning’ nuclear fuel – helium, then carbon etc, then neon, then … – the core will not collapse because it is very hot (electron degeneracy pressure won’t hold it up ’cause it’s too massive). But once the core gets to iron, no more burning is possible, and the core will collapse, spectacularly, producing a core collapse supernova.

There is a way a white dwarf can go out with a bang rather than a whimper; by getting a little help from a friend. If the white dwarf has a close binary companion, and if that companion is a giant star, some of the hydrogen in its outer shell may end up on the white dwarf’s surface (there are several ways this can happen). The white dwarf thus adds mass, and every so often the thin hydrogen envelope blows up, and we see a nova. One day, though, the extra mass may put it over the limit, the Chandrasekhar limit … the temperature in its center gets high enough that the carbon ‘ignites’, the ‘flame’ spreads throughout the star, and it becomes a special kind of supernova, a Ia supernova.

For more technical details of the Chandrasekhar limit, Richard Fitzpatrick of the University of Texas at Austin has an online Thermodynamics & Statistical Mechanics course, which includes a page on the Chandrasekhar limit.

Supernovae are very important to astronomy, so you won’t be surprised to learn that there are lots of Universe Today stories on the Chandrasekhar limit! Some examples: White Dwarf Theories Get More Proof, White Dwarf “Close” to Exploding as Supernova, and Colliding White Dwarfs Caused a Powerful Supernova.

Astronomy Cast Episode 90 (The Scientific Method) includes a look at how Chandrasekhar worked out the limit that now bears his name, and Where Do Stars Go When They Die? also covers this topic.

References:
Wikipedia
http://www.bluffton.edu/~bergerd/NSC_111/stars.html

Hunt for Supernovae With Galaxy Zoo

How would you like to find a supernova? I can’t think of anyone who wouldn’t be proud to say they have spotted an exploding star. And now, perhaps you can – and without all the work of setting up your telescope and staying up all night (well, that can be fun, too, but…). The great folks who brought you Galaxy Zoo have now partnered with the Palomar Transient Factory to offer the public a chance to hunt and click for supernovae from the comfort of your own computer. And yes, you can still classify galaxies at Galaxy Zoo, but now you can search for for the big guns out in space, too. Sound like fun?

The Palomar Transient Facory uses the famous Palomar Observatory and the Samuel Oschin 1.2 m telescope to look for anything that’s changing in the sky — whether it’s a variable star, an asteroid moving across the sky, the flickering of an active galaxy’s nucleus or a supernova. For now, though, the partnership with Galaxy Zoo will concentrate on finding supernovae, and in particular Type 1A supernovae.

According to Scott Kardel of the Palomar Observatory, “the quantity and quality of the new data that’s been coming in are absolutely mind blowing for astronomers working in this field. On one recent night PTF patrolled a section of the sky about five times the size of the Big Dipper and found eleven new objects.” For the supernova search, it returns to the same galaxies twice a night, every five nights.

That’s where the Zooites from Galaxy Zoo come in: searching through all specially chosen PTF data and looking for supernovae.

“Your task is to search through the candidates found by PTF” said the Galaxy Zoo team. “Waiting for your results are two intrepid Oxford astronomers, Mark and Sarah, who have travelled out to the Roque de los Muchachos Observatory on the Canary Island of La Palma. They have time allocated on the 4.2m William Herschel Telescope to follow up the best of our discoveries.”

Check out Galaxy Zoo’s Supernova page for more info and to sign up to be part of this exciting new Citizen Science project!

For more info on the Palomar Transient Factory, listen to Scott Kardel’s 365 Days of Astronomy podcast.

Variability in Type 1A Supernovae Has Implications for Studying Dark Energy

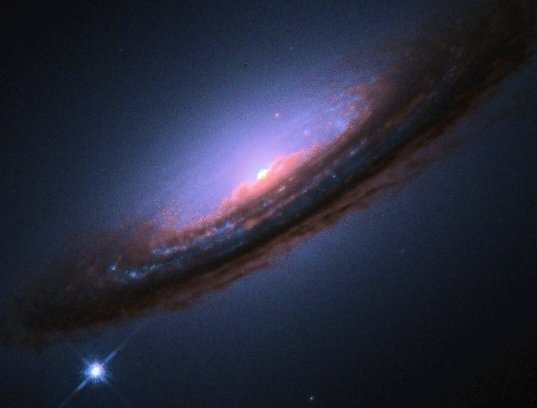
A Hubble Space Telescope-Image of Supernova 1994D (SN1994D) in galaxy NGC 4526 (SN 1994D is the bright spot on the lower left). Image Credit:HST

[/caption]

The discovery of dark energy, a mysterious force that is accelerating the expansion of the universe, was based on observations of type 1a supernovae, and these stellar explosions have long been used as “standard candles” for measuring the expansion. But not all type 1A supernovae are created equal. A new study reveals sources of variability in these supernovae, and to accurately probe the nature of dark energy and determine if it is constant or variable over time, scientists will have to find a way to measure cosmic distances with much greater precision than they have in the past.

“As we begin the next generation of cosmology experiments, we will want to use type 1a supernovae as very sensitive measures of distance,” said lead author Daniel Kasen, of a study published in Nature this week. “We know they are not all the same brightness, and we have ways of correcting for that, but we need to know if there are systematic differences that would bias the distance measurements. So this study explored what causes those differences in brightness.”

Kasen and his coauthors–Fritz Röpke of the Max Planck Institute for Astrophysics in Garching, Germany, and Stan Woosley, professor of astronomy and astrophysics at UC Santa Cruz–used supercomputers to run dozens of simulations of type 1a supernovae. The results indicate that much of the diversity observed in these supernovae is due to the chaotic nature of the processes involved and the resulting asymmetry of the explosions.

For the most part, this variability would not produce systematic errors in measurement studies as long as researchers use large numbers of observations and apply the standard corrections, Kasen said. The study did find a small but potentially worrisome effect that could result from systematic differences in the chemical compositions of stars at different times in the history of the universe. But researchers can use the computer models to further characterize this effect and develop corrections for it.

A type 1a supernova occurs when a white dwarf star acquires additional mass by siphoning matter away from a companion star. When it reaches a critical mass–1.4 times the mass of the Sun, packed into an object the size of the Earth–the heat and pressure in the center of the star spark a runaway nuclear fusion reaction, and the white dwarf explodes. Since the initial conditions are about the same in all cases, these supernovae tend to have the same luminosity, and their “light curves” (how the luminosity changes over time) are predictable.

Some are intrinsically brighter than others, but these flare and fade more slowly, and this correlation between the brightness and the width of the light curve allows astronomers to apply a correction to standardize their observations. So astronomers can measure the light curve of a type 1a supernova, calculate its intrinsic brightness, and then determine how far away it is, since the apparent brightness diminishes with distance (just as a candle appears dimmer at a distance than it does up close).

The computer models used to simulate these supernovae in the new study are based on current theoretical understanding of how and where the ignition process begins inside the white dwarf and where it makes the transition from slow-burning combustion to explosive detonation.

The simulations showed that the asymmetry of the explosions is a key factor determining the brightness of type 1a supernovae. “The reason these supernovae are not all the same brightness is closely tied to this breaking of spherical symmetry,” Kasen said.

The dominant source of variability is the synthesis of new elements during the explosions, which is sensitive to differences in the geometry of the first sparks that ignite a thermonuclear runaway in the simmering core of the white dwarf. Nickel-56 is especially important, because the radioactive decay of this unstable isotope creates the afterglow that astronomers are able to observe for months or even years after the explosion.

“The decay of nickel-56 is what powers the light curve. The explosion is over in a matter of seconds, so what we see is the result of how the nickel heats the debris and how the debris radiates light,” Kasen said.

Kasen developed the computer code to simulate this radiative transfer process, using output from the simulated explosions to produce visualizations that can be compared directly to astronomical observations of supernovae.

The good news is that the variability seen in the computer models agrees with observations of type 1a supernovae. “Most importantly, the width and peak luminosity of the light curve are correlated in a way that agrees with what observers have found. So the models are consistent with the observations on which the discovery of dark energy was based,” Woosley said.

Another source of variability is that these asymmetric explosions look different when viewed at different angles. This can account for differences in brightness of as much as 20 percent, Kasen said, but the effect is random and creates scatter in the measurements that can be statistically reduced by observing large numbers of supernovae.

The potential for systematic bias comes primarily from variation in the initial chemical composition of the white dwarf star. Heavier elements are synthesized during supernova explosions, and debris from those explosions is incorporated into new stars. As a result, stars formed recently are likely to contain more heavy elements (higher “metallicity,” in astronomers’ terminology) than stars formed in the distant past.

“That’s the kind of thing we expect to evolve over time, so if you look at distant stars corresponding to much earlier times in the history of the universe, they would tend to have lower metallicity,” Kasen said. “When we calculated the effect of this in our models, we found that the resulting errors in distance measurements would be on the order of 2 percent or less.”

Further studies using computer simulations will enable researchers to characterize the effects of such variations in more detail and limit their impact on future dark-energy experiments, which might require a level of precision that would make errors of 2 percent unacceptable.

Source: EurekAlert

New Technique Finds Farthest Supernovae

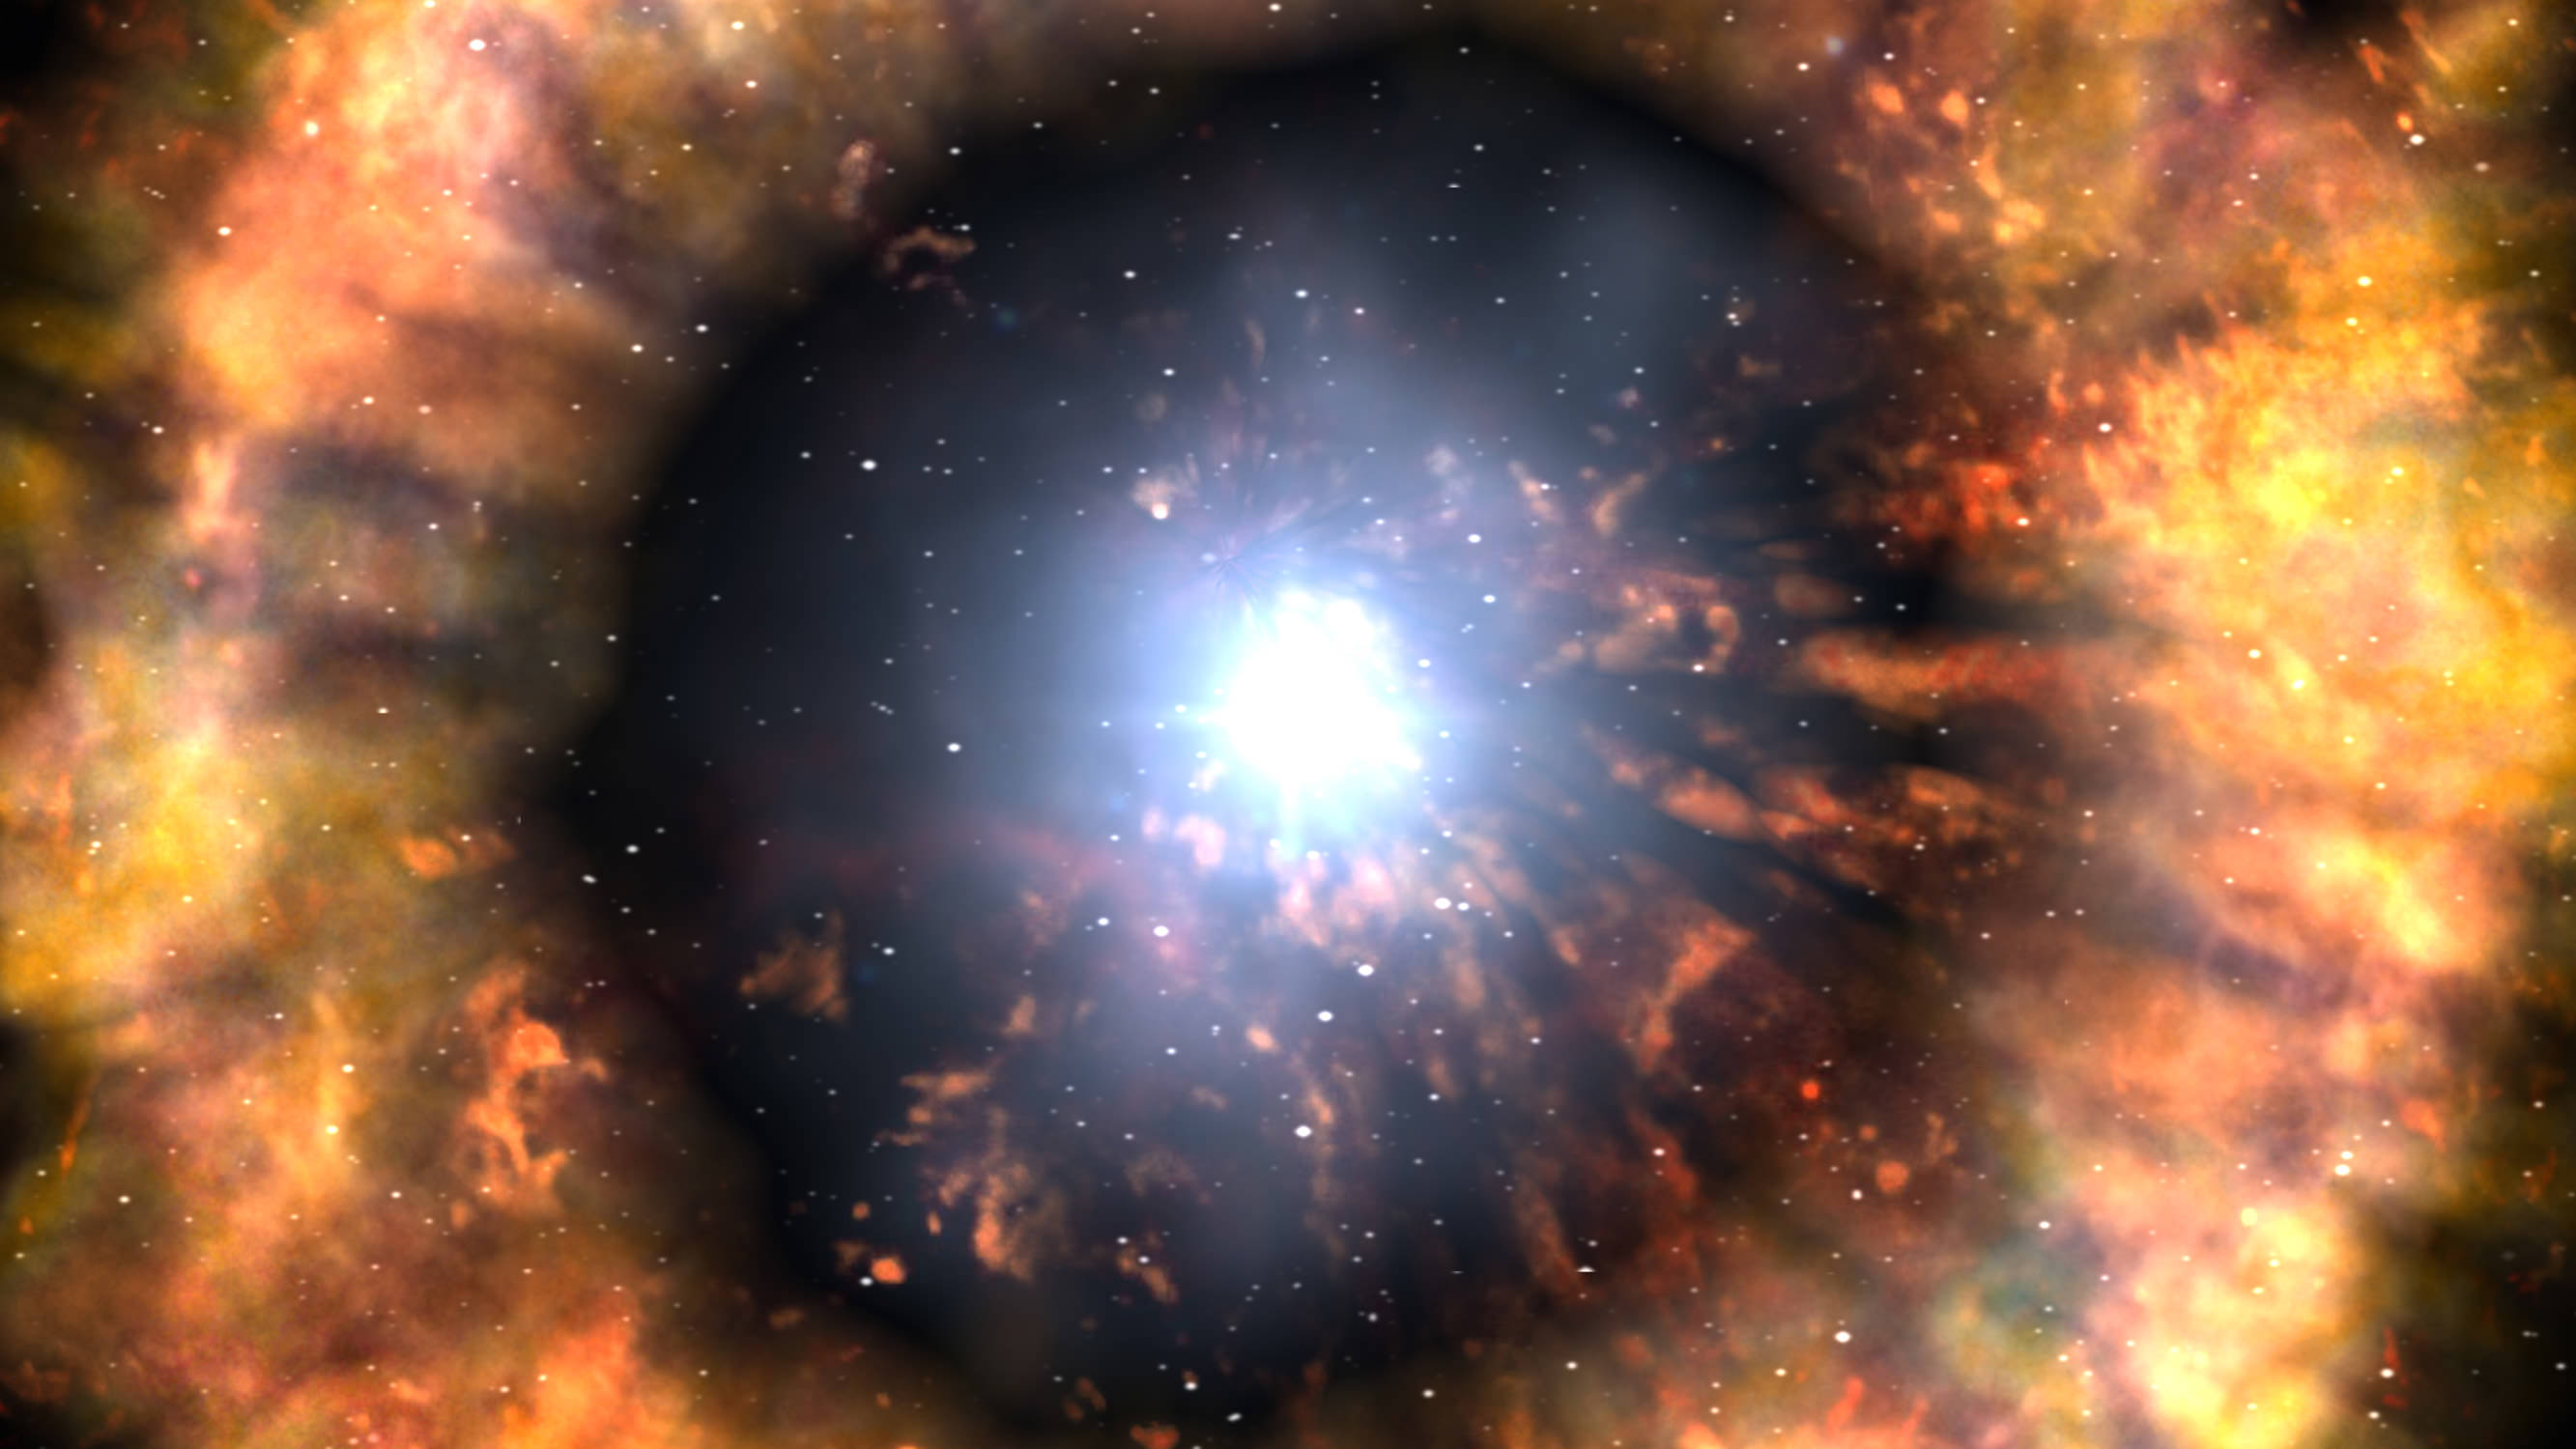
This artist’s impression of a supernova shows the layers of gas ejected prior to the final deathly explosion of a massive star. Credit: NASA/Swift/Skyworks Digital/Dana Berry

[/caption]
Two of the farthest supernovae ever detected have been found by using a new technique that could help find other dying stars at the edge of the universe. The two cosmic blasts occurred 11 billion years ago. The next-farthest large supernova known occurred about 6 billion years ago. Jeff Cooke from the University of California Irvine said this new method has the potential to allow astronomers to study some of the very first supernovae and will advance the understanding of how galaxies form, how they change over time and how Earth came to be.

A supernova occurs when a massive star (more than eight times the mass of the sun) dies in a powerful, bright explosion. Cooke studies larger stars (50 to 100 times the mass of the sun) that blow part of their mass into their surroundings before they die. When they finally explode, the nearby matter glows brightly for years.

Typically, cosmologists find supernovae by comparing pictures taken at different times of the same swath of sky and looking for changes. Any new light could indicate a supernova.

Cooke built upon this idea. He blended pictures taken over the course of a year, then compared them with image compilations from other years.

“If you stack all of those images into one big pile, then you can reach deeper and see fainter objects,” Cooke said. “It’s like in photography when you open the shutter for a long time. You’ll collect more light with a longer exposure.”

This image shows the host galaxy containing one of the newly discovered supernovae.  Comparing the images shows how the galaxy visibly brightens in 2004 and then returns to normal. This suggested that in 2003 the supernova was not detected; it appeared in 2004 and was beginning to fade in 2005.  The last frame subtracts the images from the years that the supernova was not detected as well as the galaxy’s light to reveal only the supernova. Credit: Jeff Cooke/CFHT
This image shows the host galaxy containing one of the newly discovered supernovae. Comparing the images shows how the galaxy visibly brightens in 2004 and then returns to normal. This suggested that in 2003 the supernova was not detected; it appeared in 2004 and was beginning to fade in 2005. The last frame subtracts the images from the years that the supernova was not detected as well as the galaxy’s light to reveal only the supernova. Credit: Jeff Cooke/CFHT

This image shows the host galaxy containing one of the newly discovered supernovae. Comparing the images shows how the galaxy visibly brightens in 2004 and then returns to normal. This suggested that in 2003 the supernova was not detected; it appeared in 2004 and was beginning to fade in 2005. The last frame subtracts the images from the years that the supernova was not detected as well as the galaxy’s light to reveal only the supernova. Credit: Jeff Cooke/CFHT

Doing this with images from the Cooke found four objects that appeared to be supernovae. He used a Keck telescope to look more closely at the spectrum of light each object emitted and confirmed they were indeed supernovae.

“The universe is about 13.7 billion years old, so really we are seeing some of the first stars ever formed,” Cooke said.

Cooke’s paper is published in the journal Nature on July 9.

Source: UC-Irvine