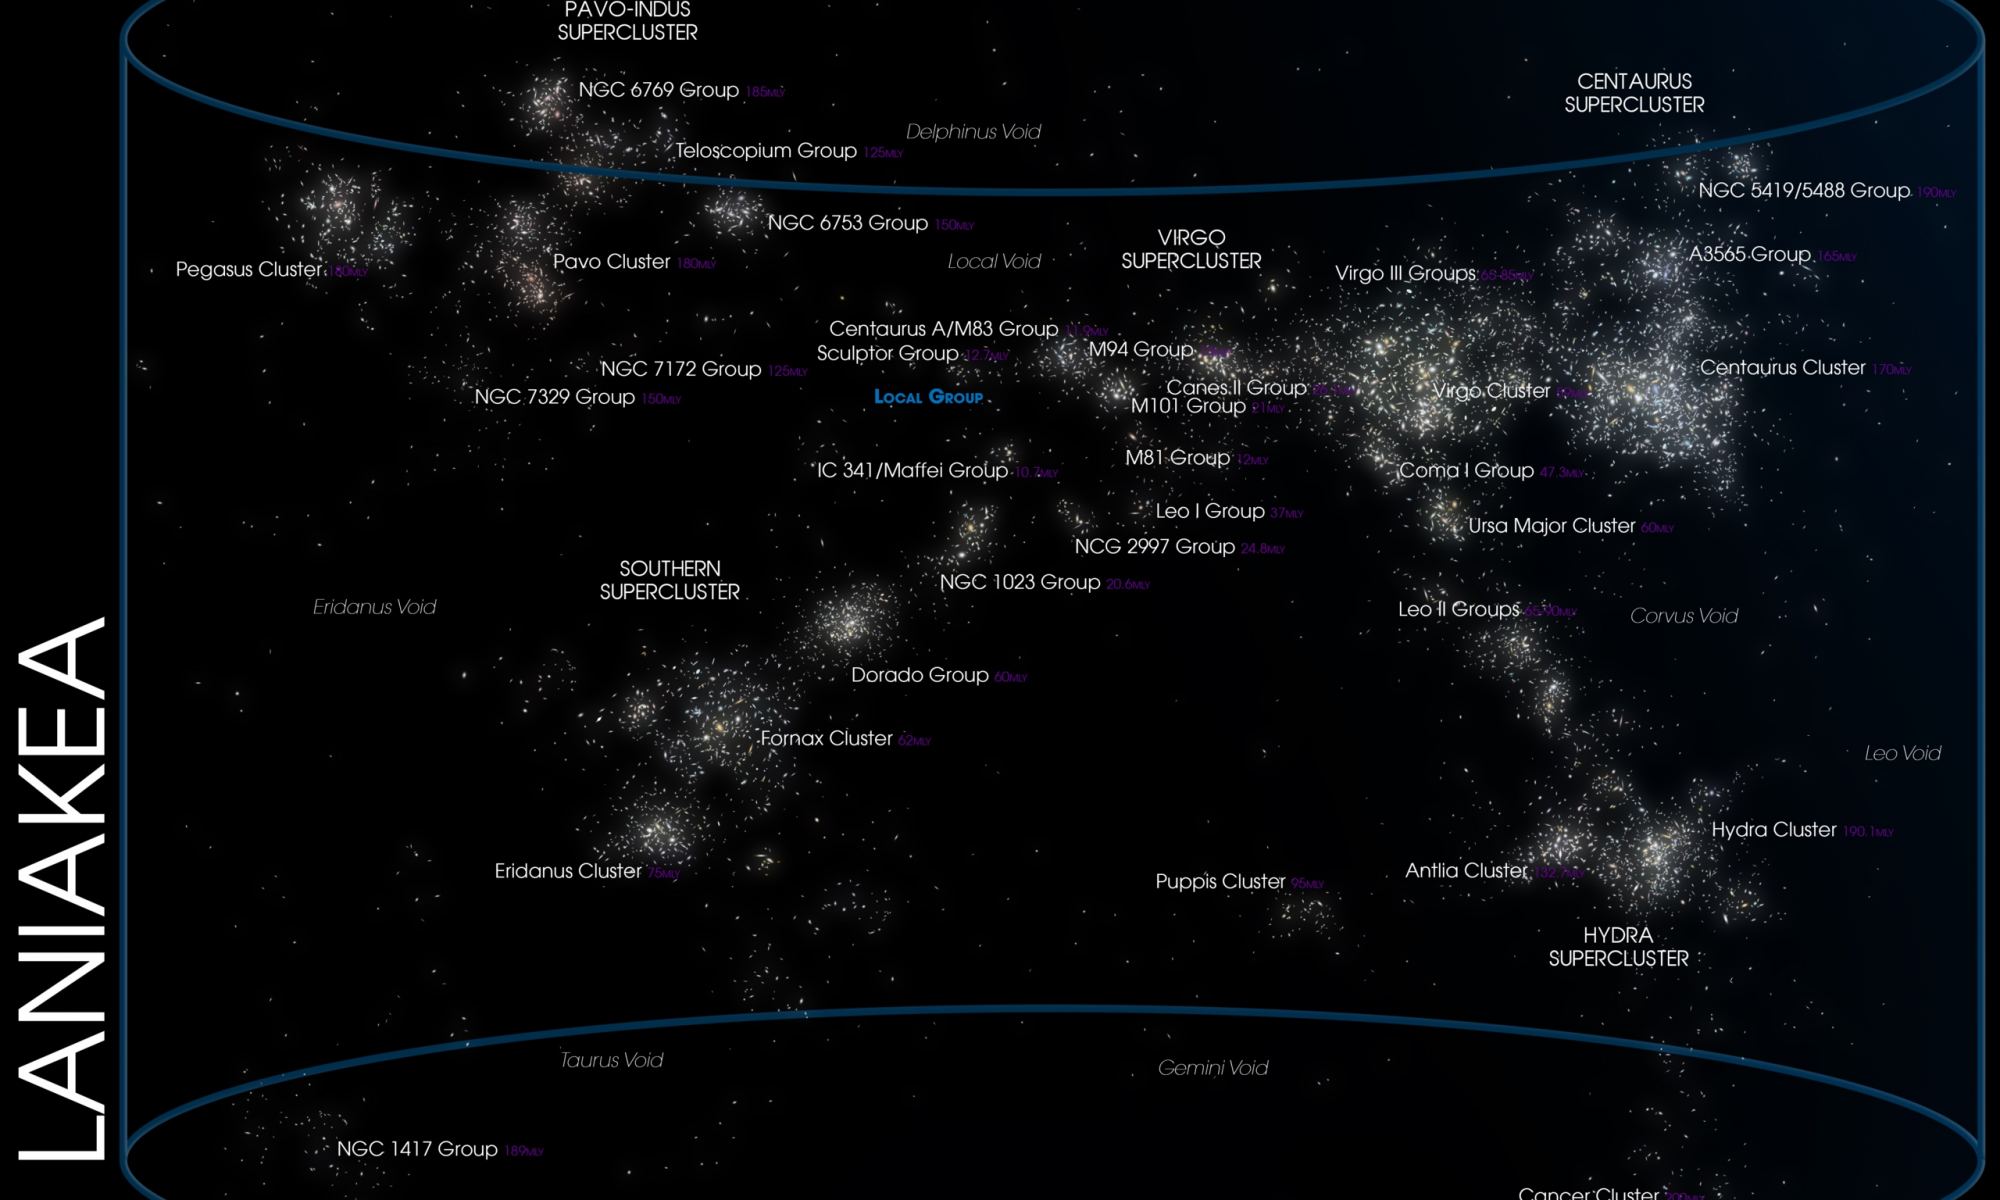
Illustration of the Laniakea Supercluster. Credit: Andrew Z. Colvin
By eye, it’s impossible to pick out the exact boundaries of the superclusters, which are among the largest structures in the universe. But that’s because they are not defined by their edges, but by the common motion of their components.
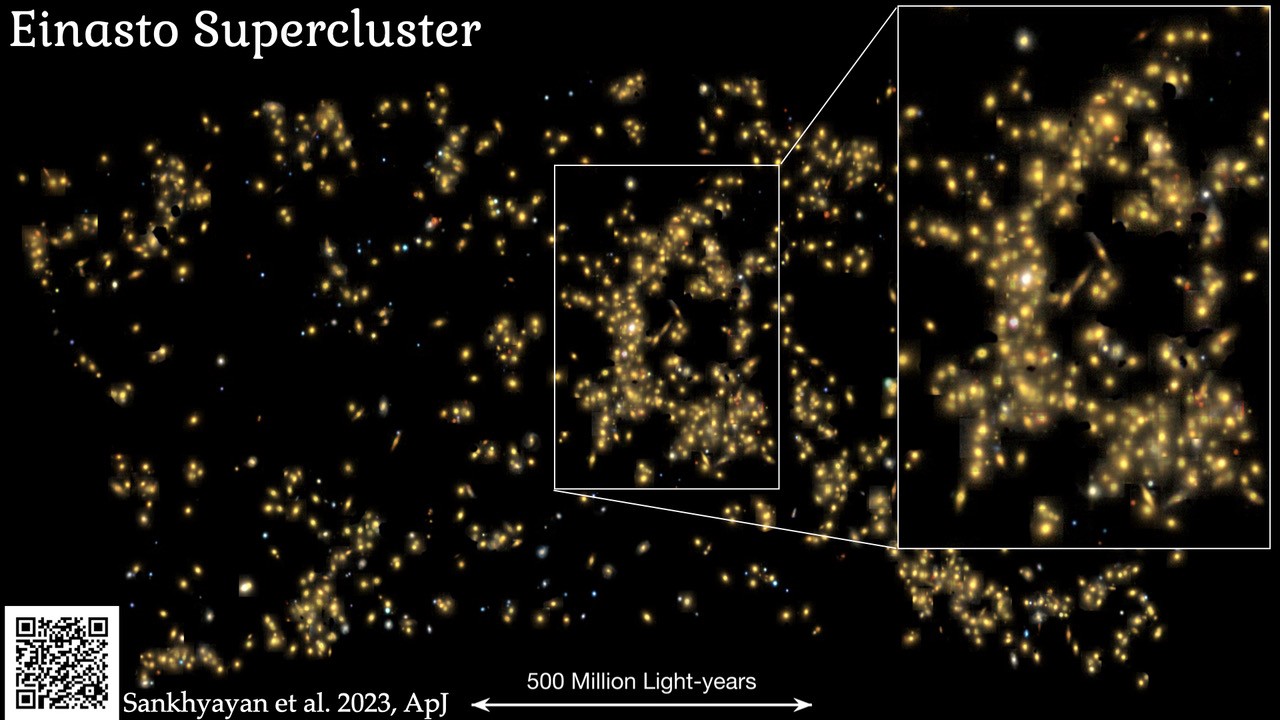
The Earth’s place in space is a fairly familiar one with it orbiting an average star. The star – our Sun – orbits the centre of our Galaxy the Milky Way. From here onwards, the story is less well known. The Milky Way is part of a large structure called the Laniakea Supercluster which is 250 million light years across! That really is a whacking great area of space and it contains at least 100,000 galaxies. There are larger superclusters though like the newly discovered Einasto Supercluster which measures an incredible 360 million light years across and is home to 26 quadrillion stars!
A false-color image of the far-infrared emission from a massive protocluster of galaxies (in the circle) dating from the epoch about 1.4 billion years after the big bang. Astronomers have completed deep optical and infrared observations of the complex and concluded that the star formation processes at work, although exceptionally active, generally seem to follow the same processes seen in our galaxy. Credit: NASA/ESA/Herschel; Miller et al.
A newly discovered supercluster of galaxies is so distant that astronomers say its light has been traveling for over twelve billion years to reach telescopes on Earth. But this cluster, named SPT2349 ?56 is gigantic, and so old that it is actually classified as a proto-cluster of galaxies, meaning it might be one of the earliest large clusters of galaxies in our Universe. It is also one of the most actively star-forming proto-clusters known.
Clearly I need to learn to be more specific when I write these articles. Everything time I open my mouth, I need to prepare for the collective imagination of the viewers.
We did a whole article about the biggest things in the Universe, and identified superclusters of galaxies as the best candidate. Well, the part of superclusters actually gravitationally bound enough to eventually merge together in the future. But you had other ideas, including dark energy, or the Universe itself as the biggest thing. Even love? Aww.
One intriguing suggestion, though, is the idea of the vast cosmic voids between galaxies. Hmm, is the absence of something a thing? Whoa, time to go to art school and talk about negative space.
Ah well, who cares? It’s a super interesting topic, so let’s go ahead and talk about voids.
When most people imagine the expansion of the Universe after the Big Bang, they probably envision an equally spaced smattering of galaxies zipping away from one another. And that’s pretty accurate at the smallest scales.
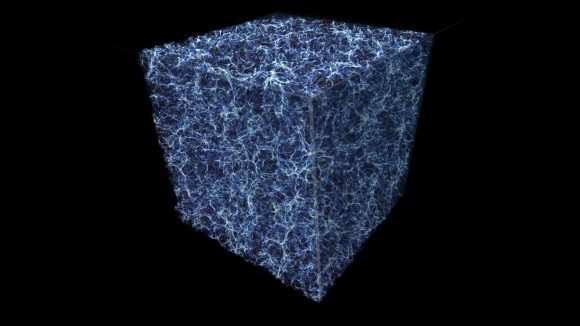
Credit: NASA, ESA, and E. Hallman (University of Colorado, Boulder)
But at the largest scales, like when you can see billions of light-years in a cube that fits on your computer screen, then a larger structure starts to take shape.
It looks less like an explosion, and more like a tasty tasty sponge cake, with huge filaments, walls, and the vast gaps in between. The gaps, the voids, the supervoids, are the point of today’s article, but to understand the gaps, we’ve got to understand why the Universe is clumped up the way it is.
Run the Universe clock backwards, all the way to the beginning, to a fraction of a second after the Big Bang. When the entire cosmos was compressed down into a tiny region of superheated plasma.
Although it was mostly uniform in density, there were slight variations – quantum fluctuations in spacetime itself. And as the Universe expanded, those differences were magnified. What started out as tiny differences in the density of matter at the smallest scale, turned into regions of higher and lower density of matter in the Universe.
Here we are, 13.8 billion years after the Big Bang, and we can see how the microscopic variations at the beginning of time were magnified to the largest scales. Instead of individual galaxies, we see huge walls containing thousands of galaxies; filaments of galaxies connect in nodes. These structures are huge; hundreds of millions of light-years across, containing thousands of galaxies. But the gaps, the voids, between these clusters can be even larger.
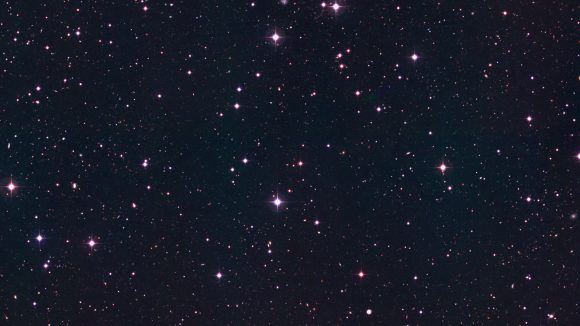
Astronomers first started thinking about these voids back in the 1970s, when the first large-scale surveys of the Universe were made. By measuring the redshift of galaxies, and determining how fast they were speeding away from us, astronomers started to realize that the distribution of galaxies wasn’t even.
Red-shifted galaxies. Credit: ESO
Some galaxies were relatively close, but then there were huge gaps in distance, and then another cluster of galaxies collected together.
Over the last few decades, astronomers have built sophisticated 3-dimensional models that map out the Universe in the largest scales. The Sloan Digital Sky Survey, updated in 2009, has provided the most accurate map so far. The Large Synoptic Survey Telescope, destined for first light in a few years will take this to the next level.
The largest void that we currently know of is known as the Giant Void (original, I know), and it’s located about 1.5 billion light-year away. It has a diameter of 1 billion to 1.3 billion light-years across.
To be fair, these regions aren’t really completely empty. They just have less density than the regions with galaxies. In general, they’ve got about a tenth the density of matter that’s average for the Universe.
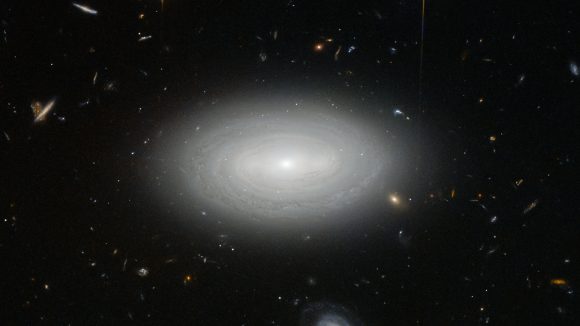
Galaxy MCG+01-02-015 is so isolated that if our galaxy, the Milky Way, were to be situated in the same way, we would not have known of the existence of other galaxies until the 1960s Credit: ESA/Hubble & NASA and N. Gorin (STScI). Acknowledgement: Judy Schmidt
Which means that there’s still gas and dust in these regions, as well as dark matter. There will still be stars and galaxies out in the middle of those voids. Even the Giant Void has 17 separate galaxy clusters inside it.
You might imagine continuing to scale outward. Maybe you’re wondering if the this spongy distribution of matter is actually just the next step to an even larger structure, and so on, and so on. But it isn’t. In fact, astronomers call this “the End of Greatness”, because it doesn’t seem like there’s any larger structure to the Universe.
As the expansion of the Universe continues, these voids are going to get even larger. The walls and filaments connecting clusters of galaxies will stretch and break. The voids will merge with each other, and only gravitationally bound galaxy clusters will remain as islands, adrift in the expanding emptiness.
The full scale of the observable Universe is truly mind boggling. We’re here in this tiny corner of the Local Group, which is part of the Virgo Supercluster, which is perched on the precipice of vast cosmic voids. So much to explore, so let’s get to work.
Several superclusters revealed by the 2dF Galaxy Redshift Survey. This contains the structure known as the "Sloan Great Wall". Courtesy 2dF Galaxy Redshift Survey.
[/caption]
Structure exists on nearly all scales in the universe. Matter clumps under its own gravity into planets, stars, galaxies, clusters, and superclusters. Beyond even these in scale are the filaments and voids. The largest of these filaments is known as the Sloan Great Wall. This giant string of galaxies is 1.4 billion light years across making it the largest known structure in the universe. Yet surprisingly, the Great Wall has never been studied in detail. Superclusters within it have been examined, but the wall as a whole has only come into consideration in a new paper from a team led by astronomers at Tartu Observatory in Estonia.
The Sloan Great Wall was first discovered in 2003 from the Sloan Digital Sky Survey (SDSS). The survey mapped the position of hundreds of millions of galaxies revealing the large scale structure of the universe and uncovering the Great Wall.
Within it, the wall contains several interesting superclusters. The largest of these SCl 126 has been shown previously to be unusual compared to superclusters within other large scale structures. SCl 126 is described as having an exceptionally rich core of galaxies with tendrils of galaxies trailing away from it like an enormous “spider”. Typical superclusters have many smaller clusters connected by these threads. This pattern is exemplified by one of the other rich superclusters in the wall, SCl 111. If the wall is examined in only its densest portions, the tendrils extending away from these cores are quite simple, but as the team explored lower densities, sub filaments became apparent.
Another way the team examined the Great Wall was by looking at the arrangement of different types of galaxies. In particular, the team looked for Bright Red Galaxies (BRGs) and found that these galaxies are often found together in groups with at least five BRGs present. These galaxies were often the brightest of the galaxies within their own groups. As a whole, the groups with BRGs tended to have more galaxies which were more luminous, and have a greater variety of velocities. The team suggests that this increased velocity dispersion is a result of a higher rate of interactions among galaxies than in other clusters. This is especially true for SCl 126 where many galaxies are actively merging. Within SCl 126, these BRG groups were evenly distributed between the core and the outskirts while in SCl 111, these groups tended to congregate towards the high density regions. In both of these superclusters, spiral galaxies comprised about 1/3 of the BRGs.
The study of such properties will help astronomers to test cosmological models that predict galactic structure formation. The authors note that models have generally done a good job of being able to account for structures similar to SCl 111 and most other superclusters we have observed in the universe. However, they fall short in creating superclusters with the size, morphology and distribution of SCl 126. These formations arise from density fluctuations initially present during the Big Bang. As such, understanding the structures they formed will help astronomers to understand these perturbations in greater detail and, in turn, what physics would be necessary to achieve them. To help achieve this, the authors intend to continue mapping the morphology of the Sloan Great Wall as well as other superclusters to compare their features.
A billion years after the big bang, hydrogen atoms were mysteriously torn apart into a soup of ions. Credit: NASA/ESA/A. Felid (STScI)).
It’s no secret that the universe is an extremely vast place. That which we can observe (aka. “the known Universe”) is estimated to span roughly 93 billion light years. That’s a pretty impressive number, especially when you consider its only what we’ve observed so far. And given the sheer volume of that space, one would expect that the amount of matter contained within would be similarly impressive.
But interestingly enough, it is when you look at that matter on the smallest of scales that the numbers become the most mind-boggling. For example, it is believed that between 120 to 300 sextillion (that’s 1.2 x 10²³ to 3.0 x 10²³) stars exist within our observable universe. But looking closer, at the atomic scale, the numbers get even more inconceivable.
At this level, it is estimated that the there are between 1078 to 1082 atoms in the known, observable universe. In layman’s terms, that works out to between ten quadrillion vigintillion and one-hundred thousand quadrillion vigintillion atoms.
And yet, those numbers don’t accurately reflect how much matter the universe may truly house. As stated already, this estimate accounts only for the observable universe which reaches 46 billion light years in any direction, and is based on where the expansion of space has taken the most distant objects observed.
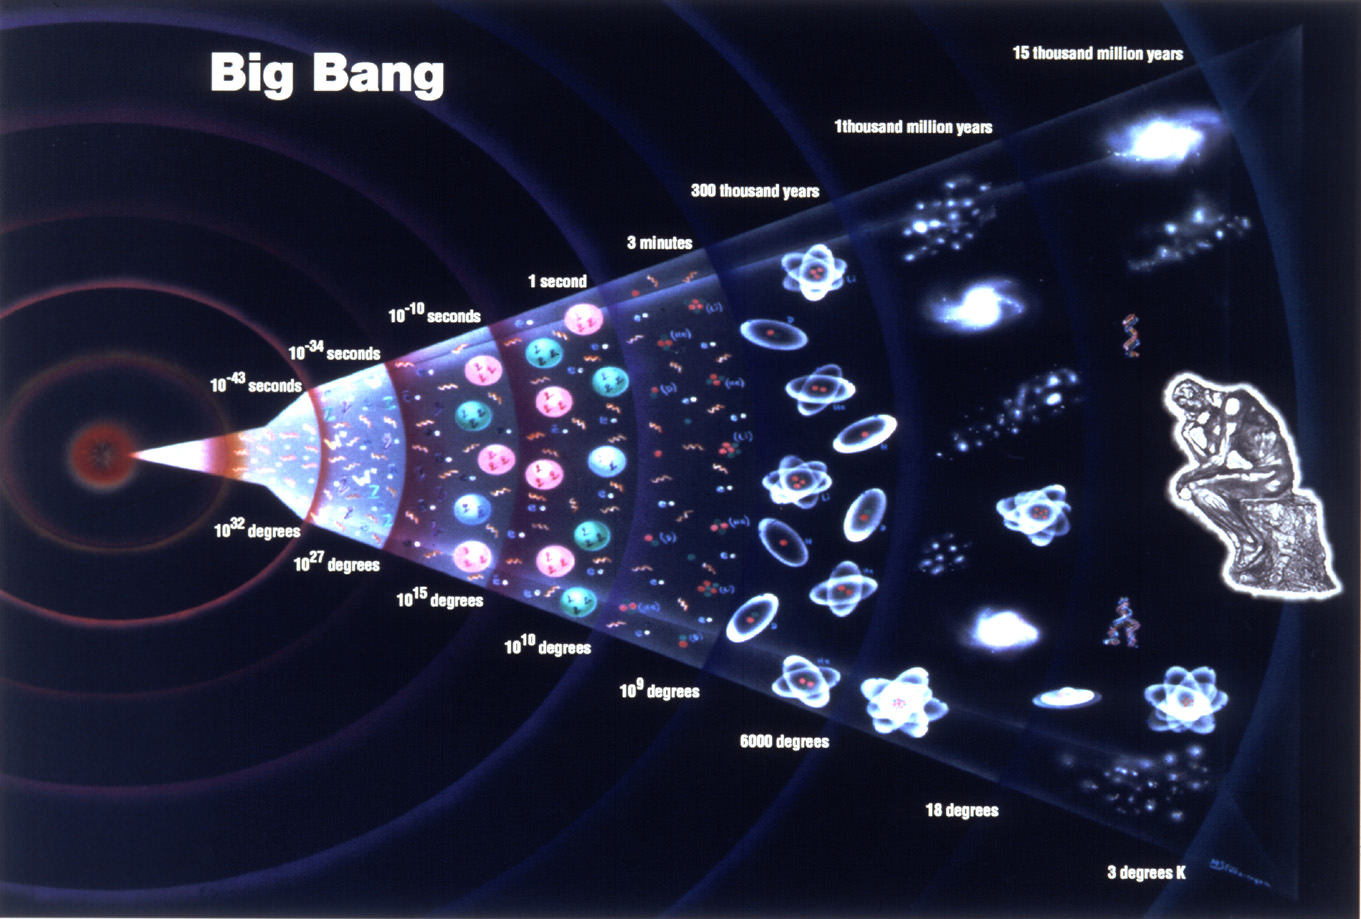
The history of the universe starting the with the Big Bang. Image credit: grandunificationtheory.com
While a German supercomputer recently ran a simulation and estimated that around 500 billion galaxies exist within range of observation, a more conservative estimate places the number at around 300 billion. Since the number of stars in a galaxy can run up to 400 billion, then the total number of stars may very well be around 1.2×10²³ – or just over 100 sextillion.
On average, each star can weigh about 1035 grams. Thus, the total mass would be about 1058 grams (that’s 1.0 x 1052 metric tons). Since each gram of matter is known to have about 1024 protons, or about the same number of hydrogen atoms (since one hydrogen atom has only one proton), then the total number of hydrogen atoms would be roughly 1086 – aka. one-hundred thousand quadrillion vigintillion.
Within this observable universe, this matter is spread homogeneously throughout space, at least when averaged over distances longer than 300 million light-years. On smaller scales, however, matter is observed to form into the clumps of hierarchically-organized luminous matter that we are all familiar with.
In short, most atoms are condensed into stars, most stars are condensed into galaxies, most galaxies into clusters, most clusters into superclusters and, finally, into the largest-scale structures like the Great Wall of galaxies (aka. the Sloan Great Wall). On a smaller scale, these clumps are permeated by clouds of dust particles, gas clouds, asteroids, and other small clumps of stellar matter.
Representation of the timeline of the universe over 13.7 billion years, and the expansion in the universe that followed. Credit: NASA/WMAP Science Team.
The observable matter of the Universe is also spread isotropically; meaning that no direction of observation seems different from any other and each region of the sky has roughly the same content. The Universe is also bathed in a wave of highly isotropic microwave radiation that corresponds to a thermal equilibrium of roughly 2.725 kelvin (just above Absolute Zero).
The hypothesis that the large-scale universe is homogeneous and isotropic is known as the cosmological principle. This states that physical laws act uniformly throughout the universe and should, therefore, produce no observable irregularities in the large scale structure. This theory has been backed up by astronomical observations which have helped to chart the evolution of the structure of the universe since it was initially laid down by the Big Bang.
The current consensus amongst scientists is that the vast majority of matter was created in this event, and that the expansion of the Universe since has not added new matter to the equation. Rather, it is believed that what has been taking place for the past 13.7 billion years has simply been an expansion or dispersion of the masses that were initially created. That is, no amount of matter that wasn’t there in the beginning has been added during this expansion.
However, Einstein’s equivalence of mass and energy presents a slight complication to this theory. This is a consequence arising out of Special Relativity, in which the addition of energy to an object increases its mass incrementally. Between all the fusions and fissions, atoms are regularly converted from particles to energies and back again.
Atom density is greater at left (the beginning of the experiment) than 80 milliseconds after the simulated Big Bang. Credit: Chen-Lung Hung
Nevertheless, observed on a large-scale, the overall matter density of the universe remains the same over time. The present density of the observable universe is estimated to be very low – roughly 9.9 × 10⁻³⁰ grams per cubic centimeter. This mass-energy appears to consist of 68.3% dark energy, 26.8% dark matter and just 4.9% ordinary (luminous) matter. Thus the density of atoms is on the order of a single hydrogen atom for every four cubic meters of volume.
The properties of dark energy and dark matter are largely unknown, and could be uniformly distributed or organized in clumps like normal matter. However, it is believed that dark matter gravitates as ordinary matter does, and thus works to slow the expansion of the Universe. By contrast, dark energy accelerates its expansion.
Once again, this number is just a rough estimate. When used to estimate the total mass of the Universe, it often falls short of what other estimates predict. And in the end, what we see is just a smaller fraction of the whole.