Comet ISON Hosted A Rare Kind Of Nitrogen, Hinting At Reservoirs In Young Solar System

Spectacular photo of Comet ISON taken Nov. 15 from Charleston, Rhode Island, USA showing the recent outburst. Click to enlarge. Credit: Scott MacNeill

Comet ISON — that bright comet last year that broke up around Thanksgiving weekend — included two forms of nitrogen in its icy body, according to newly released observations from the Subaru Telescope.

Of the two types found, the discovery of isotope 15NH2 was the first time it’s ever been seen in a comet. Further, the observations from the Japanese team of astronomers show “there were two distinct reservoirs of nitrogen [in] the massive, dense cloud … from which our Solar System may have formed and evolved,” stated the National Astronomical Observatory of Japan.

Besides being pretty objects to look at, comets are considered valuable astronomical objects because they’re a sort of time capsule of conditions early in the universe. The “fresh” comets are believed to come from a vast area of icy bodies called the Oort Cloud, a spot that has been relatively untouched since the solar system formed about 4.6 billion years ago. Spying elements inside of comets can give clues as to what was present in our neighborhood when the sun and planets were just coming to be.

“Ammonia (NH3) is a particularly important molecule, because it is the most abundant nitrogen-bearing volatile (a substance that vaporizes) in cometary ice and one of the simplest molecules in an amino group (–NH2) closely related to life. This means that these different forms of nitrogen could link the components of interstellar space to life on Earth as we know it,” NAOJ stated.

You can read more details about the finding at the NAOJ website, or in Astrophysical Journal Letters.

Greedy Galaxies Gobbled Gas, Stalling Star Formation Billions Of Years Ago

Arp 147 contains a spiral galaxy (right) that collided with an elliptical galaxy (left), triggering a wave of star formation. Credit: X-ray: NASA/CXC/MIT/S.Rappaport et al, Optical: NASA/STScI

Like millionaires that burn through their cash too quickly, astronomers have found one factor behind why compact elliptical galaxies stopped growing stars about 11 billion years ago: they ate through their gas reserves.

The revelation comes as researchers released a new evolutionary track for compact elliptical galaxies that stopped their star formation when the universe was just three billion years old. When these galaxies ran out of gas, some of them cannibalized smaller galaxies to create giant elliptical galaxies. The “burned-out”galaxies have stars crowding 10 to 100 times more densely than elliptical galaxies formed more recently through a different evolutionary track.

“We at last show how these compact galaxies can form, how it happened, and when it happened. This basically is the missing piece in the understanding of how the most massive galaxies formed, and how they evolved into the giant ellipticals of today,” stated Sune Toft, who led the study and is a researcher at the Dark Cosmology Center at the Niels Bohr Institute in Copenhagen.

“This had been a great mystery for many years, because just three billion years after the Big Bang we see that half of the most massive galaxies have already completed their star formation.”

How massive elliptical galaxies evolved in about 13 billion years. Credit: NASA, ESA, S. Toft (Niels Bohr Institute), and A. Feild (STScI)

The team got a snapshot of these galaxies’ evolution by looking at a representative sample with the Hubble Space Telescope, specifically through the Cosmic Assembly Near-Infrared Deep Extragalactic Legacy Survey (CANDELS) and a spectroscopic survey called 3D-HST. To find out how old the stars were, they combined the Hubble work with data gathered from the  Spitzer Space Telescope and the Subaru Telescope in Hawaii.

Next, they examined ancient, fast-star-forming submillimeter galaxies with data gathered from a range of space and ground-based telescopes.

The Hubble Space Telescope. image credit: NASA, tweaked by D. Majaess.

“This multi-spectral information, stretching from optical light through submillimeter wavelengths, yielded a full suite of information about the sizes, stellar masses, star-formation rates, dust content, and precise distances of the dust-enshrouded galaxies that were present early in the universe,” Hubble’s news center stated.

The group found that that the submillimeter galaxies were likely “progenitors” of compact elliptical galaxies, as they share predicted characteristics of the ancestors. Further, researchers calculated that starbursts in submillimeter galaxies only went on for about 40 million years before the galaxies ran out of gas.

You can read the results in the Feb. 20 edition of the Astrophysical Journal or in prepublished version in Arxiv.

Source: Hubble News Center

What Fuels The Engine Of A Supermassive Black Hole?

Orbiting near a moving black hole doesn't seem like the safest mode of transportation, but time dilation might make it worth the risk. Credit: NAOJ

If you could get a good look at the environment around a supermassive black hole — which is a black hole often found in the center of the galaxy — what factors would make that black hole keep going?

A Japanese study revealed that at least one of these black holes stay “active and luminous” by gobbling up nearby material, but notes that only a few of the observed galaxies that are merging have these types of black holes. This must mean something unique arises in the environment near the black hole to get it going, the researchers say. What that is, though, is still poorly understood.

Supermassive black holes, defined as black holes that have a million times the mass of the sun or more, reside in galaxy centers. “The merger of gas-rich galaxies with SMBHs [supermassive black holes] in their centers not only causes active star formation, but also stimulates mass accretion onto the existing SMBHs,” stated a press release from the Subaru Telescope.

“When material accretes onto a SMBH, the accretion disk surrounding the black hole becomes very hot from the release of gravitational energy, and it becomes very luminous. This process is referred to as active galactic nucleus (AGN) activity; it is different from the energy generation activity by nuclear fusion reactions within stars.”

Figuring out how these types of activity vary would give a clue as to how galaxies come together, the researchers said, but it’s hard to see anything in action because of dust and gas blocking the view of optical telescopes. That’s why infrared observations come in so handy, because it makes it easier to peer through the debris. (You can see some examples from this research below.)

Examples of infrared K-band images of luminous, gas-rich, merging galaxies. Credit: NAOJ

The team (led by the  National Astronomical Observatory of Japan’s Masatoshi Imanishi) used NAOJ’s Subaru’s Infrared Camera and Spectrograph (IRCS) and the telescope’s adaptive optics system in two bands of infrared. Researchers looked at 29 luminous gas-rich merging galaxies in the infrared and found “at least” one active supermassive black hole in all but one of the ones studied.  However, only four of these galaxies merging had multiple, active black holes.

“The team’s results mean that not all SMBHs in gas-rich merging galaxies are actively mass accreting, and that multiple SMBHs may have considerably different mass accretion rates onto SMBHs,” Subaru stated.

The implication is more about the environment around a supermassive black hole must be understood to figure out how mass accretes. Knowing more about this will improve computer simulations of galaxy mergers, the researchers said.

You can read the published study in the Astrophysical Journal or in prepublished form on Arxiv.

Source: Subaru Telescope

Subaru Telescope Captures the Fine Details of Comet Lovejoy’s Tail

Comet C/2011 W3 (Lovejoy) imaged by the Subaru Telescope on Dec. 3. Image credit: NAOJ with data processing by Masafumi Yagi (NAOJ)

Comet ISON may be no more than just a cloud of icy debris these days but there’s another comet that’s showing off in the morning sky: C/2013 R1 (Lovejoy), which was discovered in September and is steadily nearing its Christmas Day perihelion. In the early hours of Dec. 3, astronomers using the 8.2-meter Subaru Telescope atop Mauna Kea in Hawaii captured this amazing image of Lovejoy, revealing the intricate flows of ion streamers in its tail. (Click the image above for extra awesomeness.)

According to a news story on the NAOJ website:

At the time of this observation, at around 5:30 am on December 3, 2013 (Hawaii Standard Time), Comet Lovejoy was 50 million miles (80 million km) distant from Earth and 80 million miles (130 million km) away from the Sun.

The entire image of comet Lovejoy was made with the Subaru Telescope’s Suprime-Cam, which uses a mosaic of ten 2048 x 4096 CCDs covering a 34′ x 27′ field of view and a pixel scale of 0.2”.

Where to find comet Lovejoy in the morning sky, Dec. 7 (via spaceweather.com)

“Subaru Telescope offers a rare combination of large telescope aperture and a wide-field camera,” said a member of the observation team, which included astronomers from Stony Brook University in New York, Universidad Complutense in Madrid,  Johns Hopkins University, and the National Astronomical Observatory of Japan. “This enabled us to capture a detailed look at the nucleus while also photogenically framing inner portions of Comet Lovejoy’s impressive ion tail.”

Comet Lovejoy is currently visible in the early morning sky as a naked-eye object in the northern hemisphere.

Read more about Lovejoy’s journey through the inner solar system in this article by Bob King here.

Image of comet Lovejoy on Dec. 5 by Flickr user "Willo2173".
Image of comet Lovejoy on Dec. 5 by Flickr user Willo2173.

Do you have photos of comet Lovejoy or any other astronomical objects to share? Upload them to the Universe Today Flickr group!

Subaru Telescope Reveals Orderly Massive Galaxy Evolution

FMOS spectra in the J-band (left panel) and H-band (right panel), each of which filters light so that only specific wavelengths can pass through. The horizontal axis refers to the wavelength direction while the vertical axis indicates individual spectra observed through each fiber. Small blue circles indicate the detection of emission lines (left: H? and [OIII]; right: H?, [NII]). The inset box shows the intensity of the emission lines for one galaxy. The vertical bands indicate the masked regions where bright sky (OH) emissions are prevented from entering science fibers placed on high-redshift galaxies. (Credit: FMOS-COSMOS)

Nobody likes a sloppy COSMOS (Cosmological Evolution Survey) and astronomers utilizing the Fiber-Multi-Object Spectrograph (FMOS) mounted on the Subaru Telescope have put order into chaos through their studies. The survey has found that some nine billion years ago galaxies were capable of producing new stars in a fashion as orderly as game of checkers. Despite their young cosmological age, the galaxies show signs containing high amounts of dust enriched by heavier elements – a mature state.

“These findings center on a major question: What was the universe like when it was maximally forming its stars?” says John Silverman, the principal investigator of the FMOS-COSMOS project at the Kavli Institute for the Physics and Mathematics of the Universe (Kavli IPMU).

These “universal” questions are just what the COSMOS team seeks to answer. Their research goals are to enlighten the scales of cosmic time in relationship with the environment, formation and evolution of massive galactic structures. When studying individual galaxies, they may be able to tell if their rate of growth can be attributed to large-scale environments. Information of this type can clarify what factors the early Universe structure may have contributed to the current form of local galaxies. One of the data sets the team is focusing on is using the FMOS on the Subaru Telescope to chart out the distribution of more than a thousand galaxies which formed over nine billion years ago – a time when the Universe was hitting its star-formation peak.

“One key to generating fruitful results is collaboration between COSMOS researchers to maximize optimal use of FMOS.” Silverman continues, “In this project, researchers from Kavli IPMU in Japan and the Institute for Astronomy at the University of Hawaii (principal investigator: David Sanders) formed an effective collaboration to implement their goal.” The observations spanned 10 clear nights starting in March 2012.

Why choose spectroscopy? This advanced fiber optics technology speaks for itself, collecting light over an area of sky equal in size to that of the Moon. The FMOS focuses on the near-infrared, filtering out unwanted emissions caused by warm temperatures and can acquire spectra from 400 galaxies simultaneously with a wide field of coverage of 30 arc minutes at prime-focus. By employing such a wide field of view, astronomers can squeeze in a wide range of objects in their local environments. This enables researchers to maximize information on star-forming regions, cluster formation, and cosmology.

As David Sanders, the principal investigator of the FMOS-COSMOS project at IfA, puts it, “FMOS has clearly revolutionized our ability to study how galaxies form and evolve across cosmic time. It is currently the most powerful instrument we have to study the large numbers of objects needed to understand galaxies of all sizes, shapes and masses — from the largest ellipticals to the smallest dwarfs. We are extremely fortunate that the Kavli IPMU-IfA collaboration is giving us this unique opportunity to study the distant universe in such exquisite detail.”

FMOS will soon be famous by revealing its true potential. It has been collecting copious amounts of data in a high spectral resolution mode and at a very successful rate. So far it has accomplished nearly half of its goal – to examine over a thousand galaxies with redshifts to map the large-scale structure. The current survey consists of mapping an area of sky which spans a square degree in high-resolution mode and future plans for FMOS will involve enlarging the area. This expanded coverage will complement other instruments on alternative telescopes which have a wider spectral imaging system or a higher resolution which is limited to a smaller area. These combined findings may one day result in showing us some of the very first structures that eventually evolved into the massive galaxy clusters we see today!

Original Story Source: Kavli Institute for the Physics and Mathematics of the Universe News Release.

New 3-D Map Shows Large Scale Structures in the Universe 9 Billion Years Ago

The FastSound project's 3D map of the large-scale structure of a region in the Universe about 4.7 billion years after the Big Bang. This area covers 2.5 times 3 degrees of the sky, with a radial distance spanning 12-14.5 billion light years in comoving distance or 8-9.6 billion light years in light travel distance. Credit: NAOJ, SDSS, CFHT.

I remember seeing the Hubble 3-D IMAX movie in 2010 and literally gasping when the view pulled back from zooming into distant stars and galaxies to show clusters and superclusters of galaxies interwoven like a web, creating the large scale structure of the Universe. In 3-D, the structure looks much like the DNA double helix or a backbone.

Now, a new project that aims to map the Universe’s structure has looked back in time to create a 3-D map showing a portion of the Universe as it looked nine billion years ago. It shows numerous galaxies and interestingly, already-developed large-scale structure of filaments and voids made from galaxy groups.


The map was created by the FastSound project, which is surveying galaxies in the Universe using the Subaru Telescope’s new Fiber Multi-Object Spectrograph (FMOS). The team doing the work is from Kyoto University, the University of Tokyo and the University of Oxford.

The team said that although they can see that the clustering of galaxies is not as strong back when the Universe was 4.7 billion years old as it is in the present-day Universe, gravitational interaction will eventually result in clustering that grows to the current level.

The new map spans 600 million light years along the angular direction and two billion light years in the radial direction. The team will eventually survey a region totaling about 30 square degrees in the sky and then measure precise distances to about 5,000 galaxies that are more than ten billion light years away.

This is not the first 3-D map of the Universe: the Sloan Digital Sky Survey created one in 2006 with coverage up to five billion light years away, and it was updated just last year, and a video flythough was created, which you can watch above. Also, earlier this year the University of Hawaii created a 3-D video map showing large scale cosmic structure out to 300 million light years.

But the FastSound project hopes to create a 3-D map of the very distant Universe by covering the volume of the Universe farther than ten billion light years away. FMOS is a wide-field spectroscopy system that enables near-infrared spectroscopy of over 100 objects at a time, with an exceptionally wide field of view when combined with the light collecting power of the 8.2 meter primary mirror of the telescope.

The map released today is just the first from FastSound. The final 3-D map of the distant Universe will precisely measure the motion of galaxies and then measure the rate of growth of the large-scale structure as a test of Einstein’s general theory of relativity.

Although scientists know that the expansion of the Universe is accelerating, they do not know why – whether it is from dark energy or whether gravity on cosmological scales may differ from that of general relativity, this mystery is one of the biggest questions in contemporary physics and astronomy. A comparison of the 3D map of the young Universe with the predictions of general relativity could eventually reveal the mechanism for the mysterious acceleration of the Universe.

The team said their 3-D map shown in this release uses a measure of “comoving” distance rather than light travel distance. They explained:

Light travel distance refers to the time that has elapsed from the epoch of the observed distant galaxy to the present, multiplied by the speed of light. Since the speed of light is always constant for any observer, it describes the distance of the path that a photon has traveled. However, the expansion of the Universe increases the length of the path that the photon traveled in the past. Comoving distance, the geometrical distance in the current Universe, takes this effect into account. Therefore, comoving distance is always larger than the corresponding light travel distance.

In the lead image above from FastSound, the colors of the galaxies indicate their star formation rate, i.e., the total mass of stars produced in a galaxy every year. The gradation in background color represents the number density of galaxies; the underlying mass distribution (which is dominated by invisible dark matter that accounts for about 30% of the total energy in the Universe) and how it would look like this if we could see it. The lower part of the figure shows the relative locations of the FastSound and the Sloan Digital Sky Survey (SDSS) regions, indicating that the FastSound project is mapping a more distant Universe than SDSS’s 3D map of the nearby Universe.

Find out more about FastSound here.

Source: Subaru Telescope

Where Is Dark Matter Most Dense? Subaru Telescope Gets Some Hints

The Subaru Telescope. Credit: National Astronomical Observatory of Japan

Put another checkmark beside the “cold dark matter” theory. New observations by Japan’s Subaru Telescope are helping astronomers get a grip on the density of dark matter, this mysterious substance that pervades the universe.

We can’t see dark matter, which makes up an estimated 85 percent of the universe, but scientists can certainly measure its gravitational effects on galaxies, stars and other celestial residents. Particle physicists also are on the hunt for a “dark matter” particle — with some interesting results released a few weeks ago.

The latest experiment with Subaru measured 50 clusters of galaxies and found that the density of dark matter is largest in the center of these clusters, and smallest on the outskirts. These measurements are a close match to what is predicted by cold dark matter theory, scientists said.

Cold dark matter assumes that this material can’t be observed in any part of the electromagnetic spectrum, the band of light waves that ranges from high-energy X-rays to low-energy infrared heat. Also, the theory dictates that dark matter is made up of slow-moving particles that, because they collide with each other infrequently, are cold. So, the only way dark matter interacts with other particles is by gravity, scientists have said.

To check this out, Subaru peered at “gravitational lensing” in the sky — areas where the light of background objects are bent around dense, massive objects in front. Galaxy clusters are a prime example of these super-dense areas.

Several dark matter maps: one based on a sample of 50 individual galaxy clusters (left), another looking at an average galaxy cluster (center), and another based on dark matter theory (right). Red is the highest concentration of dark matter, followed by yellow, green and blue. At right, in the middle, is a map based on cold dark matter theory that comes close to the average galaxy cluster observed with the Suburu Telescope. Credit: NAOJ/ASIAA/School of Physics and Astronomy, University of Birmingham/Kavli IPMU/Astronomical Institute, Tohoku University)

“The Subaru Telescope is a fantastic instrument for gravitational lensing measurements. It allows us to measure very precisely how the dark matter in galaxy clusters distorts light from distant galaxies and gauge tiny changes in the appearance of a huge number of faint galaxies,” stated Nobuhiro Okabe, an astronomer at Academia Sinica in Taiwan who led the study.

Next, the team members could compare where the matter was most dense with that predicted by cold dark matter theory. To do that, they measured 50 of the most massive, known clusters of galaxies. Then, they measured the “concentration parameter”, or the cluster’s average density.


“They found that the density of dark matter increases from the edges to the center of the cluster, and that the concentration parameter of galaxy clusters in the near universe aligns with CDM theory,” stated the National Astronomical Observatory of Japan.

The next step, researchers stated, is to measure dark matter density in the center of the galaxy clusters. This could reveal more about how this substance behaves. Check out more about this study in Astrophysical Journal Letters.

Sourcs: National Astronomical Observatory of Japan

Astronomers Directly Image Distant Exoplanet

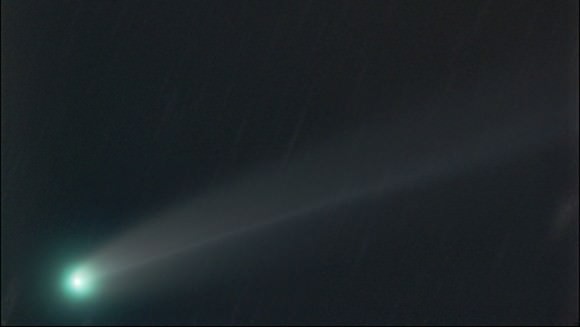
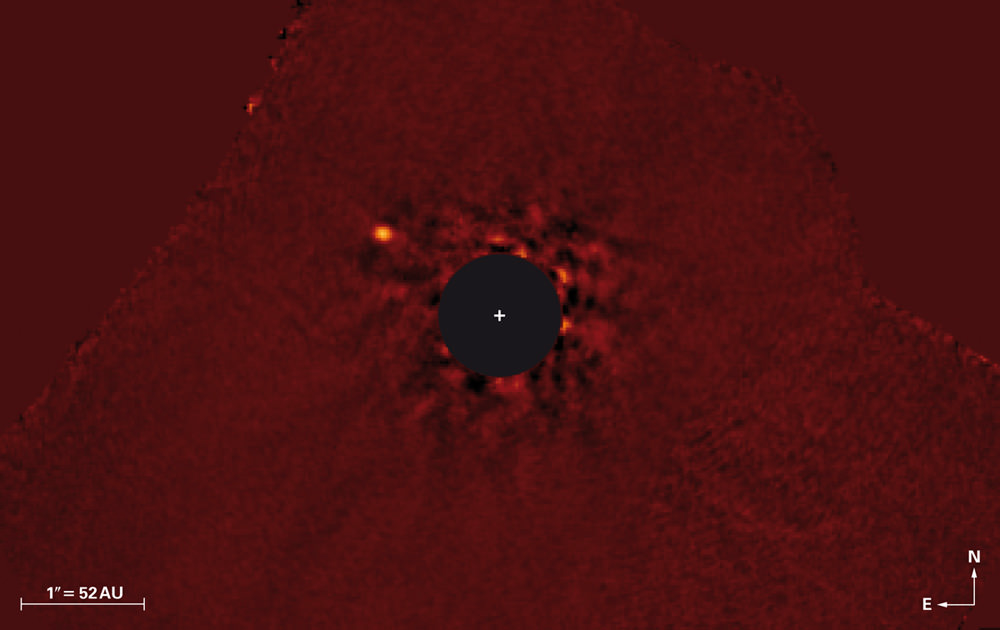
False color, near infrared image of the Kappa Andromedae system, by the Subaru Telescope. Almost all of the light of the host star has been removed by the dark, software-generated disk in the center. Credit: NAOJ/Subaru/J. Carson (College of Charleston)/T. Currie (University Toronto)

Astronomers using the Subaru Telescope in Hawaii have found a super-Jupiter-sized exoplanet orbiting a massive star about 170 light years away from Earth. Not only have they detected the planet, but they’ve also taken a direct image of it. This is exciting because only a handful of exo-planets have been imaged directly. But the other interesting aspect of this newly-found planet is that it orbits its star at a distance comparable to Neptune in our own solar system. Astronomers say this is a strong indication that the planet formed in a manner similar to how it is believed smaller, rocky planets form: from a protoplanetary disk of gas and dust which surrounded the star during its earliest stages.

The star, Kappa Andromedae, is a naked-eye object that can be seen in the constellation Andromeda, and it has a mass 2.5 times that of the Sun, making it the highest mass star to ever host a directly observed planet. The observations were made by a team of astronomers from the Max Planck Institute for Astronomy and the University of Toronto and the College of Charleston, part of the SEEDS project (Strategic Explorations of Exoplanets and Disks with Subaru.)

“Our team identified a faint object located very close to Kappa Andromedae in January that looks much like other young, massive directly imaged planets but does not look like a star,” said Thayne Currie. co-author of the paper from the University of Toronto. “It’s likely a directly imaged planet.”

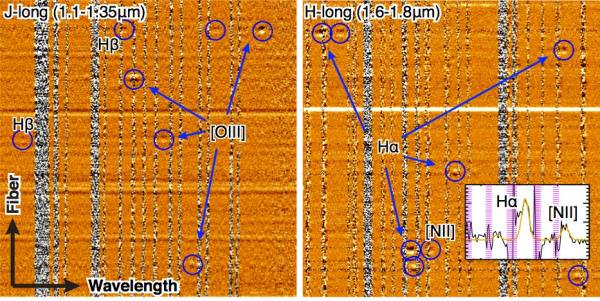
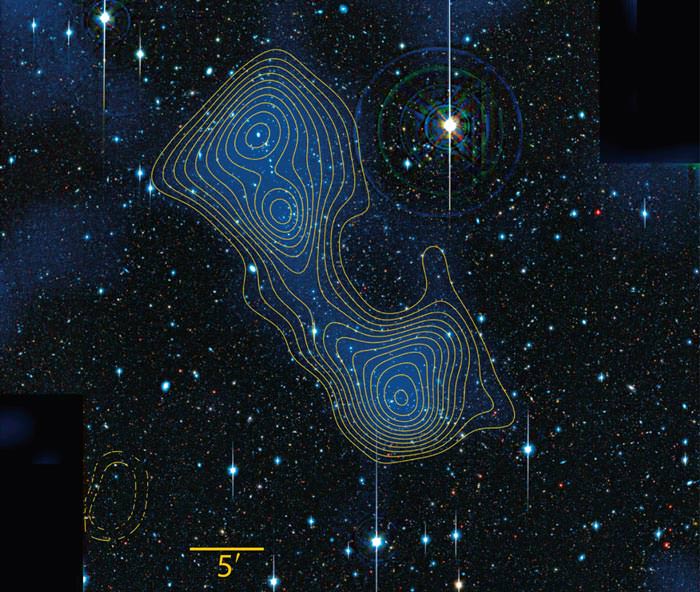
A “signal-to-noise ratio map” generated from the left image. The whiteness of each speckle indicates the probability that we are dealing not with an artefact (“noise”), but with the trace of a real object (“signal”). The white feature toward the upper left, representing a high signal-to-noise value, indicates the high-confidence, super-Jupiter detection. Credit: NAOJ/Subaru/J. Carson (College of Charleston)/T. Currie (University Toronto)

Kappa Andromedae (k And) is a very young star, with an estimated age of 30 million years (in comparison our Sun is around 5 billion years old). The planet, called k And b (“Kappa Andromedae b), is about 10% larger than Jupiter, but it is a heavy world — it has a mass of about 13 times that of Jupiter.

This means that it could very well be either a planet or a very lightweight brown dwarf, an object that is intermediate between planets and stars. However, the astronomers are leaning towards the circumstantial evidence which indicates that it is likely to be a planet.

Since stars are much brighter than their planets –typically by a factor of a billion or more – exoplanets are usually lost in the star’s glare when using traditional observational techniques. The Subaru team used a different technique called angular differential imaging, which combines a time-series of individual images in a manner that allows for the otherwise overwhelming glare of the host star to be removed.

In the infrared image, above, the tiny point of light that is the planet Kappa And b. Since the planet orbits the star at some distance, the SEEDS observing team was able to distinguish the object’s faint light by effectively covering up the light of the star.

The large mass of both the host star and gas giant provide a sharp contrast with our own solar system. Observers and theorists have argued recently that large stars like Kappa Andromedae are likely to have large planets, perhaps following a simple scaled-up model of our own solar system. But experts predict that there is a limit to such extrapolations; if a star is too massive, its powerful radiation may disrupt the normal planet formation process that would otherwise occur. The discovery of the super-Jupiter around Kappa Andromedae demonstrates that stars as large as 2.5 solar masses are still fully capable of producing planets within their primordial circumstellar disks. This is key information for researchers working on models of planet formation.

The astronomers will continue observations of the light emitted by k And b across a broad range of wavelengths in hopes of gaining a better understanding the planet’s atmospheric chemistry, as well as determining if other planets are in this system.

Read the team’s paper: Direct imaging of a `super-Jupiter’ around a massive star

Source: Max Planck Institute for Astronomy

Dark Matter Filaments Bind Galaxies Together

A slim bridge of dark matter – just a hint of a larger cosmic skeleton – has been found binding a pair of distant galaxies together.

According to a press release from the journal Nature, scientists have traced a thread-like structure resembling a cosmic web for decades but this is the first time observations confirming that structure has been seen. Current theory suggests that stars and galaxies trace a cosmic web across the Universe which was originally laid out by dark matter – a mysterious, invisible substance thought to account for more than 80 percent of the matter in the Universe. Dark matter can only be sensed through its gravitational tug and only glimpsed when it warps the light of distant galaxies.

Astronomers led by Jörg Dietrich, a physics research fellow in the University of Michigan College of Literature, Science and the Arts, took advantage of this effect by studying the gravitational lensing of galactic clusters Abell 222 and 223. By studying the light of tens of thousands of galaxies beyond the supercluster; located about 2.2 billion light-years from Earth, the scientists were able to plot the distortion caused by the Abell cluster. The scientists admit it is extremely difficult to observe gravitational lensing by dark matter in the filaments because they contain little mass. Their workaround was to study a particularly massive filament that stretched across 18 megaparsecs (nearly 59 million light-years) of space. The alignment of the string enhanced the lensing effect.

The team’s results were published in the July 4, 2012 issue of Nature.

“It looks like there’s a bridge that shows that there is additional mass beyond what the clusters contain,” Dietrich said in a press release. “The clusters alone cannot explain this additional mass.”

By examining X-rays emanating from plasma in the filament, observed from the XMM-Newton satellite, the team calculated that no more than nine percent of the filament’s mass could be made up of the hot gas. Computer simulations further suggested that just 10 percent of the mass was due to visible stars and galaxies. Only dark matter, says Dietrich, could make up the remaining mass.

“What’s exciting,” says Mark Bautz, an astrophysicist at the Massachusetts Institute of Technology, “is that in this unusual system we can map both dark matter and visible matter together and try to figure out how they connect and evolve along the filament.”

Refining the technique could help physicists understand the structure of the Universe and pin down the identity of dark matter (whether it’s a cold slow-moving mass or a warm, fast-moving one. Different types would clump differently along the filament, say scientists.

Image caption: Dark-matter filaments, such as the one bridging the galaxy clusters Abell 222 and Abell 223, are predicted to contain more than half of all matter in the Universe. (credit: Jörg Dietrich, University of Michigan/University Observatory Munich)

‘Stealth Merger’ of Dwarf Galaxies Seen in New Images

[/caption]

Space may be vast, but accidents can still happen, like when galaxies “collide,” usually resulting in the smaller one having its stars scattered by the larger one. New high-resolution images of two dwarf galaxies merging together have now been obtained by astronomers, providing a more detailed look at something which could only barely be seen before. While the larger galaxy of the two, NGC 4449, is easily visible, its smaller companion was little more than just a faint smudge until now.

The new study comes from an international team of astronomers led by David Martínez-Delgado of the Max Planck Institute for Astronomy in Heidelberg. Their paper will be published in an upcoming issue of Astrophysical Journal Letters.

When the galaxies collide, the smaller one essentially gets torn apart by the larger one. As explained by Aaron Romanowsky, an astronomer at the University of California, Santa Cruz (UCSC), “This is how galaxies grow. You can see the smaller galaxy coming in and getting shredded, eventually leaving its stars scattered through the halo of the host galaxy.”

The remains of the smaller galaxy appear as a dense stream of stars in the outer regions of the larger one. It was initially seen as just a faint smudge in digitized photographic plates from the Digitized Sky Survey project. Because this smaller galaxy, or what’s left of it, is so difficult to see, the merging process has been referred to as a “stealth merger.”

The new images, taken by the Black Bird Observatory and Subaru Telescope, show the merger in such detail that individual stars can be seen. “I don’t think I’d ever seen a picture of a galaxy merger where you can see the individual stars. It’s really an impressive image,” said Romanowsky.

NGC 4449 is about 12.5 million light-years from Earth and is part of a group of galaxies found in the constellation Canes Venatici. It is similar to one of our own Milky Way’s satellite galaxies, the Large Magellanic Cloud.

While larger galaxies merging with other large galaxies are commonly seen, it has been more difficult to find examples of smaller galaxies doing the same thing. Romanowsky continues: “We should see the same things at smaller scales, with small galaxies eating smaller ones and so on. Now we have this beautiful image of a dwarf galaxy consuming a smaller dwarf.”

In addition, the companion galaxy was also independently discovered by astronomers at the University of California, Los Angeles (UCLA). Their own paper will be published in the February 9, 2012  issue of Nature.

The paper is available here. See also the Subaru Telescope press release here.