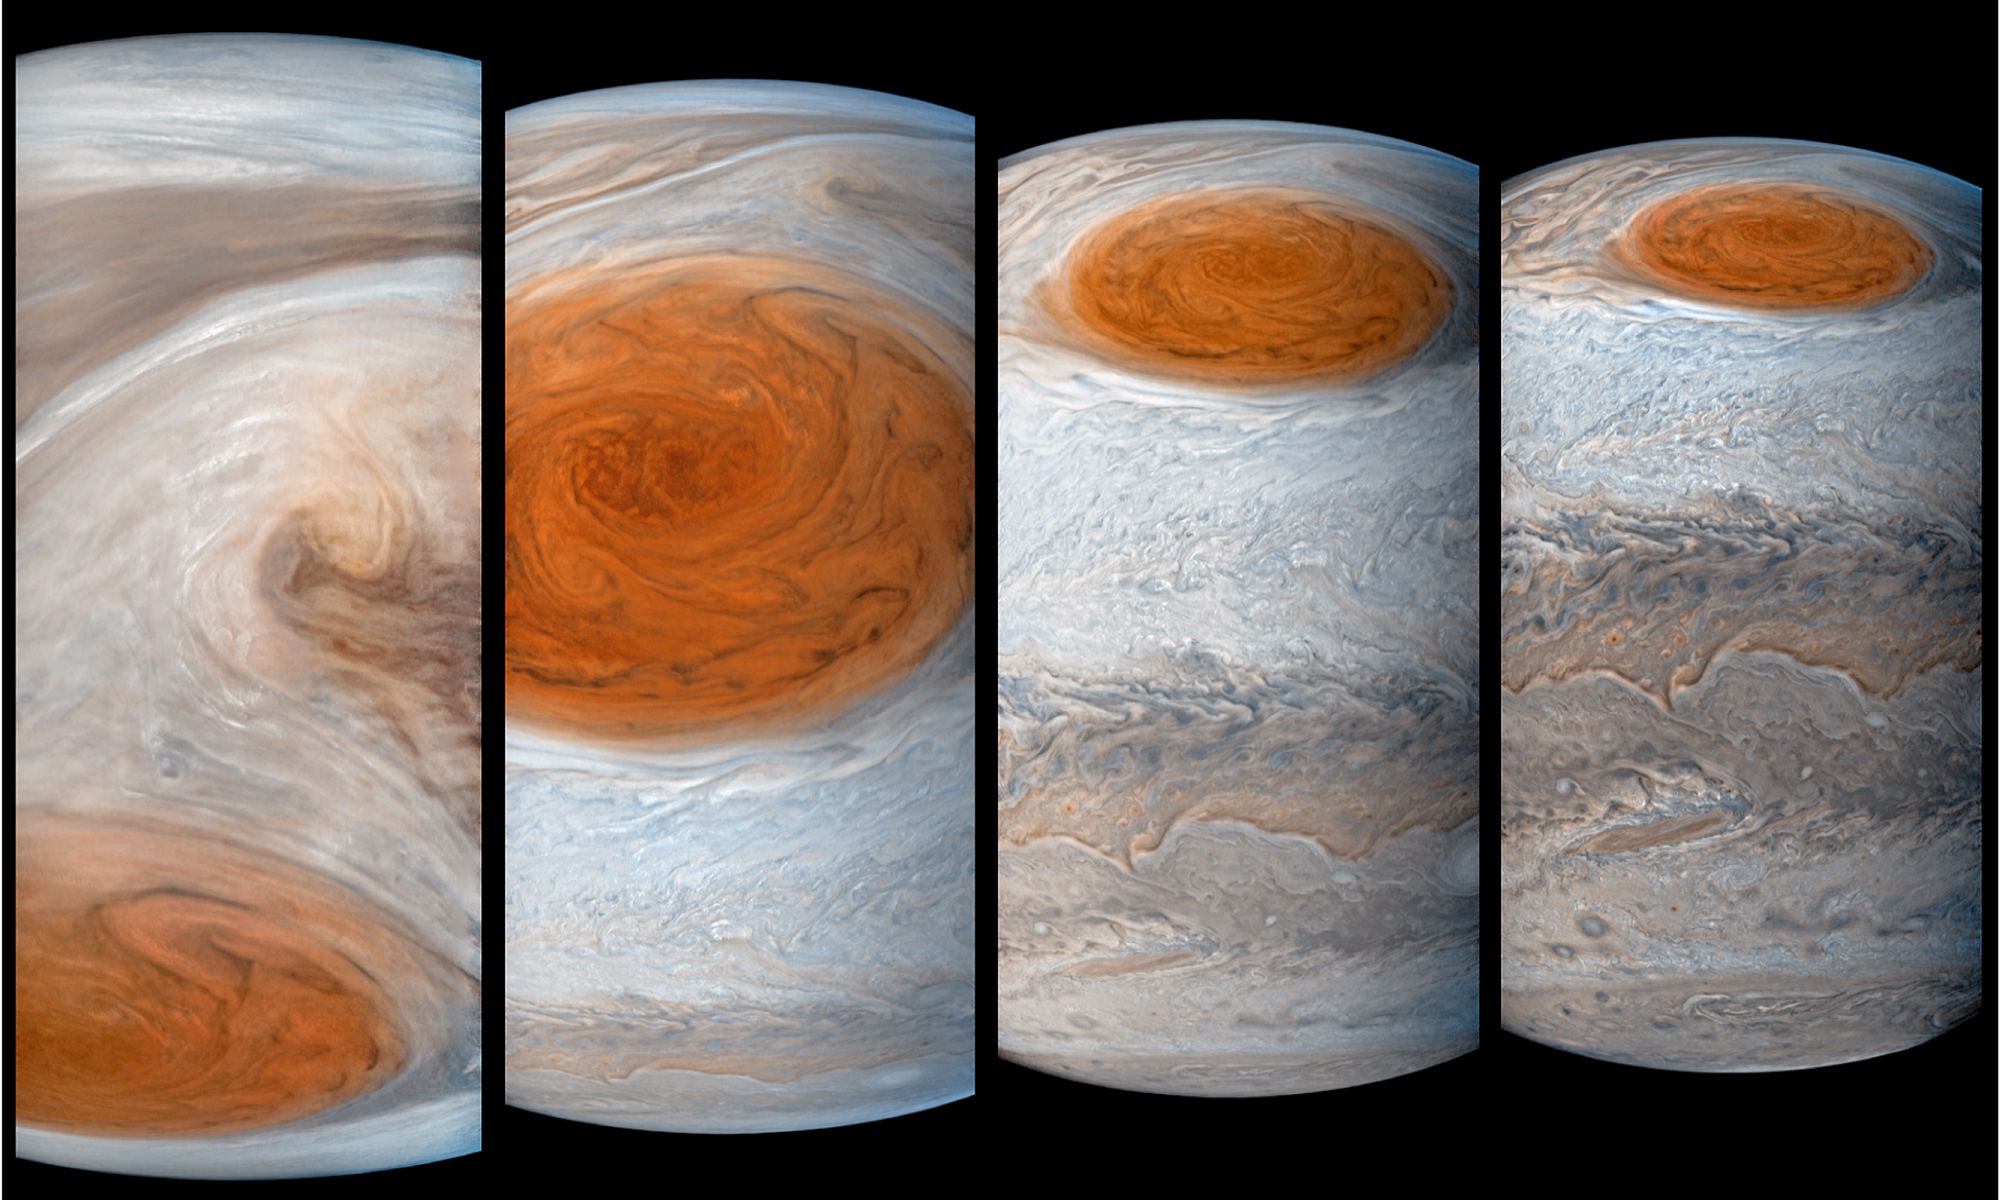
JunoCam captured these images of the Great Red Spot during the July 2017 fly-by of Jupiter. The composite images provide a richly-detailed look at the storm. Image: Sánchez-Lavega et al. 2018; composed by G. Eichstadt and J. Cowart
For almost 200 years humans have been watching the Great Red Spot (GRS) on Jupiter and wondering what’s behind it. Thanks to NASA’s Juno mission, we’ve been getting better and better looks at it. New images from JunoCam reveal some of the deeper detail in our Solar System’s longest-lived storm.
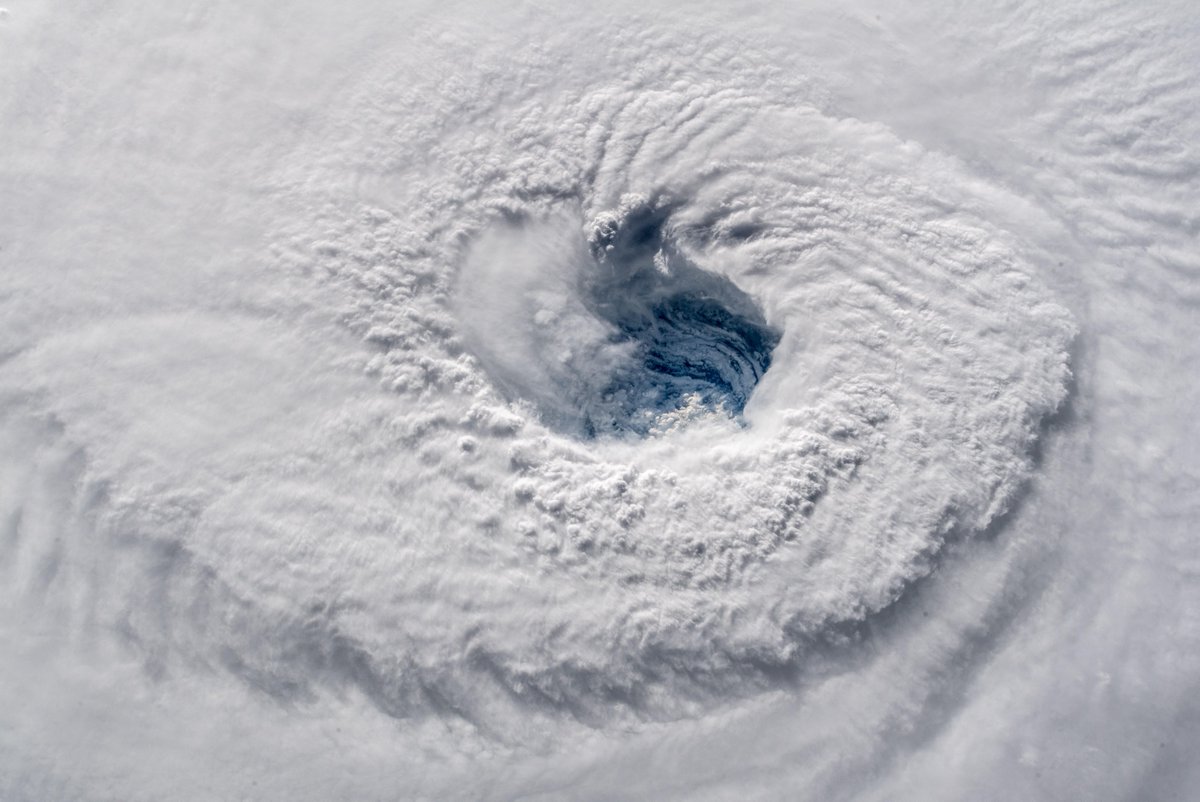
This image of Hurricane Florence was taken on Tuesday September 11th when Florence was a Category 4 storm. The image was taken by ESA astronaut Alexander Gerst aboard the International Space Station. Image: ESA/NASA–A. Gerst
Even if you know nothing about hurricanes, an unavoidable sense of doom and destruction overtakes you when you look at this image of Hurricane Florence as it moves inexorably toward North and South Carolina.
Even if you didn’t know that the powerful storm is forecast to gain strength as it hits the coast on Friday, or that it will dump several months of rain onto the region in a mere few days, or that the storm surge could reach as high as 9 to 13 ft. If you didn’t know all those things, the picture of Florence taken from space would still fill you with foreboding.
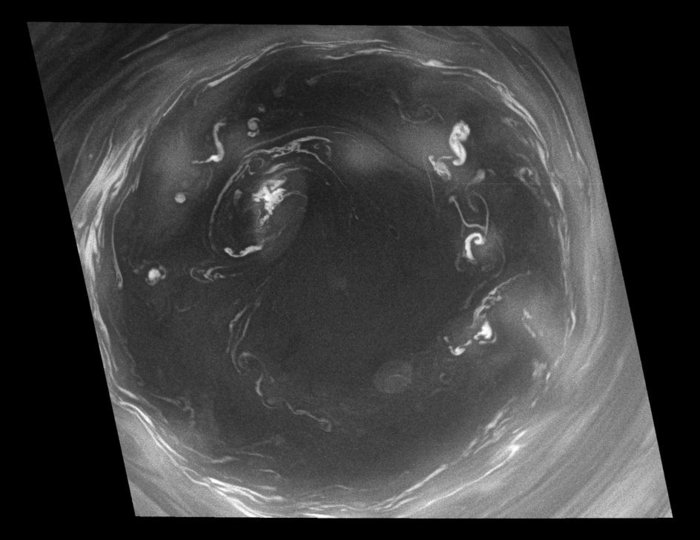
This image of Saturn's southern polar vortex reveals previously unseen detail of the giant storm. Image: NASA/JPL/Space Science Institute
Atmospheric features on our Solar System’s gas giants dwarf anything similar on Earth. Earth’s atmosphere spawns hurricanes as larger as 1500 km in diameter. But on Saturn, a feature called the southern polar vortex has an eye that is 8,000 km across, or two thirds the diameter of the entire Earth.
A new high-resolution of Saturn’s southern polar vortex captured by the Cassini probe is ten times more detailed than any previous picture, and reveals details that were previously unseen. The image, which is a composite of two images taken by Cassini in July 2008, was captured when the spacecraft was 392,000 km from Saturn, and 56º below the plane of Saturn’s rings. Despite the distance and position, the image still has a resolution of 2 km per pixel.
Previous images of the vortex revealed clouds of immense proportions ringing the edge of the vortex, but showed the vortex itself to be clear. This is similar to a hurricane on Earth, where the eye itself is clear, but is ringed by wall-clouds of towering heights. This new image shows cloud formations within the vortex itself. The vortex is punctuated with wispy white cloud formations, and a smaller vortex at 10:00 within the larger formation.
The clouds inside the vortex are more than just pretty curiosities, of course. They are deep convective structures welling up from deep within Saturn’s atmosphere, and they form their own distinctive ring. This is all the more interesting because the eye of the vortex itself is generally clear, and is considered by scientists to be an area of downwelling.
The convection on display in Saturn’s southern polar vortex is an important clue to understanding how Saturn transfers energy through its atmosphere. On Earth, hurricanes are caused by warm water, and they move across the surface of the ocean as the warm water does.
Saturn, of course, has no liquid ocean, and the vortex is powered by warm atmospheric gases from deeper in Saturn. As they rise and cool they condense into clouds. The vortex also remains stationary, rather than following a warm mass of water. It’s locked into position over Saturn’s south pole.
Cassini’s narrow angle camera captured this new image, using a combination of two spectral filters. One was sensitive to wavelengths of polarized visible light centered at 617 nanometers, and the other to infrared light centered at 750 nanometers.
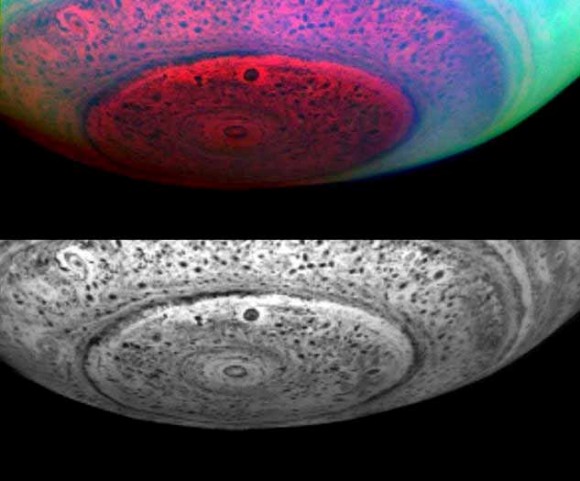
These two previously released infrared images of Saturn show the entire south polar region with the hurricane-like vortex in the center. The top image shows the polar region in false color, with red, green, and blue depicting the appearance of the pole in three different near-infrared colors (NASA/JPL/University of Arizona)
Cassini is a joint mission of NASA, the ESA, and the Italian Space Agency. It was launched in 1997, and has had its mission extended to September 2017. Cassini will end its mission in what the team operating Cassini is calling a Grand Finale. This will be a series of deep dives between Saturn and its rings, and will end with the spacecraft plunging into Saturn’s atmosphere.
Yikes! The Mothership has returned to Wyoming a la “Close Encounters of the Third Kind!” Yesterday a gigantic storm cloud spun into a flying saucer shape in eastern Wyoming near Newcastle and a storm-chasing group called Basehunters captured it all on film. Luckily, by the end of the footage, the storm dissipates.
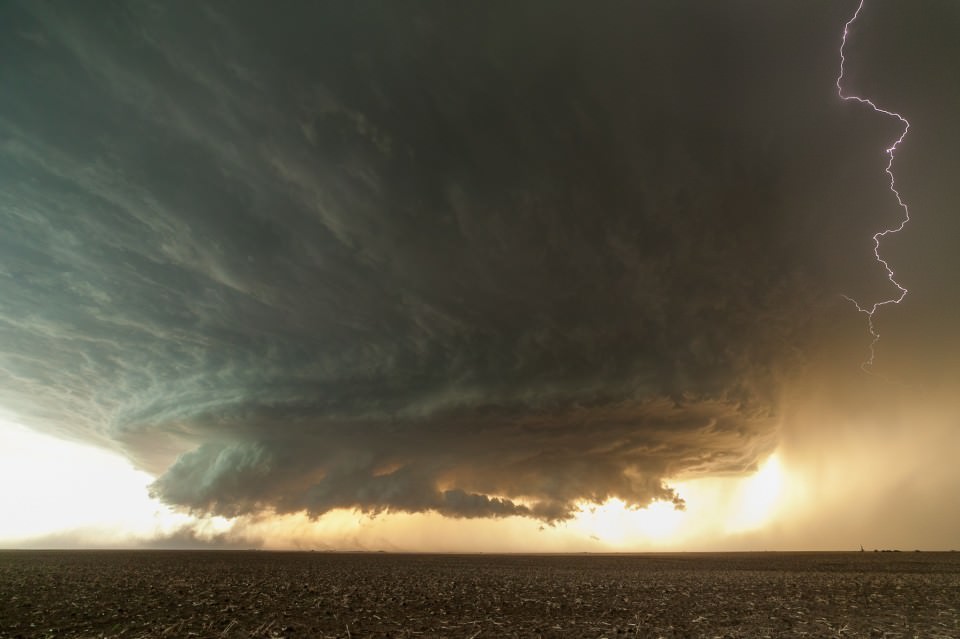
An impressive, gorgeous, powereful supercell northwest of Booker, Texas from June 3rd, 2013. Credit and copyright: Mike Olbinski/Olbinski Photography.
Photographer and storm chaser Mike Olbinski has captured some incredible storm footage over the years (such as this apocalyptic haboob in Arizona in 2011.) But his latest timelapse was something he’s been chasing down for over four years: a rotating supercell. Mike lives in Arizona, where that type of storm doesn’t happen. But he regularly visits the US Central Plains and said on his website that he’s been hoping to capture footage of “clouds that rotate and look like alien spacecraft hanging over the Earth.”
To quote Mike again, “Boy, did we find it.”
On June 3, 2013 he and his team were following storms near Booker, Texas. “We chased this storm from the wrong side (north) and it took us going through hail and torrential rains to burst through on the south side. And when we did…this monster cloud was hanging over Texas and rotating like something out of Close Encounters.”
Watch it below:
It never turned into a tornado, thankfully.
The timelapse was shot on a Canon 5D Mark II with a Rokinon 14mm 2.8 lens.
Mike says:
It’s broken up into four parts. The first section ends because it started pouring on us. We should have been further south when we started filming but you never know how long these things will last, so I started the timelapse as soon as I could.
One thing to note early on in the first part is the way the rain is coming down on the right and actually being sucked back into the rotation. Amazing.
This video has gone viral, and unfortunately some sites aren’t crediting Mike as the photographer. But just to be clear, this is a Mike Olbinski original!
The powerful windstorms that swept across the US last week was captured by several different satellites. This type of storm, called a derecho, moved from Illinois to the Mid-Atlantic states on June 29, and the movie from NOAA’s GOES-13 satellite shows the storms’ sudden expansion and speed. The storms left a more than 1,000-km (700-mile) trail of destruction across the Midwest and mid-Atlantic, cutting power to millions and killing thirteen people.
A derecho (pronounced “deh-REY-cho”) is not your average, ordinary local summer thunderstorm. These are widespread, long-lived but rare wind storms that are usually associated with a band of rapidly moving showers or thunderstorms. Damage from a derecho is usually in one direction along a relatively straight track. By definition an event is classified a derecho if the wind damage swath extends more than 400 km (240 miles) and includes wind gusts of at least 93 km/h (58 mph) or greater along most of its length.
These storms occur in the United States during the late spring and summer, with more than three quarters occurring between April and August.
The movie begins on June 28 at 15:15 UTC (11:15 a.m. EDT) and ends on June 30, 2012 at 16:01 UTC (12:01 p.m. EDT). In the animation, the derecho’s clouds appear as a line in the upper Midwest on June 29 at 14:32. By 16:02 UTC, they appear as a rounded area south of Lake Michigan. By 21:32, the area of the derecho’s clouds were near Lake Erie and over Ohio expanding as the system track southeast. By 06:30 UTC, the size appears to have almost doubled as the derecho moves over West Virginia, Maryland, Pennsylvania and Virginia. At 02:32 UTC on June 30 (10:32 p.m. EDT), the Derecho was over the mid-Atlantic bringing a 160 km (100 mile) line of severe storms and wind gusts as high as 144 km/h (90 mph) to the region.
“It is interesting how the process is a self-sustaining process that is fed by a combination of atmospheric factors that all have to be in place at the same time,” said Joe Witte, a meteorologist in Climate Change Communication at George Mason University, Va. and a consultant to NASA. “That is why they are relatively rare: not all the elements line up that often.”
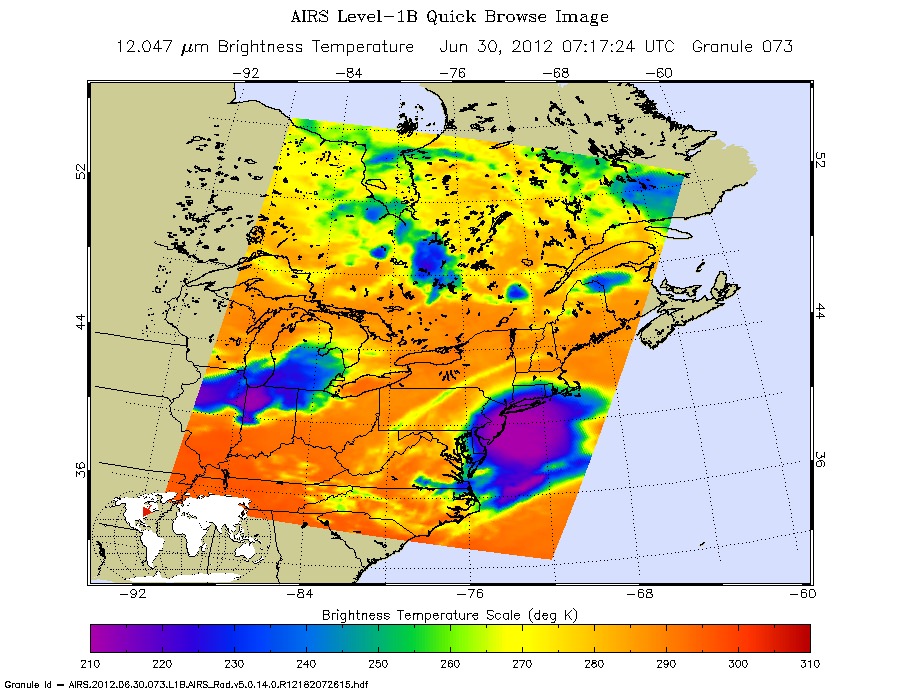
NASA’s Aqua satellite flew over the derecho on June 29 and June 30, using the Atmospheric Infrared Sounder instrument (AIRS) onboard to capture infrared imagery of the event, as seen above.
“The AIRS infrared image shows the high near-surface atmospheric temperatures blanketing the South and Midwestern U.S., approaching 98 degrees Fahrenheit,” said Ed Olsen of the AIRS Team at NASA’s Jet Propulsion Laboratory.
The AIRS images for June 30 show areas of intense convection centered off the New Jersey coast and another, less intense, system over Iowa-Indiana-Ohio. The area off the New Jersey coast is no longer a rapidly moving linear front. The near-surface atmospheric temperatures over the South and Midwest had decreased by 10 to 15 Fahrenheit in most areas,” Olsen said.
NASA’s Suomi National Polar-orbiting Partnership satellite (NPP) captured night-time images on June 28 and June 30, that reflected the massive blackouts that occurred after the derecho swept through the mid-Atlantic states. You can see the comparison images here at NASA’s Earth Observatory website.
The mechanics of a derecho go like this: The downburst mentioned by Witte, above, occurs when cold air in the upper atmosphere is cooled more by the evaporation of some of the rain and melting of the frozen precipitation pushed up into the high levels of the towering cumulonimbus (thunderclouds). That cold air becomes much denser than the surrounding air and literally falls to the ground, accelerating like any other falling body.
“The huge blob of very cold air from the upper atmosphere has a higher forward wind speed since it is high in the atmosphere,” Witte said. “This gives the ‘blob’ great forward momentum. Add that speed to the falling speed and the result is a very powerful forward moving surface wind.”
The process of a derecho can become self-sustaining as hot and humid air is forced upward by the gust front and develops more (reinforcing) towering clouds. If there is a rear low level jet stream, there is nothing to stop the repeating process.
This image from the Cassini spacecraft, shows a huge arrow-shaped storm measuring 1,500km in length. Image Credit: NASA/JPL/SSI
[/caption]
Titan is making news again, this time with Cassini images from 2010 showing a storm nearly as big as Texas. Jonathan Mitchell from UCLA and his research team have published their findings which help answer the question:
What could cause such large storms to develop on a freezing cold world?
For starters, the huge arrow isn’t a cosmic detour sign reminding us to “Attempt No Landings” on Jupiter’s moon Europa.
In the study by Mitchell and his team, a model of Titan’s global weather was created to understand how atmospheric waves affect weather patterns on Titan. During their research, the team discovered a “stenciling” effect that creates distinct cloud shapes, such as the arrow-shaped cloud shown in the Cassini image above.
“These atmospheric waves are somewhat like the natural, resonant vibration of a wine glass,” Mitchell said. “Individual clouds might ‘ring the bell,’ so to speak, and once the ringing starts, the clouds have to respond to that vibration.”
Titan is the only other body in the solar system (aside from Earth) known to have an active “liquid cycle”. Much like Titan’s warmer cousin Earth, the small moon has an atmosphere primarily composed of Nitrogen. Interestingly enough Titan’s atmosphere is roughly the same mass as Earth’s and has about 1.5 times the surface pressure. At the extremely low temperatures on Titan, hydrocarbons such as methane appear in liquid form, rather than the gaseous form found on Earth.
With an active liquid both on the surface and in the atmosphere of Titan, clouds form and create rain. In the case of Titan, the rain on the plain is mainly methane. Water on Titan is rock-hard, due to temperatures hovering around -200 c.
Studies of Titan show evidence of liquid runoff, rivers and lakes, further emphasizing Titan’s parallels to Earth. Researchers believe better understanding of Titan may offer clues to understanding Earth’s early atmosphere. In another parallel to earth, the weather patterns on Titan created by the atmospheric waves can create intense rainstorms, sometimes with more than 20 times Titan’s average seasonal rainfall. These intense storms may cause erosion patterns that help form the rivers seen on Titan’s surface. Mitchell described Titan’s climate as “all-tropics”, basically comparing the weather to what is usually found near Earth’s equator. Could these storms be Titan’s equivalent of monsoon season?
Mitchell stated “Titan is like Earth’s strange sibling — the only other rocky body in the solar system that currently experiences rain”. Mitchell also added, “In future work, we plan to extend our analysis to other Titan observations and make predictions of what clouds might be observed during the upcoming season”.
The research was published Aug. 14 in the online edition of the journal Nature Geoscience .
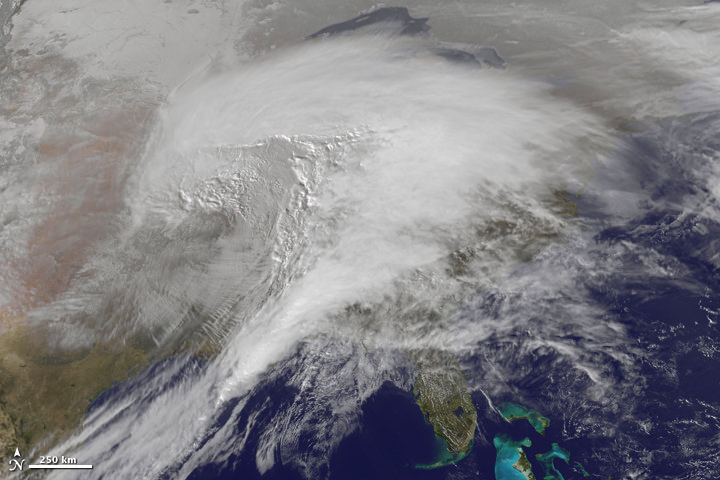
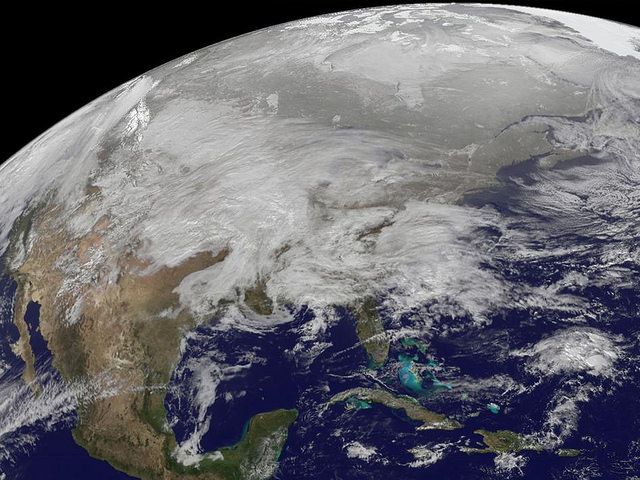
Here's an image from the top animation, the storm as seen on January 31, 2011
To speak in the vernacular of the peasantry, this storm was a whopper. Heavy snow, ice, freezing rain, and frigid wind battered about two thirds of the United States, making it “a winter storm of historic proportions,” said the National Weather Service. This animation—made with images from the NOAA-NASA GOES 13 satellite—shows the giant storm developing and moving across the country between January 31 and February 2. Below is another video view from GOES-East satellite, which includes infrared water vapor imagery from January 29 -February 1, 2011.
And there’s also an update on Cyclone Yasi.
[/caption]
Cyclone Yasi as seen on Feb. 1, 2011 from The Moderate Resolution Imaging Spectroradiometer (MODIS) on NASA’s Terra satellite
Yasi weakened after coming ashore early on Thursday morning but was still strong enough to produce high winds and tidal surges that sent waves crashing deep into seaside communities. Thankfully, so far no lives have been lost because of this storm. Officials said lives were saved because after days of dire warnings people heeded directions to flee to evacuation centers or bunker themselves at home. Track the storm on WeatherUnderground, and read more on the latest news from Yasi on The Guardian.
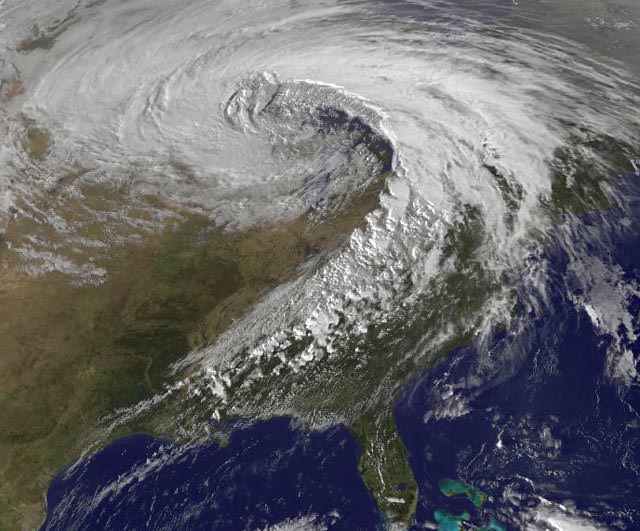
The GOES-13 satellite captured this image on Jan. 31, 2011 of a major winter storm covering a large portion of the US. Image Credit: NOAA/NASA GOES Project
[/caption]
The roads are a skating rink where I live! This visible image was captured by the GOES-13 satellite on January 31, 2011 and it shows the low pressure area bringing snowfall to the Midwest US. Heavy snow is expected today in portions of northern Iowa, southern Minnesota and Wisconsin. Snowfall from the system extends from Michigan west to Montana, Idaho, Utah and Arizona. A mix of rain and snow also stretches into the Ohio and Tennessee valleys, and it is all moving east. This system appears to be as large as 1/3rd of the Continental U.S.
Meanwhile, in another hemisphere on the other side of the world a huge tropical cyclone threatens parts of Australia that has already been suffering from flooding.
of Tropical Cyclone Yasi taken at 6:29 a.m. PST (9:29 a.m. EST) on Jan. 31, 2011. Areas colored purple represent the storm's coldest cloud-top temperatures and areas of heaviest precipitation. Image credit: NASA/JPL-Caltech
The northeastern Australian state of Queensland is now bracing for what could become one of the largest tropical cyclones the state has ever seen.
The Atmospheric Infrared Sounder (AIRS) instrument on NASA’s Aqua satellite captured this infrared image of Yasi on Jan. 31, 2011, at 6:29 a.m. PST (9:29 a.m. EST). The AIRS data create an accurate 3-D map of atmospheric temperature, water vapor and clouds, data that are useful to forecasters. The image shows the temperature of Yasi’s cloud tops or the surface of Earth in cloud-free regions.
The coldest cloud-top temperatures appear in purple, indicating towering cold clouds and heavy precipitation. The infrared signal of AIRS does not penetrate through clouds. Where there are no clouds, AIRS reads the infrared signal from the surface of the ocean waters, revealing warmer temperatures in orange and red.
At the approximate time this image was taken, Yasi had maximum sustained winds near 90 knots (166 kilometers per hour, or 103 mph), equivalent to a Category Two hurricane on the Saffir-Simpson Scale. It was centered about 1,400 kilometers (875 miles) east of Cairns, Australia, moving west at about 19 knots per hour (35 kilometers per hour, or 22 mph). Cyclone-force winds extend out to 48 kilometers (30 miles) from the center.
Yasi is forecast to move west, then southwestward, into an area of low vertical wind shear (strong wind shear can weaken a storm). Forecasters at the Joint Typhoon Warning Center expect Yasi to continue to strengthen over the next 36 hours. The Center forecasts a landfall just south of Cairns as a large 100-plus knot-per-hour (185 kilometers per hour, or 115 mph) system by around midnight local time on Wednesday, Feb. 2.
Visible satellite image of the October 26, 2010 superstorm taken at 5:32pm EDT. Image credit: NASA/GSFC.
[/caption]
Yowza! – Here’s a satellite image of a storm of record-breaking proportions. On October 26, 2010, the strongest storm ever recorded in the Midwest spawned 24 tornadoes, 282 reports of damaging winds, violent thunderstorms, and torrential rains. The mega-storm reached peak intensity late yesterday afternoon over Minnesota, resulting in the lowest barometric pressure readings ever recorded in the continental United States (except for from hurricanes and nor’easters affecting the Atlantic seaboard.) The storm continues today (Oct. 27) with more tornado watches posted for Mississippi, Alabama, and Georgia, a blizzard warning for North Dakota, high wind warnings for most of the upper Midwest, and near-hurricane force winds on Lake Superior.
Read more about this super-storm on Weather Underground, but see below for what extremely low air pressure means.
Air pressure is one of the most important factors which determines what the weather is like. A mass of low pressure is an area of air that is rising. As it rises, it expands and cools. Cooler air cannot hold as much water as warmer air, so as the air rises the water will condense and form clouds. This is why an area of low pressure will often be accompanied by clouds and rain — which is what occurred on October 26 — lots of clouds and lots of rain and even snow.
But winds were even a bigger factor in this superstorm. Our atmosphere really doesn’t like big differences in air pressure, so where areas of low pressure meet up with areas of high pressure, winds blow in an attempt to combat the differences in the air pressure. The larger the difference in pressure the stronger the winds will blow. So, the extreme low pressure readings yesterday meant the winds were really howling — and they were. In my neighborhood in Illinois, we had a fairly study flagpole get bent from the winds. But that was nothing compared to the hurricane-like winds other places experienced: for example, Grand Marais, Minnesota — near the Great Lakes and near the area of the lowest air pressure readings — had sustained winds of 43 mph gusting to 59 mph, lasting for over 7 hours. Today, that region is still getting pummeled by winds and snow.
You can see the link to Weather Underground above to see what other weather extremes were experienced during this storm.

 on NASA’s Terra satellite")
 on Jan. 31, 2011. Areas colored purple represent the storm's coldest cloud-top temperatures and areas of heaviest precipitation. Image credit: NASA/JPL-Caltech")