Special Guest:
Dr. Jeffrey Forshaw is a British particle physicist with an interest in quantum chromodynamics (QCD) which is the study of the behavior of subatomic particles. Dr. Forshaw is the co-author (with Brian Cox) of Universal: A Guide to the Cosmos, which sends readers on an inspirational journey of scientific exploration.
We use a tool called Trello to submit and vote on stories we would like to see covered each week, and then Fraser will be selecting the stories from there. Here is the link to the Trello WSH page (http://bit.ly/WSHVote), which you can see without logging in. If you’d like to vote, just create a login and help us decide what to cover!
Announcements:
The WSH recently welcomed back Mathew Anderson, author of “Our Cosmic Story,” to the show to discuss his recent update. He was kind enough to offer our viewers free electronic copies of his complete book as well as his standalone update. Complete information about how to get your copies will be available on the WSH webpage – just visit http://www.wsh-crew.net/cosmicstory for all the details.
If you would like to join the Weekly Space Hangout Crew, visit their site here and sign up. They’re a great team who can help you join our online discussions!
We record the Weekly Space Hangout every Friday at 12:00 pm Pacific / 3:00 pm Eastern. You can watch us live on Universe Today, or the Universe Today YouTube page
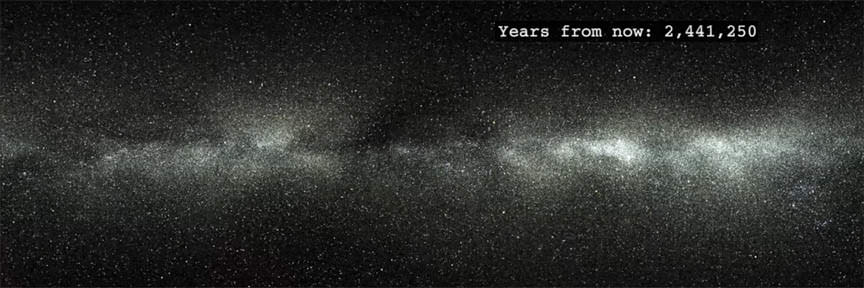
Gaze into Gaia’s crystal ball and you will see the future. This video shows the motion of 2,057,050 stars in the coming 5 million years from the Tycho-Gaia Astrometric Solutionsample, part of the first data release of European Space Agency’s Gaia mission.
Gaia is a space observatory parked at the L2 Lagrange Point, a stable place in space a million miles behind Earth as viewed from the Sun. Its mission is astrometry: measuring the precise positions, distances and motion of 1 billion astronomical objects (primarily stars) to create a three-dimensional map of the Milky Way galaxy. Gaia’s radial velocity measurements — the motion of stars toward or away from us — will provide astronomers with a stereoscopic and moving-parts picture of about 1% of the galaxy’s stars.
Think about how slowly stars move from the human perspective. Generations of people have lived and died since the days of ancient Greece and yet the constellations outlines and naked eye stars appear nearly identical today as they did then. Only a few stars — Arcturus, Sirius, Aldebaran — have moved enough for a sharp-eyed observer of yore to perceive their motion.
Given enough time, stars do change position, distorting the outlines of the their constellations. This view shows the sky looking north in 91,000 A.D. Both Lyra and the Big Dipper are clearly bent out of shape! Created with Stellarium
We know that stars are constantly on the move around the galactic center. The Sun and stars in its vicinity orbit the core at some half-million miles an hour, but nearly all are so far away that their apparent motion has barely moved the needle over the time span of civilization as we know it.
This video shows more than 2 million stars from the TGAS sample, with the addition of 24,320 bright stars from the Hipparcos Catalogue that weren’t included in Gaia’s first data release back in September 2016. The video starts from the positions of stars as measured by Gaia between 2014 and 2015, and shows how these positions are expected to evolve in the future, based on the stars’ proper motions or direction of travel across space.
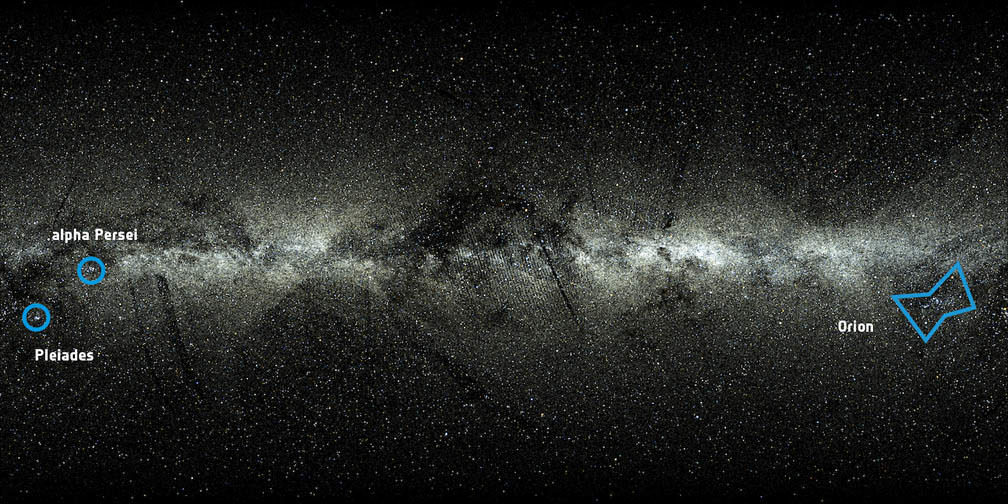
This frame will help you get your footing as you watch the video. Orion (at right) and the Alpha Persei stellar association and Pleiades (at left) are shown. Credit: ESA/Gaia/DPAC
Watching the show
The frames in the video are separated by 750 years, and the overall sequence covers 5 million years. The dark stripes visible in the early frames reflect the way Gaia scans the sky (in strips) and the early, less complete database. The artifacts are gradually washed out as stars move across the sky.
Using the map above to get oriented, it’s fun to watch Orion change across the millennia. Betelgeuse departs the constellation heading north fairly quickly, but Orion’s Belt hangs in there for nearly 2 million years even if it soon develops sag! The Pleiades drift together to the left and off frame and then reappear at right.
Stars seem to move with a wide range of velocities in the video, with stars in the galactic plane moving quite slow and faster ones speeding across the view. This is a perspective effect: most of the stars we see in the plane are much farther from us, and thus seem to be moving slower than the nearby stars, which are visible across the entire sky.
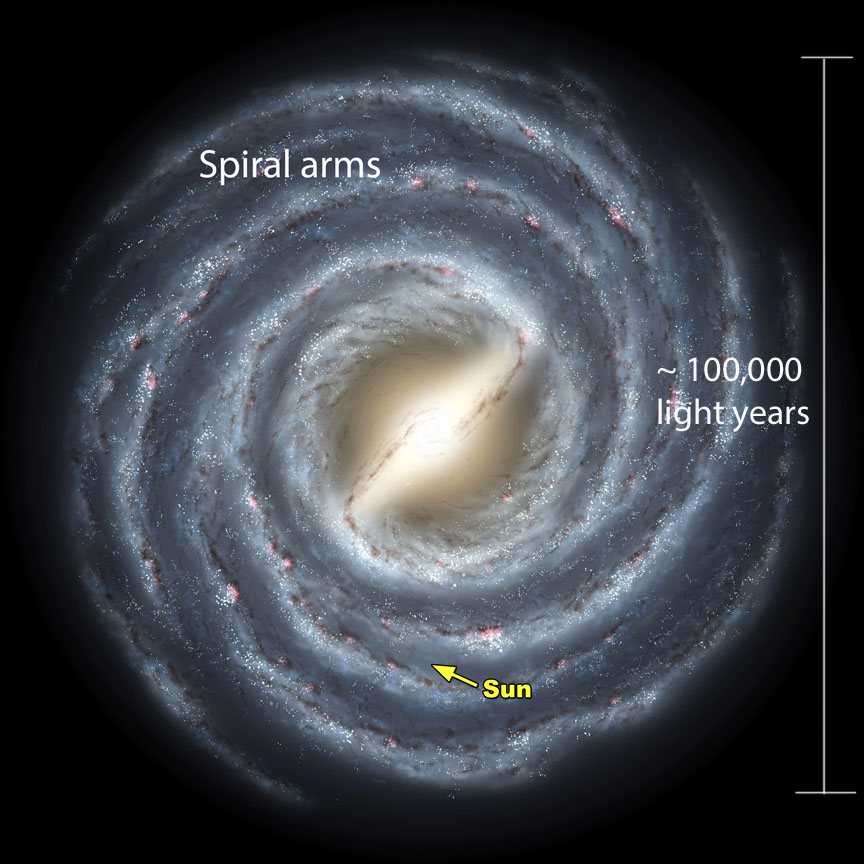
Artist’s impression of The Milky Way Galaxy to provide context for the video. The Sun and solar system are located in the flat plane of the galaxy, so when we look into the Milky Way (either toward the center or toward the edge), the stars pile up across the light years to form a band in the sky. If we could rise above the disk and see the galaxy from the halo, we’d be able to look down (or up) and see the galaxy as a disk with winding spiral arms. Credit: NASA
Some of the stars that appear to zip in and out of view quickly are passing close to the Sun. But motion of those that trace arcs from one side of the sky to the other while passing close to the galactic poles (top and bottom of the frame) as they speed up and slow down, is spurious. These stars move with a constant velocity through space.
Stars located in the Milky Way’s halo, a roughly spherical structure centered on the galaxy’s spiral disk, also appear to move quite fast because they slice through the galactic plane with respect to the Sun. In reality, halo stars move very slowly with respect to the center of the galaxy.
Early in the the visualization, we see clouds of interstellar gas and dust that occupy vast spaces within the galaxy and block the view of more distant suns. That these dark clouds seem to disappear over time is also a spurious effect.
After a few million years, the plane of the Milky Way appears to have shifted towards the right as a consequence of the motion of the Sun with respect to that of nearby stars in the Milky Way. Regions that are depleted of stars in the video will not appear that way to future stargazers but will instead be replenished by stars not currently sampled by Gaia. So yes, there are a few things to keep in mind while watching these positional data converted into stellar motions, but the overall picture is an accurate one.
I find the video as mesmerizing as watching fireflies on a June night. The stars seem alive. Enjoy your ride in the time machine!
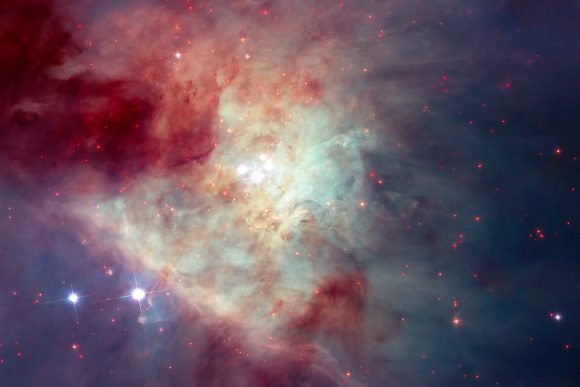
The stunning, shaped clouds of gas in the Orion Nebula make it beautiful, but also make it difficult to see inside of. This image of the Orion Nebula was captured by the Hubble Telescope. Image: NASA, ESA, M. Robberto (STScI/ESA) and
The Hubble Space Telescope Orion Treasury Project Team
It sometimes doesn’t take much to tear a family apart. A Christmas dinner gone wrong can do that. But for a family of stars to be torn apart, something really huge has to happen.
The dramatic break-up of a family of stars played itself out in the Orion Nebula, about 600 years ago. The Orion Nebula is one of the most studied objects in our galaxy. It’s an active star forming region, where much of the star birth is concealed behind clouds of dust. Advances in infrared and radio astronomy have allowed us to peer into the Nebula, and to watch a stellar drama unfolding.
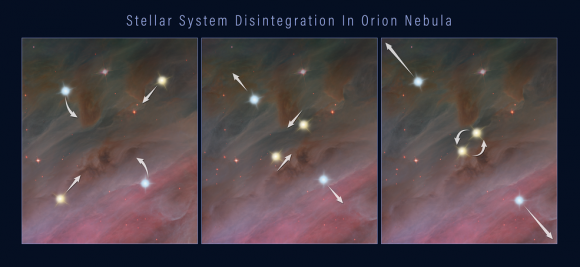
This three-frame illustration shows how a grouping of stars can break apart, flinging the members into space. Panel 1: members of a multiple-star system orbiting each other. Panel 2: two of the stars move closer together in their orbits. Panel 3: the closely orbiting stars eventually either merge or form a tight binary. This event releases enough gravitational energy to propel all of the stars in the system outward, as shown in the third panel. Credits: NASA, ESA, and Z. Levy (STScI)
Over the last few decades, observations showed the two of the stars in our young family travelling off in different directions. In fact, they were travelling in opposite directions, and moving at very high speeds. Much higher than stars normally travel at. What caused it?
Astronomers were able to piece the story together by re-tracing the positions of both stars back 540 years. All those centuries ago, around the same time that it was dawning on humanity that Earth revolved around the Sun instead of the other way around, both of the speeding stars were in the same location. This suggested that the two were part of a star system that had broken up for some reason. But their combined energy didn’t add up.
Now, the Hubble has provided another clue to the whole story, by spotting a third runaway star. They traced the third star’s path back 540 years and found that it originated in the same location as the others. That location? An area near the center of the Orion Nebula called the Kleinmann-Low Nebula.
This composite image of the Kleinmann-Low Nebula, part of the Orion Nebula complex, is composed of several pointings of the NASA/ESA Hubble Space Telescope in optical and near-infrared light. Infrared light allows to peer through the dust of the nebula and to see the stars therein. The revealed stars are shown with a bright red colour in the image. With this image, showing the central region of the Orion Nebula, scientists were looking for rogue planets and brown dwarfs. As side-effect they found a fast-moving runaway star. By ESA/Hubble, CC BY 4.0, https://commons.wikimedia.org/w/index.php?curid=57169218
The team behind these new results, led by Kevin Luhman of Penn State University, will release their findings in the March 20, 2017 issue of The Astrophysical Journal Letters.
“The new Hubble observations provide very strong evidence that the three stars were ejected from a multiple-star system,” said Luhman. “Astronomers had previously found a few other examples of fast-moving stars that trace back to multiple-star systems, and therefore were likely ejected. But these three stars are the youngest examples of such ejected stars. They’re probably only a few hundred thousand years old. In fact, based on infrared images, the stars are still young enough to have disks of material leftover from their formation.”
Young stars have a disk of gas and dust around them called a protoplanetary disk. Credit: NASA/JPL-Caltech
“The Orion Nebula could be surrounded by additional fledging stars that were ejected from it in the past and are now streaming away into space.” – Lead Researcher Kevin Luhman, Penn State University.
The three stars are travelling about 30 times faster than most of the Nebula’s other stellar inhabitants. Theory has predicted the phenomenon of these breakups in regions where newborn stars are crowded together. These gravitational back-and-forths are inevitable. “But we haven’t observed many examples, especially in very young clusters,” Luhman said. “The Orion Nebula could be surrounded by additional fledging stars that were ejected from it in the past and are now streaming away into space.”
The key to this mystery is the recently discovered third star. But this star, the so-called “source x”, was discovered by accident. Luhman is part of a team using the Hubble to hunt for free-floating planets in the Orion Nebula. A comparison of Hubble infrared images from 2015 with images from 1998 showed that source x had changed its position. This indicated that the star was moving at a speed of about 130,000 miles per hour.
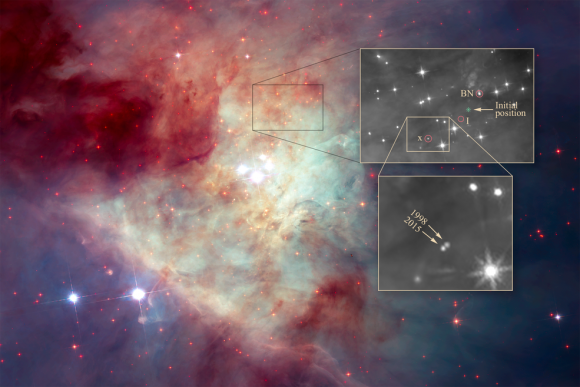
The image by NASA’s Hubble Space Telescope shows a grouping of young stars, called the Trapezium Cluster (center). The box just above the Trapezium Cluster outlines the location of the three stars. A close-up of the stars is top right. The birthplace of the multi-star system is marked “initial position.” Two of the stars — labeled BN, and “I,” for source I — were discovered decades ago. Source I is embedded in thick dust and cannot be seen. The third star, “x,” for source x, was recently discovered to have moved noticeably between 1998 and 2015, as shown in the inset image at bottom right. Credits: NASA, ESA, K. Luhman (Penn State University), and M. Robberto (STScI)
Luhmann then re-traced source x’s path and it led to the same position as the other 3 runaway stars 540 years ago: the Kleinmann-Low Nebula.
According to Luhmann, the three stars were most likely ejected from their system due to gravitational fluctuations that should be common in a high-population area of newly-born stars. Two of the stars can come very close together, either forming a tight binary system or even merging. That throws the gravitational parameters of the system out of whack, and other stars can be ejected. The ejection of those stars can also cause fingers of matter to flow out of the system.
As we get more powerful telescopes operating in the infrared, we should be able to clarify exactly what happens in areas of intense star formation like the Orion Nebula and its embedded Kleinmann-Low Nebula. The James Webb Space Telescope should advance our understanding greatly. If that’s the case, then not only will the details of star birth and formation become much clearer, but so will the break up of young families of stars.
We use a tool called Trello to submit and vote on stories we would like to see covered each week, and then Fraser will be selecting the stories from there. Here is the link to the Trello WSH page (http://bit.ly/WSHVote), which you can see without logging in. If you’d like to vote, just create a login and help us decide what to cover!
If you would like to join the Weekly Space Hangout Crew, visit their site here and sign up. They’re a great team who can help you join our online discussions!
If you would like to sign up for the AstronomyCast Solar Eclipse Escape, where you can meet Fraser and Pamela, plus WSH Crew and other fans, visit our site linked above and sign up!
We record the Weekly Space Hangout every Friday at 12:00 pm Pacific / 3:00 pm Eastern. You can watch us live on Universe Today, or the Universe Today YouTube page<
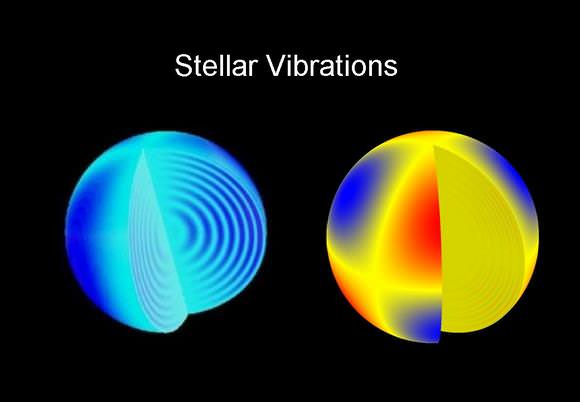
At one time, scientists believed that the Earth, the Moon, and all the other planets in our Solar System were perfect spheres. The same held true for the Sun, which they considered to be the heavenly orb that was the source of all our warmth and energy. But as time and research showed, the Sun is far from perfect. In addition to sunspots and solar flares, the Sun is not completely spherical.
For some time, astronomers believed this was the case with other stars as well. Owing to a number of factors, all stars previously studied by astronomers appeared to experience some bulging at the equator (i.e. oblateness). However, in a study published by a team of international astronomers, it now appears that a slowly rotating star located 5000 light years away is as close to spherical as we’ve ever seen!
Until now, observation of stars has been confined to only a few of the fastest-rotating nearby stars, and was only possible through interferometry. This technique, which is typically used by astronomers to obtain stellar size estimates, relies on multiple small telescopes obtaining electromagnetic readings on a star. This information is then combined to create a higher-resolution image that would be obtained by a large telescope.
Artist’s impression of a Sirius, an A-type Main Sequence White star. Credit: NASA, ESA and G. Bacon (STScI)
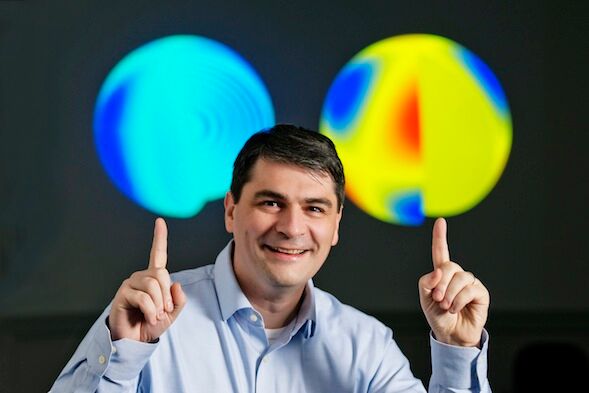
Laurent Gizon, a researcher with the Max Planck Institute, was the lead authjor on the paper. As he explained their research methodology to Universe Today via email:
“The new method that we propose in this paper to measure stellar shapes, asteroseismology, can be several orders of magnitude more precise than optical interferometry. It applies only to stars that oscillate in long-lived non-radial modes. The ultimate precision of the method is given by the precision on the measurement of the frequencies of the modes of oscillation. The longer the observation duration (four years in the case of Kepler), the better the precision on the mode frequencies. In the case of KIC 11145123 the most precise mode frequencies can be determined to one part in 10,000,000. Hence the astonishing precision of asteroseismology.”
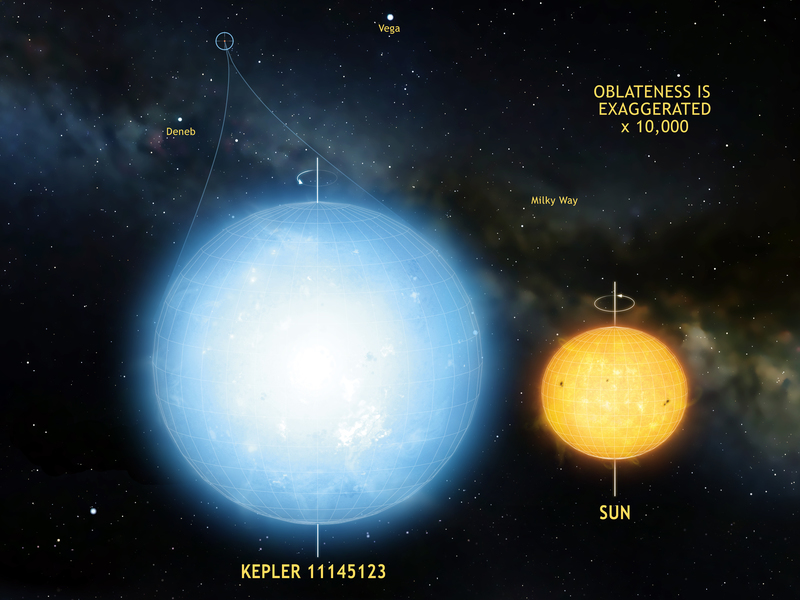
Located 5000 light years away from Earth, KIC 11145123 was considered a perfect candidate for this method. For one, Kepler 11145123 is a hot and luminous, over twice the size of our Sun, and rotates with a period of 100 days. Its oscillations are also long-lived, and correspond directly to fluctuations in its brightness. Using data obtained by NASA’s Kepler mission over a more than four year period, the team was able to get very accurate shape estimates.
The variations in brightness can be interpreted as vibrations, or oscillations within the stars, using a technique called asteroseismology. Credit: Kepler Astroseismology team.
“We compared the frequencies of the modes of oscillation that are more sensitive to the low-latitude regions of the star to the frequencies of the modes that are more sensitive to higher latitudes,” said Gizon. “This comparison showed that the difference in radius between the equator and the poles is only 3 km with a precision of 1 km. This makes Kepler 11145123 the roundest natural object ever measured, it is even more round than the Sun.”
For comparison, our Sun has a rotational period of about 25 days, and the difference between its polar and equatorial radii is about 10 km. And on Earth, which has a rotational period of less than a day (23 hours 56 minutes and 4.1 seconds), there is a difference of over 23 km (14.3 miles) between its polar and equator. The reason for this considerable difference is something of a mystery.
In the past, astronomers have found that the shape of a star can come down to multiple factors – such as their rotational velocity, magnetic fields, thermal asphericities, large-scale flows, strong stellar winds, or the gravitational influence of stellar companions or giant planets. Ergo, measuring the “asphericity” (i.e. the degree to which a star is NOT a sphere) can tell astronomers much about the star structures and its system of planets.
Ordinarily, rotational velocity has been seen to have a direct bearing on the stars asphericity – i.e. the faster it rotates, the more oblate it is. However, when looking at data obtained by the Kepler probe over a period of four years, they noticed that its oblateness was only a third of what they expected, given its rotational velocity.
Laurent Gizon, the lead researcher of the study, pictured with asteroseismic readings of Kepler 11145123. Credit: Max Planck Institute for Solar System Research, Germany.
As such, they were forced to conclude that something else was responsible for the star’s highly spherical shape. “”We propose that the presence of a magnetic field at low latitudes could make the star look more spherical to the stellar oscillations,” said Gizon. “It is known in solar physics that acoustic waves propagate faster in magnetic regions.”
Looking to the future, Gizon and his colleagues hope to examine other stars like Kepler 11145123. In our Galaxy alone, there are many stars who’s oscillations can be accurately measured by observing changes in their brightness. As such, the international team hopes to apply their asteroseismology method to other stars observed by Kepler, as well as upcoming missions like TESS and PLATO.
“Just like helioseismology can be used to study the Sun’s magnetic field, asteroseismology can be used to study magnetism on distant stars,” Gizon added. “This is the main message of this study.”
Artist's impression of The Milky Way Galaxy. Based on current estimates and exoplanet data, it is believed that there could be tens of billions of habitable planets out there. Credit: NASA
On a clear night, and when light pollution isn’t a serious factor, looking up at the sky is a breathtaking experience. On occasions like these, it is easy to be blown away by the sheer number of stars out there. But of course, what we can see on any given night is merely a fraction of the number of stars that actually exist within our Galaxy.
What is even more astounding is the notion that the majority of these stars have their own system of planets. For some time, astronomers have believed this to be the case, and ongoing research appears to confirm it. And this naturally raises the question, just how many planets are out there? In our galaxy alone, surely, there must be billions!
Number of Planets per Star:
To truly answer that question, we need to crunch some numbers and account for some assumptions. First, despite the discovery of thousands of extra-solar planets, the Solar System is still the only one that we have studied deeply. So it could be that ours possesses more star systems than others, or that our Sun has a fraction of the planets that other stars do.
So let’s assume that the eight planets that exist within our Solar System (not taking into account Dwarf Planets, Centaurs, KBOs and other larger bodies) represent an average. The next step will be to multiply that number by the amount of stars that exist within the Milky Way.
Number of Stars:
To be clear, the actual number of stars in the Milky Way is subject to some dispute. Essentially, astronomers are forced to make estimates due to the fact that we cannot view the Milky Way from the outside. And given that the Milky Way is in the shape of a barred, spiral disc, it is difficult for us to see from one side to the other – thanks to light interference from its many stars.
As a result, estimates of how many stars there are come down to calculations of our galaxy’s mass, and estimates of how much of that mass is made up of stars. Based on these calculations, scientists estimate that the Milky Way contains between 100 and 400 billion stars (though some think there could be as many as a trillion).
Doing the math, we can then say that the Milky Way galaxy has – on average – between 800 billion and 3.2 trillion planets, with some estimates placing that number as high a 8 trillion! However, in order to determine just how many of them are habitable, we need to consider the number of exoplanets discovered so far for the sake of a sample analysis.
Habitable Exoplanets:
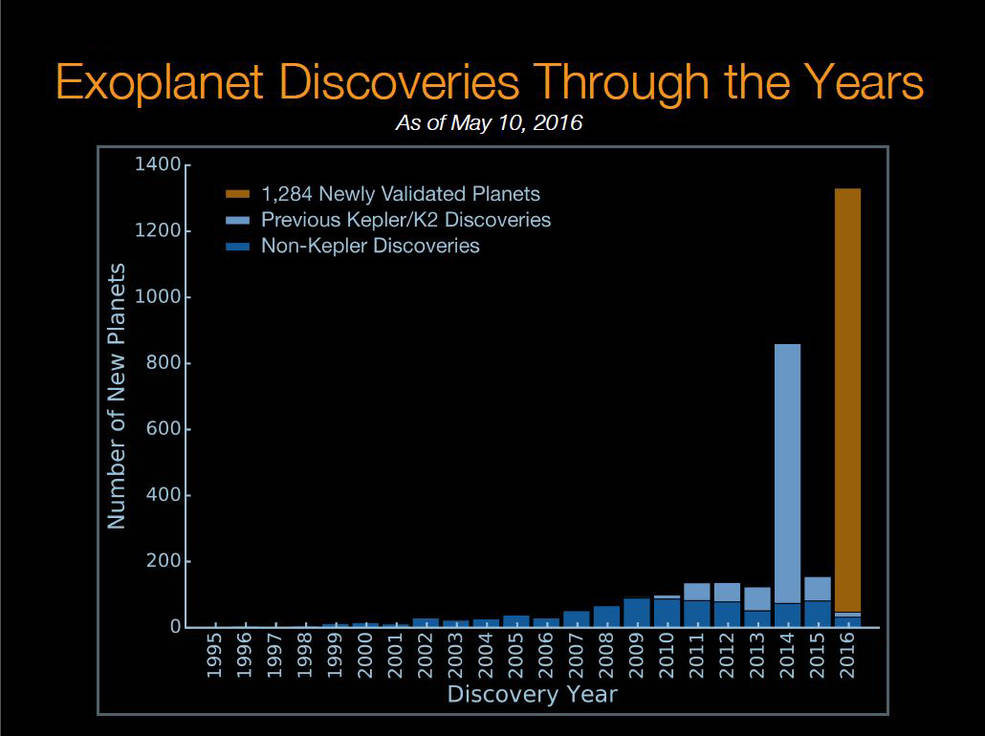
As of October 13th, 2016, astronomers have confirmed the presence of 3,397 exoplanets from a list of 4,696 potential candidates (which were discovered between 2009 and 2015). Some of these planets have been observed directly, in a process known as direct imaging. However, the vast majority have been detected indirectly using the radial velocity or transit method.
In the case of the former, the existence of planets is inferred based on the gravitational influence they have on their parent star. Essentially, astronomers measure how much the star moves back and forth to determine if it has a system of planets and how massive they are. In the case of the transit method, planets are detected when they pass directly in front of their star, causing it to dim. Here, size and mass are estimated based on the level of dimming.
In the course of its mission, the Kepler mission has observed about 150,000 stars, which during its initial four year mission consisted primarily of M-class stars. Also known as red dwarfs, these low-mass, lower-luminosity stars are harder to observe than our own Sun.
Histogram showing the number of exoplanets discovered by year. Credit: NASA Ames/W. Stenzel, Princeton/T. Morton
Since that time, Kepler has entered a new phase, also known as the K2 mission. During this phase, which began in November of 2013, Kepler has been shifting its focus to observe more in the way of K- and G-class stars – which are nearly as bright and hot as our Sun.
According to a recent study from NASA Ames Research Center, Kepler found that about 24% of M-class stars may harbor potentially habitable, Earth-size planets (i.e. those that are smaller than 1.6 times the radius of Earth’s). Based upon the number of M-class stars in the galaxy, that alone represents about 10 billion potentially habitable, Earth-like worlds.
Meanwhile, analyses of the K2 phase suggests that about one-quarter of the larger stars surveyed may also have Earth-size planet orbiting within their habitable zones. Taken together, the stars observed by Kepler make up about 70% of those found within the Milky Way. So one can estimate that there are literally tens of billions of potentially habitable planets in our galaxy alone.
In the coming years, new missions will be launching, like the James Webb Space Telescope (JWST) and the Transitting Exoplanet Survey Satellite (TESS). These missions will be able to detect smaller planets orbiting fainter stars, and maybe even determine if there’s life on any of them.
Once these new missions get going, we’ll have better estimates of the size and number of planets that orbit a typical star, and we’ll be able to come up with better estimates of just many planets there are in the galaxy. But until then, the numbers are still encouraging, as they indicate that the chances for extra-terrestrial intelligence are high!
We are now using a tool called Trello to submit and vote on stories we would like to see covered each week, and then Fraser will be selecting the stories from there. Here is the link to the Trello WSH page (http://bit.ly/WSHVote), which you can see without logging in. If you’d like to vote, just create a login and help us decide what to cover!
If you would like to join the Weekly Space Hangout Crew, visit their site here and sign up. They’re a great team who can help you join our online discussions!
If you would like to sign up for the AstronomyCast Solar Eclipse Escape, where you can meet Fraser and Pamela, plus WSH Crew and other fans, visit our site linked above and sign up!
We record the Weekly Space Hangout every Friday at 12:00 pm Pacific / 3:00 pm Eastern. You can watch us live on Universe Today, or the Universe Today YouTube page.
Artist's impression of a white dwarf star in orbit around Sirius (a white supergiant). Credit: NASA, ESA and G. Bacon (STScI)
Stars are beautiful, wondrous things. Much like planets, planetoids and other stellar bodies, they come in many sizes, shapes, and even colors. And over the course of many centuries, astronomers have come to discern several different types of stars based on these fundamental characteristics.
For instance, the color of a star – which varies from bluish-white and yellow to orange and red – is primarily due to its composition and effective temperature. And at all times, stars emit light which is a combination of several different wavelengths. On top of that, the color of a star can change over time.
Composition:
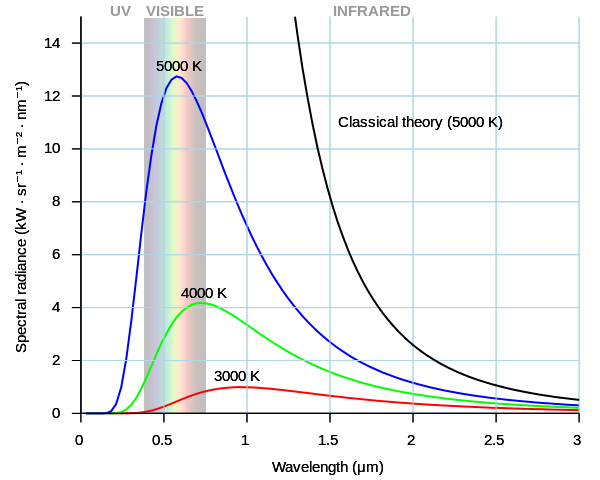
Different elements emit different wavelengths of electromagnetic radiation when heated. In the case of stars, his includes its main constituents (hydrogen and helium), but also the various trace elements that make it up. The color that we see is the combination of these different electromagnetic wavelengths, which are referred to as as a Planck’s curve.
Diagram illustrating Wein’s Law, which describes the emission of radiation from a black body based on its peak wavelength. Credit: Wikipedia Commons/Darth
The wavelength at which a star emits the most light is called the star’s “peak wavelength” (which known as Wien’s Law), which is the peak of its Planck curve. However, how that light appears to the human eye is also mitigated by the contributions of the other parts of its Planck curve.
In short, when the various colors of the spectrum are combined, they appear white to the naked eye. This will make the apparent color of the star appear lighter than where star’s peak wavelength falls on the color spectrum. Consider our Sun. Despite the fact that its peak emission wavelength corresponds to the green part of the spectrum, its color appears pale yellow.
A star’s composition is the result of its formation history. Ever star is born of a nebula made up of gas and dust, and each one is different. While nebulas in the interstellar medium are largely composed of hydrogen, which is the main fuel for star creation, they also carry other elements. The overall mass of the nebula, as well as the various elements that make it up, determine what kind of star will result.
The change in color these elements add to stars is not very obvious, but can be studied thanks to the method known as spectroanalysis. By examining the various wavelengths a star produces using a spectrometer, scientists are able to determine what elements are being burned inside.
Temperature and Distance:
The other major factor effecting a star’s color is its temperature. As stars increase in heat, the overall radiated energy increases, and the peak of the curve moves to shorter wavelengths. In other words, as a star becomes hotter, the light it emits is pushed further and further towards the blue end of the spectrum. As stars grow colder, the situation is reversed (see below).
A third and final factor that will effect what light a star appears to be emitting is known as the Doppler Effect. When it comes to sound, light, and other waves, the frequency can increase or decrease based on the distance between the source and the observer.
When it comes to astronomy, this effect causes the what is known as “redshift” and “blueshift” – where the visible light coming from a distant star is shifted towards the red end of the spectrum if it is moving away, and the blue end if it is moving closer.
Modern Classification:
Modern astronomy classifies stars based on their essential characteristics, which includes their spectral class (i.e. color), temperature, size, and brightness. Most stars are currently classified under the Morgan–Keenan (MK) system, which classifies stars based on temperature using the letters O, B, A, F, G, K, and M, – O being the hottest and M the coolest.
Each letter class is then subdivided using a numeric digit with 0 being hottest and 9 being coolest (e.g. O1 to M9 are the hottest to coldest stars). In the MK system, a luminosity class is added using Roman numerals. These are based on the width of certain absorption lines in the star’s spectrum (which vary with the density of the atmosphere), thus distinguishing giant stars from dwarfs.
Luminosity classes 0 and I apply to hyper- or supergiants; classes II, III and IV apply to bright, regular giants, and subgiants, respectively; class V is for main-sequence stars; and class VI and VII apply to subdwarfs and dwarf stars. There is also the Hertzsprung-Russell diagram, which relates stellar classification to absolute magnitude (i.e. intrinsic brightness), luminosity, and surface temperature.
The same classification for spectral types are used, ranging from blue and white at one end to red at the other, which is then combined with the stars Absolute Visual Magnitude (expressed as Mv) to place them on a 2-dimensional chart (see below).
The Hertzspirg-Russel diagram, showing the relation between star’s color, AM. luminosity, and temperature. Credit: astronomy.starrynight.com
On average, stars in the O-range are hotter than other classes, reaching effective temperatures of up to 30,000 K. At the same time, they are also larger and more massive, reaching sizes of over 6 and a half solar radii and up to 16 solar masses. At the lower end, K and M type stars (orange and red dwarfs) tend to be cooler (ranging from 2400 to 5700 K), measuring 0.7 to 0.96 times that of our Sun, and being anywhere from 0.08 to 0.8 as massive.
Stellar Evolution:
Stars also go through an evolutionary life cycle, during which time their sizes, temperatures and colors change. For example, when our Sun exhausts all the hydrogen in its the core, it will become unstable and collapse under its own weight. This will cause the core to heat up and get denser, causing the Sun to grow in size.
At this point, it will have left its Main Sequence phase and entered into the Red Giant Phase of its life, which (as the name would suggest) will be characterized by expansion and it becoming a deep red. When this happens, it is theorized that our Sun will expand to encompass the orbits of Mercury and even Venus.
Earth, if it survives this expansion, will be so close that it will be rendered uninhabitable. When our Sun then reaches its post-Red Giant Phase, the Sun will begin to eject mass, leaving an exposed core known as a white dwarf. This remnant will survive for trillions of years before fading to black.
This is believed to be the case with all stars that have between 0.5 to 1 Solar Mass (half, or as much mass of our Sun). The situation is slightly different when it comes to low mass stars (i.e. red dwarfs), which typically have around 0.1 Solar Masses.
It is believed that these stars can remain in their Main Sequence for some six to twelve trillion years and will not experience a Red Giant Phase. However, they will gradually increase in both temperature and luminosity, and will exist for several hundred billion more years before they eventually collapse into a white dwarf.
On the other hand, supergiant stars (up to 100 Solar Masses or more) have so much mass in their cores that they will likely experience helium ignition as soon as they exhaust their supplies of hydrogen. As such, they will likely not survive to become Red Supergiants, and will instead end their lives in a massive supernova.
To break it all down, stars vary in color depending on their chemical compositions, their respective sizes and their temperatures. Over time, as these characteristics change (as a result of them spending their fuel) many will darken and become redder, while others will explode magnificently. The more stars observe, the more we come to know about our Universe and its long, long history!
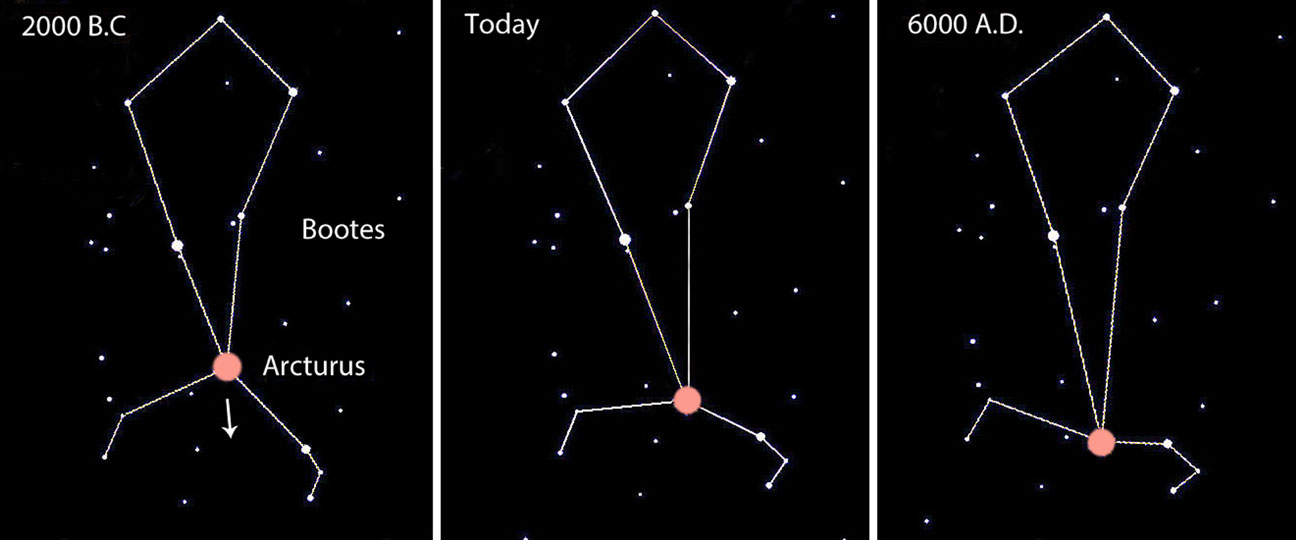
Stellar motions distort the future sky. Map: Bob King, Source: Stellarium
If we could transport Ptolemy, a famous astronomer who lived circa 90 – 168 A.D. in Alexandria, Egypt, he would have noticed the shift in position of Arcturus, Sirius and Aldebaran since his time. Everything else would appear virtually unchanged.
You go out and look at the stars year after year and never see any of them get up and walk away from their constellations. Take a time machine back to the days of Plato and Socrates and only careful viewing would reveal that just three of the sky’s naked eye stars had budged: Arcturus, Sirius and Aldebaran. And then only a little. Their motion was discovered by Edmund Halley in 1718 when he compared the stars’ positions then to their positions noted by the ancient Greek astronomers. In all three cases, the stars had moved “above a half a degree more Southerly at this time than the Antients reckoned them.”
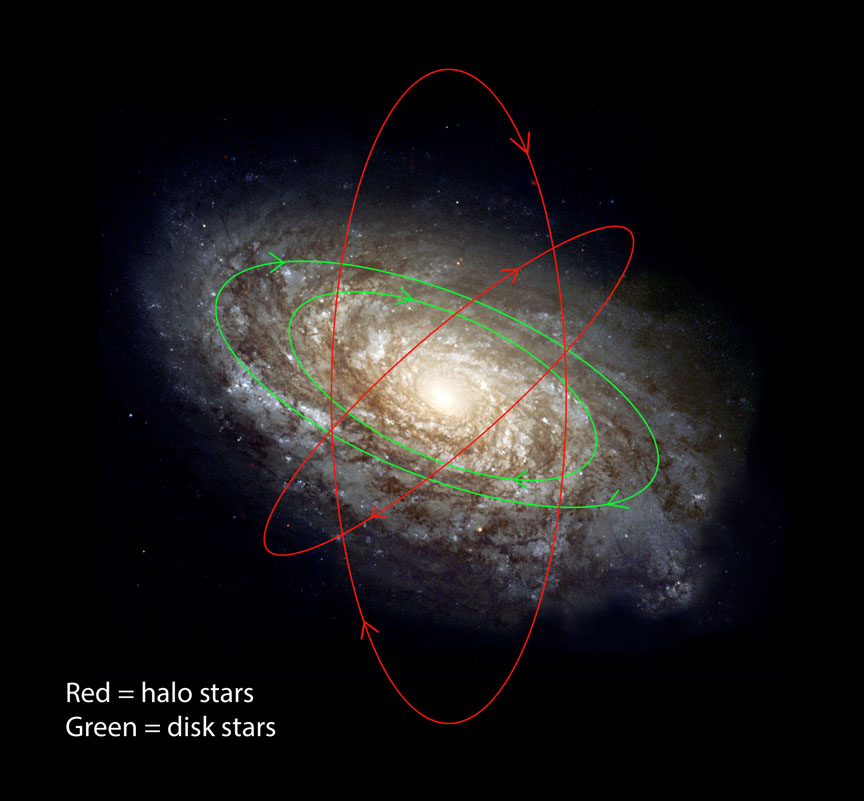
NGC 4414 is a spiral galaxy that resembles our own Milky Way. I’ve drawn in the orbits of several stars. Both disk and halo stars orbit about the center, but halo stars describe long elliptical orbits that take them well beyond the disk. When a star plunges through the disk, if it happens to be relatively nearby as in the case of Arcturus, the star will appear to move relatively quickly across the sky. Both distance and the type of orbit a star has can affect how fast it moves from our perspective. Credit: NASA/ESA with orbits by the author
Stars are incredibly far away. I could throw light years around like I often do here, but the fact is, you can get a real feel for their distance by noting that during your lifetime, none will appear to move individually. The gems of the night and our sun alike revolve around the center of the galaxy. At our solar system’s distance from the center — 26,000 light years or about halfway from center to edge — it takes the sun about 225 million years to make one revolution around the Milky Way.
That’s a LONG time. The other stars we see on a September night take a similar length of time to orbit. Now divide the average lifetime of some 85 years into that number, and you’ll discover that an average star moves something like .00000038% of its orbit around the galactic center every generation. Phew, that ain’t much! No wonder most stars don’t budge in our lifetime.
This graphic, made using SkyMap software created by Chris Marriott, shows the motion of Arcturus over a span of 8,000 years.
Sirius, Aldebaran and Arcturus and several other telescopic stars are close enough that their motion across the sky becomes apparent within the span of recorded history. More powerful telescopes, which expand the scale of the sky, can see a great many stars amble within a human lifetime. Sadly, our eyes alone only work at low power!
Precession of Earth’s axis maintains its usual 23.5 degree tilt, but this causes the axis to describe a circle in the sky like a wobbling top. The photo is an animation that repeats 10 seconds, so hang in there. Credit: Wikimedia Commons
But we needn’t invest billions in building a time machine to zing to the future or past to see how the constellation outlines become distorted by the individual motions of the stars that compose them. We already have one! Just fire up a free sky charting software program like Stellarium and advance the clock. Like most such programs, it defaults to the present, but let’s look ahead. Far ahead.
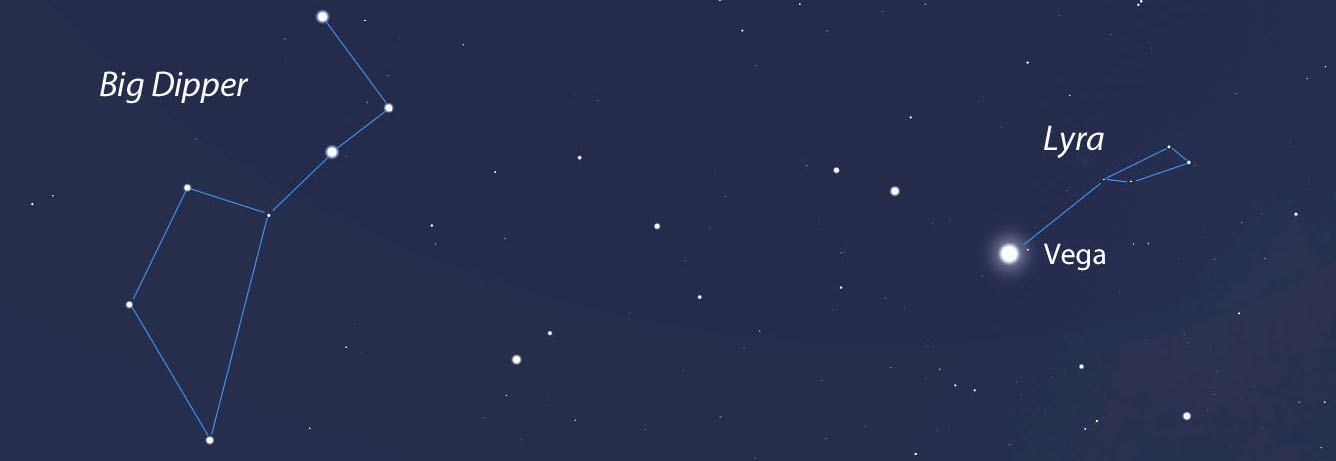
If we advance 90,000 years into the future, many of the constellations would be unrecognizable. Not only that, but more locally, the precession of Earth’s axis causes the polestar to shift. In 2016, Polaris in the Little Dipper stands at the northernmost point in the sky, but in 90,000 years the brilliant star Vega will occupy the spot. Tugs from the sun and moon on Earth’s equatorial bulge cause its axis to gyrate in a circle over a period of about 26,000 years. Wherever the axis points defines the polestar.
I advanced Stellarium far enough into the future to see how radically the Big Dipper changes shape over time. Notice too that Vega will be the polestar in that distant era. Map: Bob King, Source: Stellarium
Take a look at the Big Dipper. Wow! It’s totally bent out of shape yet still recognizable. The Pointer Stars no longer quite point to Polaris, but with some fudging we might make it work. Vega stands near the pole, and being much closer to us than the rest of Lyra’s stars, has moved considerably farther north, stretching the outline of the constellation as if taffy.
Now let’s head backwards in time 92,000 years to 90,000 B.C. The Dipper then was fairly unrecognizable, with both Vega and Arcturus near the pole. Map: Bob King , Source: Stellarium
Time goes on. We look up at the night sky in the present moment, but so much came before us and much will come after. Constellations were unrecognizable in the past and will be again in the future. In a fascinating discussion with Michael Kauper of the Minnesota Astronomical Society at a recent star party, he described the amount of space in and between galaxies as so enormous that “we’re almost not here” in comparison. I would add that time is so vast we’re likewise almost not present. Make the most of the moment.
Welcome, come in to the 468th and 469th Carnival of Space – we combined these two since it’s summer break for a lot of folks! The Carnival is a community of space science and astronomy writers and bloggers, who submit their best work each week for your benefit. I’m Susie Murph, part of the team at Universe Today and CosmoQuest. So now, on to this week’s stories! Continue reading “Carnival of Space #468-469”