[/caption]
Stars can be big or small, hot or cool, young or old. In order to properly organize all of the stars out there, astronomers have developed an organizational system called the Hertzsprung-Russell Diagram. This diagram is a scatter chart of stars that shows their absolute magnitude (or luminosity) versus their various spectral types and temperatures. The Hertzsprung-Russell diagram was developed by astronomers Ejnar Hertzsprung and Henry Norris Russell back in 1910.
The first Hertzsprung-Russell diagram showed the spectral type of stars on the horizontal axis and then the absolute magnitude on the vertical axis. Another version of the diagram plots the effective surface temperature of the star on one axis and the luminosity of the star on the other.
By using this diagram, astronomers are able to trace out the life cycle of stars, from young hot protostars, through the main sequence phase and into the dying red giant phases. It also shows how temperature and color relate to the stars at various stages in their lives.
If you look at an image of a Hertzsprung-Russell diagram, you can see there’s a diagonal line from the upper left to the lower right. Almost all stars fall along this line, and it’s known as the main sequence. In general, as luminosity goes down, temperature goes down as well. But there’s a branch that goes off horizontally at the 100 solar luminosity mark. These are the red giant stars nearing the end of their lives. They can be bright and cool, because they’re so large. But this stage usually only lasts a few million years.
Astronomers can also use the Hertzsprung-Russell diagram to estimate how far away stellar clusters are from Earth. By mapping out all the stars in the cluster and grouping them together and comparing them to groups of stars with known distances.
We have written many articles for Universe Today about the star life cycle. Here’s an article about the cluster M13, and how astronomers use the Hertzsprung-Russell diagram to study it.
Here are some good resources on the Internet for Hertzsprung-Russell diagram. Here’s a very simple version of the diagram from the University of Oregon, and here’s more information.
Artist concept of Chandrayaan-1 orbiting the moon. Credit: ISRO
[/caption]
After giving up on re-establishing contact with the Chandrayaan-1 lunar orbiter, Indian Space Research Organization (ISRO) Chairman G. Madhavan Nair announced the space agency hopes to launch its first mission to Mars sometime between 2013 and 2015. Nair said the termination of Chandrayaan-1, although sad, is not a setback and India will move ahead with its plans for the Chandrayaan-2 mission to land an unmanned rover on the moon’s surface to prospect for chemicals, and in four to six years launch a robotic mission to Mars.
“We have given a call for proposal to different scientific communities,” Nair told reporters. “Depending on the type of experiments they propose, we will be able to plan the mission. The mission is at conceptual stage and will be taken up after Chandrayaan-2.”
On the decision to quickly pull the plug on Chandrayaan-1, Nair said, “There was no possibility of retrieving it. (But) it was a great success. We could collect a large volume of data, including more than 70,000 images of the moon. In that sense, 95 percent of the objective was completed.”
Contact with Chandrayaan-1 may have been lost because its antenna rotated out of direct contact with Earth, ISRO officials said. Earlier this year, the spacecraft lost both its primary and back-up star sensors, which use the positions of stars to orient the spacecraft.
The loss of Chandrayaan-1 comes less than a week after the spacecraft’s orbit was adjusted to team up with NASA’s Lunar Reconnaissance Orbiter for a Bi-static radar experiment. During the maneuver, Chandrayaan-1 fired its radar beam into Erlanger Crater on the moon’s north pole. Both spacecraft listened for echoes that might indicate the presence of water ice – a precious resource for future lunar explorers. The results of that experiment have not yet been released.
Chandrayaan-1 craft was designed to orbit the moon for two years, but lasted 315 days. It will take about 1,000 days until it crashes to the lunar surface and is being tracked by the U.S. and Russia, ISRO said.
The Chandrayaan I had 11 payloads, including a terrain-mapping camera designed to create a three-dimensional atlas of the moon. It is also carrying mapping instruments for the European Space Agency, radiation-measuring equipment for the Bulgarian Academy of Sciences and two devices for NASA, including the radar instrument to assess mineral composition and look for ice deposits. India launched its first rocket in 1963 and first satellite in 1975. The country’s satellite program is one of the largest communication systems in the world.
An international team of astronomers has debunked a long-held belief about how stars are formed.
Since the 1950’s, astronomers believed groups of new-born stars obeyed the same rules of star formation, which meant the ratio of massive stars to lighter stars was pretty much the same from galaxy to galaxy. For every star 20 times more massive than the Sun or larger, for example, there’d be 500 stars equal to or less than the mass of the Sun.
“This was a really useful idea. Unfortunately it seems not to be true,” said team research leader Dr. Gerhardt Meurer of Johns Hopkins University in Baltimore.
This mass distribution of newly-born stars is called the ‘initial mass function’, or IMF. Most of the light we see from galaxies comes from the highest mass stars, while the total mass in stars is dominated by the lower mass stars which can’t be seen, so the IMF has implications in accurately determining the mass of galaxies. By measuring the amount of light from a population of stars, and making some corrections for the stars’ ages, astronomers can use the IMF to estimate the total mass of that population of stars.
Results for different galaxies can be compared only if the IMF is the same everywhere, but Dr. Meurer’s team has shown this ratio of high-mass to low-mass newborn stars differs between galaxies. Small ‘dwarf’ galaxies, for instance, form many more low-mass stars than expected.
To arrive at this finding, Dr. Meurer’s team used galaxies in the HIPASS Survey (HI Parkes All Sky Survey) done with the Parkes radio telescope near Sydney, Australia. A radio survey was used because galaxies contain substantial amounts of neutral hydrogen gas, the raw material for forming stars, and the neutral hydrogen emits radio waves.
The team measured two tracers of star formation, ultraviolet and H-alpha emissions, in 103 of the survey galaxies using NASA’s GALEX satellite and the 1.5-m CTIO optical telescope in Chile.
Selecting galaxies on the basis of their neutral hydrogen gave a sample of galaxies of many different shapes and sizes, unbiased by their star formation history.
H-alpha emission traces the presence of very massive stars called O stars, the birth of a star with a mass more than 20 times that of the Sun.
The UV emission, traces both O stars and the less massive B stars — overall, stars more than three times the mass of the Sun.
Meurer’s team found the ratio of H-alpha to UV emission varied from galaxy to galaxy, implying the IMF also did, at least at its upper end.
“This is complicated work, and we’ve necessarily had to take into account many factors that affect the ratio of H-alpha to UV emission, such as the fact that B stars live much longer than O stars,” Dr. Meurer said.
Dr. Meurer’s team suggests the IMF seems to be sensitive to the physical conditions of the star-forming region, particularly gas pressure. For instance, massive stars are most likely to form in high-pressure environments such as tightly bound star clusters.
The team’s results allow a better understanding of other recently observed phenomena that have been puzzling astronomers, such as variation of the ratio of H-alpha to ultraviolet light as a function of radius within some galaxies. This now makes sense as the stellar mix varies as the pressure drops with radius, just like the pressure varies with altitude on the Earth.
The work confirms tentative suggestions made first by Veronique Buat and collaborators in France in 1987, and then a more substantial study last year by Eric Hoversteen and Karl Glazebrook working out of Johns Hopkins and Swinburne Universities that suggested the same result.
A billion years after the big bang, hydrogen atoms were mysteriously torn apart into a soup of ions. Credit: NASA/ESA/A. Felid (STScI)).
It’s no secret that the universe is an extremely vast place. That which we can observe (aka. “the known Universe”) is estimated to span roughly 93 billion light years. That’s a pretty impressive number, especially when you consider its only what we’ve observed so far. And given the sheer volume of that space, one would expect that the amount of matter contained within would be similarly impressive.
But interestingly enough, it is when you look at that matter on the smallest of scales that the numbers become the most mind-boggling. For example, it is believed that between 120 to 300 sextillion (that’s 1.2 x 10²³ to 3.0 x 10²³) stars exist within our observable universe. But looking closer, at the atomic scale, the numbers get even more inconceivable.
At this level, it is estimated that the there are between 1078 to 1082 atoms in the known, observable universe. In layman’s terms, that works out to between ten quadrillion vigintillion and one-hundred thousand quadrillion vigintillion atoms.
And yet, those numbers don’t accurately reflect how much matter the universe may truly house. As stated already, this estimate accounts only for the observable universe which reaches 46 billion light years in any direction, and is based on where the expansion of space has taken the most distant objects observed.
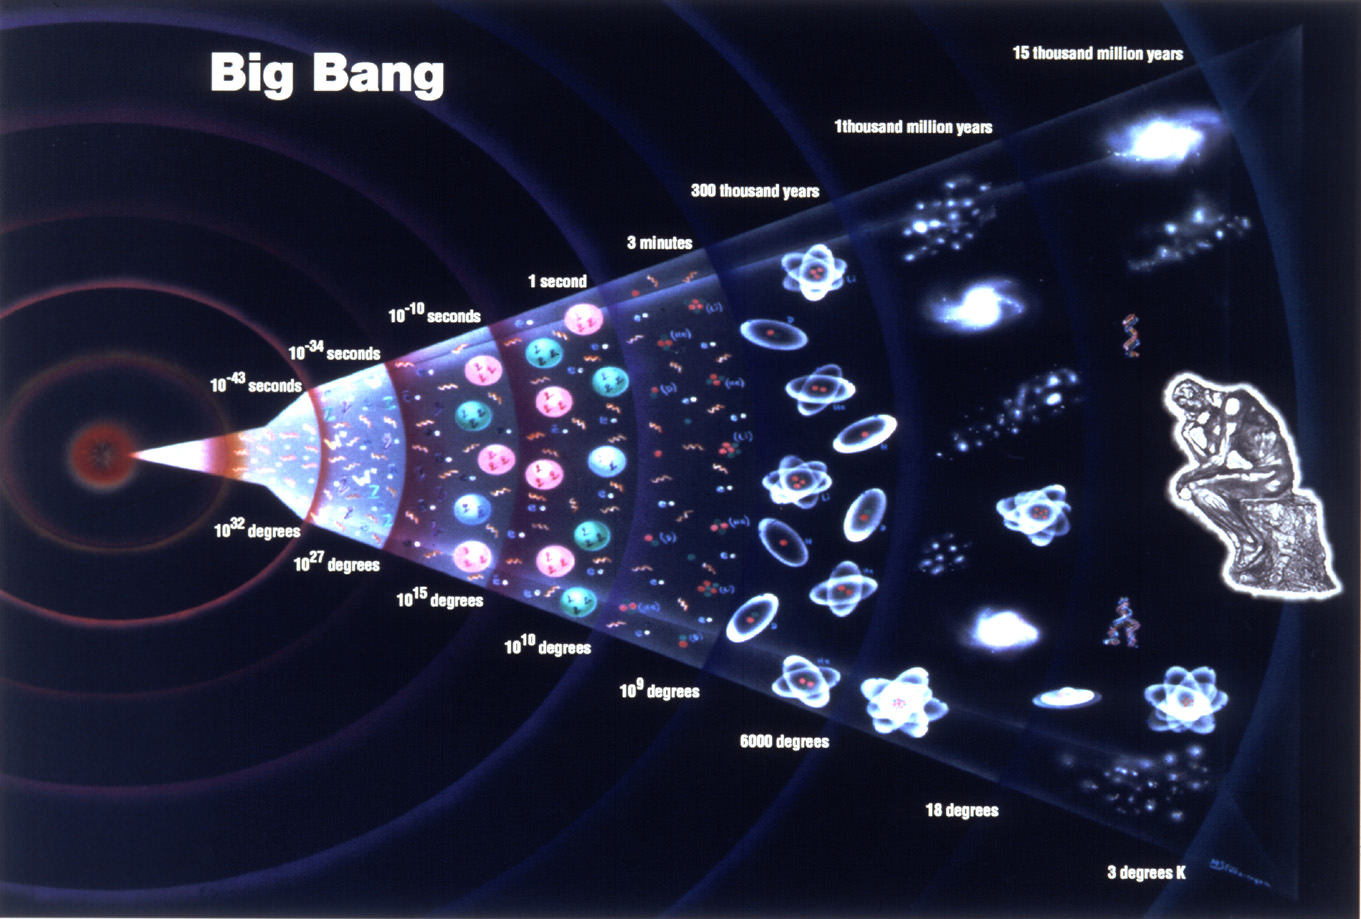
The history of the universe starting the with the Big Bang. Image credit: grandunificationtheory.com
While a German supercomputer recently ran a simulation and estimated that around 500 billion galaxies exist within range of observation, a more conservative estimate places the number at around 300 billion. Since the number of stars in a galaxy can run up to 400 billion, then the total number of stars may very well be around 1.2×10²³ – or just over 100 sextillion.
On average, each star can weigh about 1035 grams. Thus, the total mass would be about 1058 grams (that’s 1.0 x 1052 metric tons). Since each gram of matter is known to have about 1024 protons, or about the same number of hydrogen atoms (since one hydrogen atom has only one proton), then the total number of hydrogen atoms would be roughly 1086 – aka. one-hundred thousand quadrillion vigintillion.
Within this observable universe, this matter is spread homogeneously throughout space, at least when averaged over distances longer than 300 million light-years. On smaller scales, however, matter is observed to form into the clumps of hierarchically-organized luminous matter that we are all familiar with.
In short, most atoms are condensed into stars, most stars are condensed into galaxies, most galaxies into clusters, most clusters into superclusters and, finally, into the largest-scale structures like the Great Wall of galaxies (aka. the Sloan Great Wall). On a smaller scale, these clumps are permeated by clouds of dust particles, gas clouds, asteroids, and other small clumps of stellar matter.
Representation of the timeline of the universe over 13.7 billion years, and the expansion in the universe that followed. Credit: NASA/WMAP Science Team.
The observable matter of the Universe is also spread isotropically; meaning that no direction of observation seems different from any other and each region of the sky has roughly the same content. The Universe is also bathed in a wave of highly isotropic microwave radiation that corresponds to a thermal equilibrium of roughly 2.725 kelvin (just above Absolute Zero).
The hypothesis that the large-scale universe is homogeneous and isotropic is known as the cosmological principle. This states that physical laws act uniformly throughout the universe and should, therefore, produce no observable irregularities in the large scale structure. This theory has been backed up by astronomical observations which have helped to chart the evolution of the structure of the universe since it was initially laid down by the Big Bang.
The current consensus amongst scientists is that the vast majority of matter was created in this event, and that the expansion of the Universe since has not added new matter to the equation. Rather, it is believed that what has been taking place for the past 13.7 billion years has simply been an expansion or dispersion of the masses that were initially created. That is, no amount of matter that wasn’t there in the beginning has been added during this expansion.
However, Einstein’s equivalence of mass and energy presents a slight complication to this theory. This is a consequence arising out of Special Relativity, in which the addition of energy to an object increases its mass incrementally. Between all the fusions and fissions, atoms are regularly converted from particles to energies and back again.
Atom density is greater at left (the beginning of the experiment) than 80 milliseconds after the simulated Big Bang. Credit: Chen-Lung Hung
Nevertheless, observed on a large-scale, the overall matter density of the universe remains the same over time. The present density of the observable universe is estimated to be very low – roughly 9.9 × 10⁻³⁰ grams per cubic centimeter. This mass-energy appears to consist of 68.3% dark energy, 26.8% dark matter and just 4.9% ordinary (luminous) matter. Thus the density of atoms is on the order of a single hydrogen atom for every four cubic meters of volume.
The properties of dark energy and dark matter are largely unknown, and could be uniformly distributed or organized in clumps like normal matter. However, it is believed that dark matter gravitates as ordinary matter does, and thus works to slow the expansion of the Universe. By contrast, dark energy accelerates its expansion.
Once again, this number is just a rough estimate. When used to estimate the total mass of the Universe, it often falls short of what other estimates predict. And in the end, what we see is just a smaller fraction of the whole.
Artist's depiction of the Morgan-Keenan spectral diagram, showing how stars differ in colors as well as size. Credit: Wikipedia Commons
A star is a star, right? Sure there are some difference in terms of color when you look up at the night sky. But they are all basically the same, big balls of gas burning up to billions of light years away, right? Well, not exactly. In truth, stars are about as diverse as anything else in our Universe, falling into one of many different classifications based on its defining characteristics.
All in all, there are many different types of stars, ranging from tiny brown dwarfs to red and blue supergiants. There are even more bizarre kinds of stars, like neutron stars and Wolf-Rayet stars. And as our exploration of the Universe continues, we continue to learn things about stars that force us to expand on the way we think of them. Let’s take a look at all the different types of stars there are.
Protostar:
A protostar is what you have before a star forms. A protostar is a collection of gas that has collapsed down from a giant molecular cloud. The protostar phase of stellar evolution lasts about 100,000 years. Over time, gravity and pressure increase, forcing the protostar to collapse down. All of the energy release by the protostar comes only from the heating caused by the gravitational energy – nuclear fusion reactions haven’t started yet.
Size chart showing our Sun (far left) compared to larger stars. Credit: earthspacecircle.blogspot.ca
T Tauri Star:
A T Tauri star is stage in a star’s formation and evolution right before it becomes a main sequence star. This phase occurs at the end of the protostar phase, when the gravitational pressure holding the star together is the source of all its energy. T Tauri stars don’t have enough pressure and temperature at their cores to generate nuclear fusion, but they do resemble main sequence stars; they’re about the same temperature but brighter because they’re a larger. T Tauri stars can have large areas of sunspot coverage, and have intense X-ray flares and extremely powerful stellar winds. Stars will remain in the T Tauri stage for about 100 million years.
Main Sequence Star:
The majority of all stars in our galaxy, and even the Universe, are main sequence stars. Our Sun is a main sequence star, and so are our nearest neighbors, Sirius and Alpha Centauri A. Main sequence stars can vary in size, mass and brightness, but they’re all doing the same thing: converting hydrogen into helium in their cores, releasing a tremendous amount of energy.
A star in the main sequence is in a state of hydrostatic equilibrium. Gravity is pulling the star inward, and the light pressure from all the fusion reactions in the star are pushing outward. The inward and outward forces balance one another out, and the star maintains a spherical shape. Stars in the main sequence will have a size that depends on their mass, which defines the amount of gravity pulling them inward.
The lower mass limit for a main sequence star is about 0.08 times the mass of the Sun, or 80 times the mass of Jupiter. This is the minimum amount of gravitational pressure you need to ignite fusion in the core. Stars can theoretically grow to more than 100 times the mass of the Sun.
Red Giant Star:
When a star has consumed its stock of hydrogen in its core, fusion stops and the star no longer generates an outward pressure to counteract the inward pressure pulling it together. A shell of hydrogen around the core ignites continuing the life of the star, but causes it to increase in size dramatically. The aging star has become a red giant star, and can be 100 times larger than it was in its main sequence phase. When this hydrogen fuel is used up, further shells of helium and even heavier elements can be consumed in fusion reactions. The red giant phase of a star’s life will only last a few hundred million years before it runs out of fuel completely and becomes a white dwarf.
White Dwarf Star:
When a star has completely run out of hydrogen fuel in its core and it lacks the mass to force higher elements into fusion reaction, it becomes a white dwarf star. The outward light pressure from the fusion reaction stops and the star collapses inward under its own gravity. A white dwarf shines because it was a hot star once, but there’s no fusion reactions happening any more. A white dwarf will just cool down until it becomes the background temperature of the Universe. This process will take hundreds of billions of years, so no white dwarfs have actually cooled down that far yet.
Red Dwarf Star:
Red dwarf stars are the most common kind of stars in the Universe. These are main sequence stars but they have such low mass that they’re much cooler than stars like our Sun. They have another advantage. Red dwarf stars are able to keep the hydrogen fuel mixing into their core, and so they can conserve their fuel for much longer than other stars. Astronomers estimate that some red dwarf stars will burn for up to 10 trillion years. The smallest red dwarfs are 0.075 times the mass of the Sun, and they can have a mass of up to half of the Sun.
Neutron Stars:
If a star has between 1.35 and 2.1 times the mass of the Sun, it doesn’t form a white dwarf when it dies. Instead, the star dies in a catastrophic supernova explosion, and the remaining core becomes a neutron star. As its name implies, a neutron star is an exotic type of star that is composed entirely of neutrons. This is because the intense gravity of the neutron star crushes protons and electrons together to form neutrons. If stars are even more massive, they will become black holes instead of neutron stars after the supernova goes off.
Supergiant Stars:
The largest stars in the Universe are supergiant stars. These are monsters with dozens of times the mass of the Sun. Unlike a relatively stable star like the Sun, supergiants are consuming hydrogen fuel at an enormous rate and will consume all the fuel in their cores within just a few million years. Supergiant stars live fast and die young, detonating as supernovae; completely disintegrating themselves in the process.
As you can see, stars come in many sizes, colors and varieties. Knowing what accounts for this, and what their various life stages look like, are all important when it comes to understanding our Universe. It also helps when it comes to our ongoing efforts to explore our local stellar neighborhood, not to mention in the hunt for extra-terrestrial life!
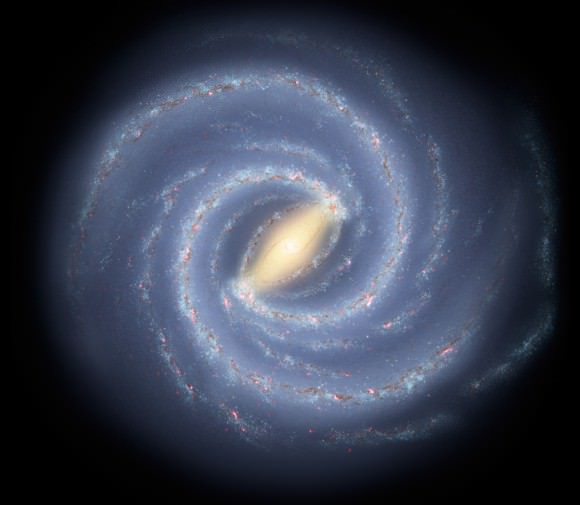
Artist's impression of The Milky Way Galaxy. Based on current estimates and exoplanet data, it is believed that there could be tens of billions of habitable planets out there. Credit: NASA
When you look up into the night sky, it seems like you can see a lot of stars. There are about 2,500 stars visible to the naked eye at any one point in time on the Earth, and 5,800-8,000 total visible stars (i.e. that can be spotted with the aid of binoculars or a telescope). But this is a very tiny fraction of the stars the Milky Way is thought to have!
So the question is, then, exactly how many stars are in the Milky Way Galaxy? Astronomers estimate that there are 100 billion to 400 billion stars contained within our galaxy, though some estimate claim there may be as many as a trillion. The reason for the disparity is because we have a hard time viewing the galaxy, and there’s only so many stars we can be sure are there.
Structure of the Milky Way:
Why can we only see so few of these stars? Well, for starters, our Solar System is located within the disk of the Milky Way, which is a barred spiral galaxy approximately 100,000 light years across. In addition, we are about 30,000 light years from the galactic center, which means there is a lot of distance – and a LOT of stars – between us and the other side of the galaxy.
Artist’s impression of the Milky Way Galaxy. Credit: NASA
To complicate matter further, when astronomers look out at all of these stars, even closer ones that are relatively bright can be washed out by the light of brighter stars behind them. And then there are the faint stars that are at a significant distance from us, but which elude conventional detection because their light source is drowned out by brighter stars or star clusters in their vicinity.
The furthest stars that you can see with your naked eye (with a couple of exceptions) are about 1000 light years away. There are quite a few bright stars in the Milky Way, but clouds of dust and gas – especially those that lie at the galactic center – block visible light. This cloud, which appears as a dim glowing band arching across the night sky – is where our galaxy gets the “milky” in its name from.
It is also the reason why we can only really see the stars in our vicinity, and why those on the other side of the galaxy are hidden from us. To put it all in perspective, imagine you are standing in a very large, very crowded room, and are stuck in the far corner. If someone were to ask you, “how many people are there in here?”, you would have a hard time giving them an accurate figure.
Now imagine that someone brings in a smoke machine and begins filling the center of the room with a thick haze. Not only does it become difficult to see clearly more than a few meters in front of you, but objects on the other side of the room are entirely obscured. Basically, your inability to rise above the crowd and count heads means that you are stuck either making guesses, or estimating based on those that you can see.
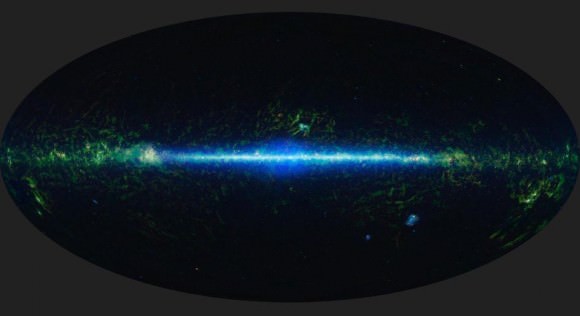
A mosaic of the images covering the entire sky as observed by the Wide-field Infrared Survey Explorer (WISE), part of its All-Sky Data Release. Credit: NASA/JPL
Imaging Methods:
Infrared (heat-sensitive) cameras like the Cosmic Background Explorer (aka. COBE) can see through the gas and dust because infrared light travels through it. And there’s also the Spitzer Space Telescope, an infrared space observatory launched by NASA in 2003; the Wide-field Infrared Survey Explorer (WISE), deployed in 2009; and the Herschel Space Observatory, a European Space Agency mission with important NASA participation.
All of these telescopes have been deployed over the past few years for the purpose of examining the universe in the infrared wavelength, so that astronomers will be able to detect stars that might have otherwise gone unnoticed. To give you a sense of what this might look like, check out the infrared image below, which was taken by COBE on Jan. 30th, 2000.
However, given that we still can’t seem them all, astronomers are forced to calculate the likely number of stars in the Milky Way based on a number of observable phenomena. They begin by observing the orbit of stars in the Milky Way’s disk to obtain the orbital velocity and rotational period of the Milky Way itself.
Estimates:
From what they have observed, astronomers have estimated that the galaxy’s rotational period (i.e. how long it takes to complete a single rotation) is apparently 225-250 million years at the position of the Sun. This means that the Milky Way as a whole is moving at a velocity of approximately 600 km per second, with respect to extragalactic frames of reference.
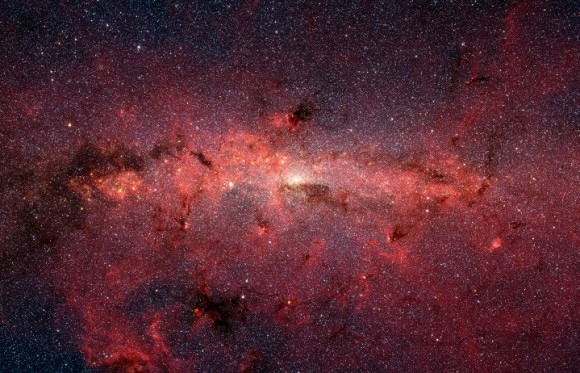
Infrared image of the Milky Way taken by NASA’s Spitzer Space Telescope. Credit: NASA/JPL-Caltech
Then, after determining the mass (and subtracting out the halo of dark matter that makes up over 90% of the mass of the Milky Way), astronomers use surveys of the masses and types of stars in the galaxy to come up with an average mass. From all of this, they have obtained the estimate of 200-400 billion stars, though (as stated already) some believe there’s more.
Someday, our imaging techniques may become sophisticated enough that are able to spot every single star through the dust and particles that permeate our galaxy. Or perhaps will be able to send out space probes that will be able to take pictures of the Milky Way from Galactic north – i.e. the spot directly above the center of the Milky Way.
Until that time, estimates and a great deal of math are our only recourse for knowing exactly how crowded our local neighborhood is!
We have written many great articles on the Milky Way here at Universe Today. For example, here are 10 Facts About the Milky Way, as well as articles that answer other important questions.
Astronomy Cast did a podcast all about the Milky Way, and the Students for the Exploration and Development of Space (SEDS) have plenty of information about the Milky Way here.
And if you’re up for counting a few of the stars, check out this mosaic from NASA’s Astronomy Picture of the Day. For a more in-depth explanation on the subject, go to How the Milky Way Galaxy Works.