Ancient Impacts Stained Vesta with Carbon-Rich Material

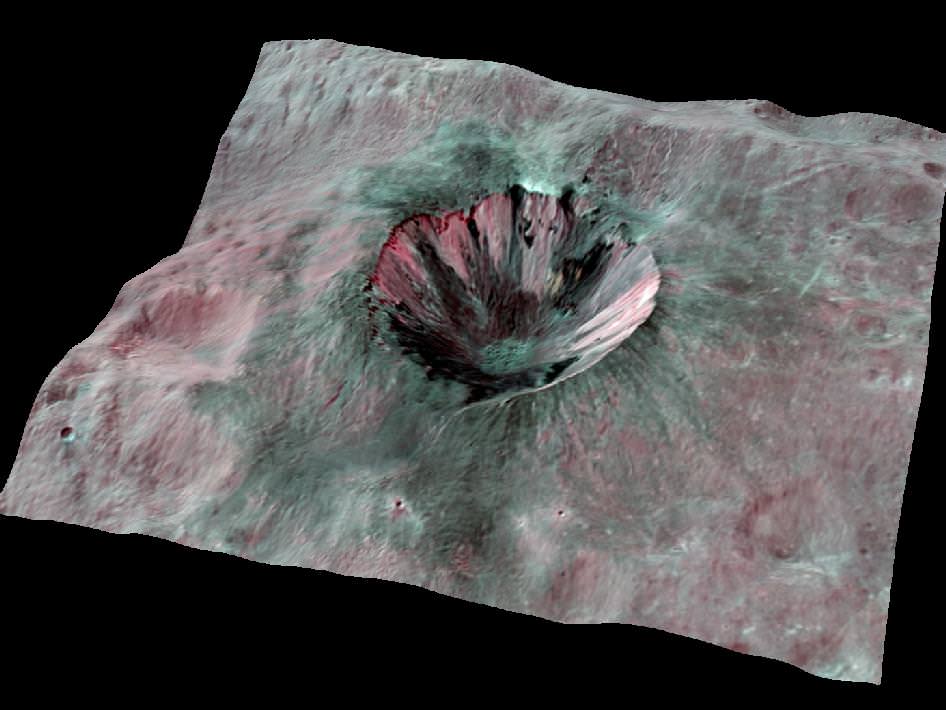
Composite-color 3D image of Cornelia crater on Vesta (NASA/JPL-Caltech/UCLA/MPS/DLR/IDA)

Ever since arriving at Vesta in July 2011, NASA’s Dawn spacecraft has been capturing high-resolution images of the protoplanet’s surface, revealing a surprisingly varied and complex terrain covered in ridges, hills, grooves and, of course, craters of many different sizes and ages. Many of Vesta’s largest craters exhibit strange dark stains and splotches within and around them, some literally darker than coal. These stains were a puzzle to scientists when they were first seen, but the latest research now confirms that they may actually be the remains of the ancient impacts that caused them: dark deposits left by the myriad of carbon-rich objects that struck Vesta over the past four-and-a-half billion years.

Even though Vesta had a completely molten surface 4.5 billion years ago it’s believed that its crust likely solidified within a few million years, making the 530-km (329-mile) -wide world a literal time capsule for events taking place in the inner Solar System since then… one reason why Vesta was chosen as a target for the Dawn mission.

714973main_pia16632-43_946-710
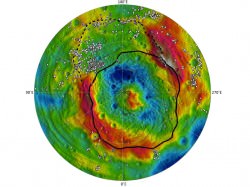
Using data acquired by Dawn during its year in orbit around Vesta, a team led by researchers from Germany’s Max Planck Institute for Solar System Research and the University of North Dakota investigated the dark material seen lining the edges of large impact basins located on the protoplanet’s southern hemisphere. What they determined was that much of the material was delivered during an initial large, low-velocity impact event 2–3 billion years ago that created the largest basin — Veneneia — and was then partially covered by a later impact that created the smaller basin that’s nearly centered on Vesta’s southern pole — Rheasilva.

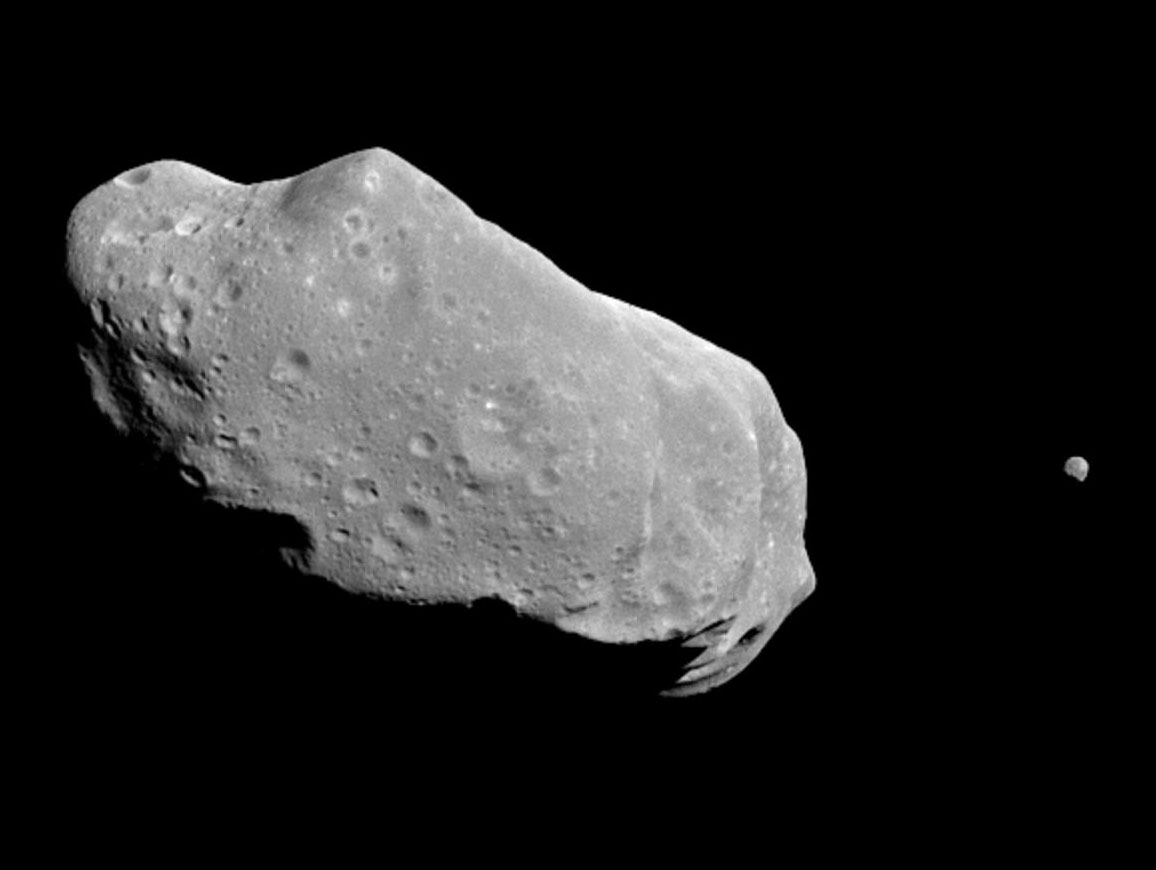
“The evidence suggests that the dark material on Vesta is rich in carbonaceous material and was brought there by collisions with smaller asteroids.”

– Vishnu Reddy, lead author, Max Planck Institute for Solar System Research and the University of North Dakota

714963main_pia16630-43_946-710

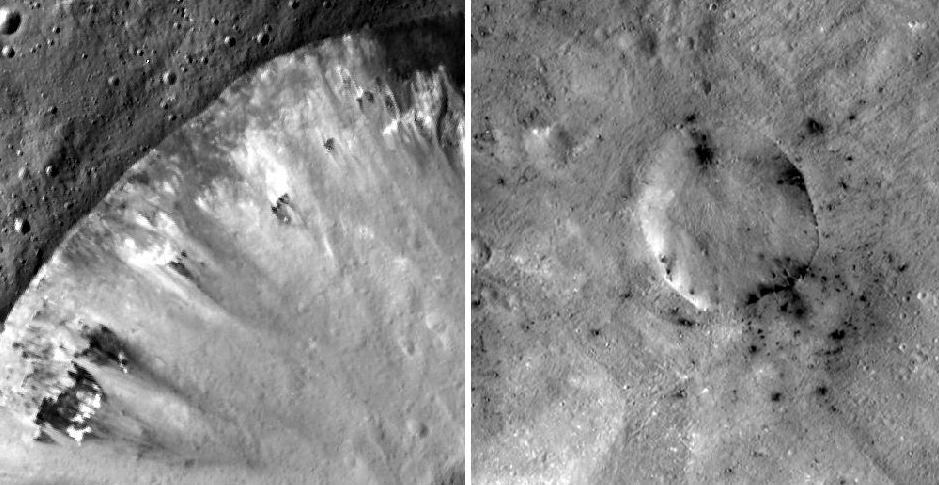
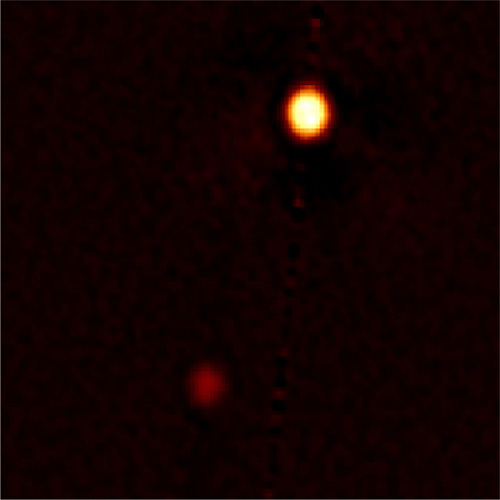
Dawn framing camera images of dark material on Vesta. (NASA/JPL-Caltech/UCLA/MPS/DLR/IDA)

Subsequent smaller asteroid impacts over the millennia likely brought more carbonaceous material to Vesta’s surface, both delivering it as well as revealing any that may have existed beneath brighter surfaces.

Read more: Asteroid’s Unusual Light and Dark Crater


The dark, carbon-rich material observed on Vesta by Dawn also seems to match up with similarly dark clasts found in meteorites that have landed on Earth which are thought to have originated from Vesta.

“Our analysis of the dark material on Vesta and comparisons with laboratory studies of HED meteorites for the first time proves directly that these meteorites are fragments from Vesta,” said Lucille Le Corre from the Max Planck Institute for Solar System Research, another lead author of the study.

If evidence of such collisions between worlds can be found on Vesta, it’s likely that similar events were occurring all across the inner solar system during its early days, providing a clue as to how carbon-rich organic material was delivered to Earth — and possibly Mars as well. Such material — the dark stains we see today lining Vesta’s craters — would have helped form the very building blocks of life on our planet.

The team’s findings were published in the November/December issue of the journal Icarus.

Read more on the Max Planck Institute’s news page here, and on the NASA release here. Learn more about the Dawn mission in the video below, narrated by Leonard Nimoy.

How Long is a Day on Mercury?

1/3 the distance from the Sun than Earth, it should be no surprise that a day on Mercury is a real scorcher with temperatures soaring over 400 ºC. But in addition to its solar proximity it also has an extremely slow rotation: a single day on Mercury is 58.6 Earth days long… and you thought your Mondays lasted forever!

To be even more precise, for every 2 Mercury years, 3 Mercury days pass — a 3:2 spin-orbit resonance, caused by the planet’s varying elliptical orbit. (This also makes for some interesting motions of the Sun in Mercury’s sky.)

To illustrate this, UK’s The Open University has published a new video in their 60 Second Adventures in Astronomy series… check it out above (and see more of their excellent and amusing animations here.)

Video: The Open University. Narrated by David Mitchell.

A Color View of Darling Dione

Color-composite of Dione made from raw Cassini images acquired on Dec. 23, 2012. (NASA/JPL/SSI. Composite by J. Major.)

Although made mostly of ice and rock, Saturn’s moon Dione (pronounced dee-oh-nee) does have some color to it, as seen in this color-composite made from raw images acquired by Cassini on December 23.

700 miles (1120 km) wide, Dione is covered pole-to-pole in craters and crisscrossed by long, bright regions of “wispy line” terrain — the reflective faces of sheer ice cliffs and scarps that are too steep for darker material drifting in from Saturn’s E ring to remain upon.

The composite  was assembled from raw images captured in red, green and blue visible light wavelengths by Cassini from a distance of 154,869 miles (249,238 km).

The view above looks at a region on Dione’s mid-northern hemisphere. The bright-walled crater in the center surrounded by warmer-hued terrain is named Creusa, and the long rift system next to it is Tibur Chasmata, which runs north-to-south. Dione’s north pole is to the upper left.

Dione’s heavily cratered areas are most common on its trailing hemisphere. Logically, a moon’s leading hemisphere should be the more heavily cratered, so it has been hypothesized that a relatively recent impact spun Dione around 180 degrees. The moon’s small size mean that even a modest-scale impact could have done the job.

Relative sizes of Earth, Moon and Dione (J. Major)

Dione orbits Saturn at a distance of 209,651 miles (377,400 km), closer than our Moon is to us.

See more images and news from the Cassini mission here. And for more on Dione, see some of my previous posts on Lights in the Dark.

Valles Marineris: The Grandest Canyon of All

A digital terrain model of a portion of Mars’ Valles Marineris, the largest canyon in the Solar System. Credit: ESA/DLR/FU Berlin (G. Neukum)

Anyone who’s visited the Grand Canyon in Arizona can attest to its beauty, magnificence and sheer sense of awe that comes upon approaching its rim, whether for the first time or hundred-and-first. “Grand” almost seems too inferior a title for such an enormous geological feature — yet there’s a canyon much, much bigger stretching across the surface of Mars, one that could easily swallow all of our Grand Canyon within one of its side gullies.

The image above, released online for the first time today by ESA, is a digital terrain model of a portion of Mars’ Valles Marineris: our Solar System’s grandest canyon.
It’s easy to fall into hyperbole when describing Valles Marineris. Named for NASA’s Mariner 9 spacecraft, which became the first spacecraft to orbit Mars on November 14, 1971, the canyon is over 4000 km long, 200 km wide, and 10 km deep (2,480 x 125 x 6 miles) — that’s five times deeper than the Grand Canyon and long enough to stretch across the entire contiguous United States! It’s a rift unparalleled on any other world in the Solar System.

Valles Marineris is thought to be the result of the formation of the nearby Tharsis volcanic region, home to Olympus Mons, the Solar System’s largest volcano. As the region swelled with magma billions of years ago the planet’s crust stretched and split, collapsing into a vast, deep canyon.

Much later, landslides and flowing water would help erode the canyon’s steep walls and carve out meandering side channels.

The 45-degree view above was was made from data acquired during 20 individual orbits of ESA’s Mars Express. It is presented in near-true color with four times vertical exaggeration (to increase relief contrast.) Download a high-res JPEG version here.

The largest portion of the canyon seen crossing left to right is known as Melas Chasma. Candor Chasma is the connecting trough to the north, and Hebes Chasma is in the far top left.

Below is a video released by JPL in 2006 showing a virtual fly-through of Valles Marineris, shown as if you were on a Grand Canyon-style helicopter sightseeing tour (that is, if helicopters could even work in the thin Martian air!)

Hopefully someday we’ll be seeing actual videos taken above Valles Marineris and photos captured from its rim… perhaps even by human explorers! (Please exit through the gift shop.)

Image source: ESA. Video by Eric M. De Jong and Phil Christiansen et. al, Arizona State University.

Voyager 1 May Have Left the Solar System

Number of particles from the Sun hitting Voyager 1. Credit: NASA

While there’s no official word from NASA on this, the buzz around the blogosphere is that Voyager 1 has left the Solar System. The evidence comes from this graph, above, which shows the number of particles, mainly protons, from the Sun hitting Voyager 1 across time. A huge drop at the end of August hints that Voyager 1 may now be in interstellar space. The last we heard from the Voyager team was early August, and they indicated that on July 28, the level of lower-energy particles originating from inside our Solar System dropped by half. However, in three days, the levels had recovered to near their previous levels. But then the bottom dropped out at the end of August.

The Voyager team has said they have been seeing two of three key signs of changes expected to occur at the boundary of interstellar space. In addition to the drop in particles from the Sun, they’ve also seen a jump in the level of high-energy cosmic rays originating from outside our Solar System.

The third key sign would be the direction of the magnetic field. No word on that yet, but scientists are eagerly analyzing the data to see whether that has, indeed, changed direction. Scientists expect that all three of these signs will have changed when Voyager 1 has crossed into interstellar space.

“These are thrilling times for the Voyager team as we try to understand the quickening pace of changes as Voyager 1 approaches the edge of interstellar space,” said Edward Stone, the Voyager project scientist for the entire mission, who was quoted in early August. “We are certainly in a new region at the edge of the solar system where things are changing rapidly. But we are not yet able to say that Voyager 1 has entered interstellar space.”

Stone added that the data are changing in ways that the team didn’t expect, “but Voyager has always surprised us with new discoveries.”

Voyager 1 launched on Sept. 5, 1977, is approximately 18 billion kilometers (11 billion miles) from the Sun. Voyager 2, which launched on Aug. 20, 1977, is close behind, at 15 billion km (9.3 billion miles) from the Sun.

Sources: NASA, Eric Berger/ Houston Chronicle, Scientific American

Pictures From T-86: Cassini’s Latest Flyby of Titan

On September 26-27 Cassini executed its latest flyby of Titan, T-86, coming within 594 miles (956 km) of the cloud-covered moon in order to measure the effects of the Sun’s energy on its dense atmosphere and determine its variations at different altitudes.

The image above was captured as Cassini approached Titan from its night side, traveling about 13,000 mph (5.9 km/s). It’s a color-composite made from three separate raw images acquired in red, green and blue visible light filters.

Titan’s upper-level hydrocarbon haze is easily visible as a blue-green “shell” above its orange-colored clouds.

Cassini captured this image as it approached Titan’s sunlit limb, grabbing a better view of the upper haze. Some banding can be seen in its highest reaches.

The haze is the result of UV light from the Sun breaking down nitrogen and methane in Titan’s atmosphere, forming hydrocarbons that rise up and collect at altitudes of 300-400 kilometers. The sea-green coloration is a denser photochemical layer that extends upwards from about 200 km altitude.

In this image, made from data acquired on Sept. 27, Titan’s south polar vortex can be made out just within the southern terminator. The vortex is a relatively new feature in Titan’s atmosphere, first spotted earlier this year. It’s thought that it’s a region of open-cell convection forming above the moon’s pole, a result of the approach of winter to Titan’s southern half.

Read: Cassini Spots Surprising Swirls Above Titan’s South Pole

This T-86 flyby was was one of a handful of opportunities to profile Titan’s ionosphere from the outermost edge of Titan’s atmosphere. In addition Cassini was able to look for any changes to Ligeia Mare, a methane lake last observed in spring of 2007.

Now that Titan has been under scrutiny for a full year of Saturn’s seasons — which lasts 29.7 Earth-years — astronomers now know that varying amounts of solar radiation can drastically change situations both within Saturn’s atmosphere and on its surface.

“As with Earth, conditions on Titan change with its seasons. We can see differences in atmospheric temperatures, chemical composition and circulation patterns, especially at the poles,” said Dr. Athena Coustenis from the Paris-Meudon Observatory in France. “For example, hydrocarbon lakes form around the north polar region during winter due to colder temperatures and condensation. Also, a haze layer surrounding Titan at the northern pole is significantly reduced during the equinox because of the atmospheric circulation patterns. This is all very surprising because we didn’t expect to find any such rapid changes, especially in the deeper layers of the atmosphere.”

“It’s amazing to think that the Sun still dominates over other energy sources even as far out as Titan, over 1.5 billion kilometres from us.”
– Dr. Athena Coustenis, Paris-Meudon Observatory

The image above, acquired on Sept. 28, was added to this post on Oct. 1. It was taken from a distance of  649,825 miles (1,045,792 kilometers.)

Cassini’s next targeted approach to Titan — T-87 — will occur on November 13.

Get more news from the Cassini mission here.

Image credits: NASA/JPL/Space Science Institute. All color composites by Jason Major. Images have not been validated or calibrated by the SSI team.


(Do you love the Cassini mission as much as we do? Vote on your favorite Cassini “Shining Moment” here, in honor of the 15th anniversary of Cassini’s launch on October 15! Amazing to think it’s already been 15 years — 8 of those in orbit around Saturn!)

Vesta’s Deep Grooves Could Be “Stretch Marks” From Impact

Dawn image of Vesta showing its nearly circumferential equatorial grooves (NASA/JPL-Caltech/UCLA/MPS/DLR/IDA)

Even though NASA’s Dawn spacecraft has departed Vesta the trove of data it’s gathered about this fascinating little world continues to fuel new discoveries. Most recently, some researchers are suggesting that Vesta’s curious grooves — long, deep troughs that wrap around its equator, noticed immediately after Dawn came within close proximity — are actually features called graben, the results of surface expansion along fault lines.

In Vesta’s case, the faults likely may have come from whatever major collision created the enormous central peak that rises almost three times the height of Mt. Everest from its south pole… and the expansion could be the result of differentiation of its interior — a separation of core, mantle and crust that’s much more planet-like than anything asteroidish.


On smaller asteroids and moons, stress fractures tend to have a “V” shape, cutting inwards to a sharp point. But the troughs on Vesta are more rounded, with a “U” shape that results from surface material slumping downwards as the surface pulls apart. Found on larger worlds like Earth, the Moon, Mars, Mercury — and now possibly Vesta as well — graben are shaped by motions below the crust and not just the splitting of the surface.

The biggest of Vesta’s troughs, Divalia Fossa, is 465 kilometers (289 miles) long, 22 km (13.6 mi) wide and 5 km (3 mi) deep… longer and three times deeper than the Grand Canyon.

Animation of Vesta rotating made from Dawn images and assembled by The Planetary Society’s Emily Lakdawalla

If the researchers are correct and these are indeed graben, rather than just fractures or grooves carved into the surface by another process, Vesta probably had a lot more going on inside it than does your typical asteroid.

“By saying it’s differentiated, we’re basically saying Vesta was a little planet trying to happen,” said Debra Buczkowski of the Johns Hopkins University Applied Physics Laboratory (JHUAPL), lead author of a new paper titled “Large-scale troughs on Vesta: A signature of planetary tectonics” scheduled to be published by the AGU on Sept. 29.

Read more: Is Vesta a Planet Among Asteroids?

Unlike its big sister Ceres, the largest world among the asteroids and Dawn’s next destination, Vesta isn’t officially classified as a dwarf planet because its shape isn’t spherical enough — a flagrant violation of IAU Planetary Code Regulation No. 2. Rather it’s more flattened, like a walnut. This of course is also likely the result of the impact Vesta sustained at its south pole (which also may be responsible for its rapid 5.35-hour rotation rate, helping to bulge out the equatorial region and possibly even provide an alternate source for the trough “stretch marks”) and so begs the question, was Vesta once a dwarf planet? And if so, does severe reconstruction by an impact event “reclassify” it as something else? What, then? Ex-dwarf planet? A planet-formerly-known-as-dwarf?An undwarf?

I’m sure the IAU is already anticipating the contretemps.

“We have been calling Vesta the smallest terrestrial planet. The latest imagery provides much justification for our expectations. They show that a variety of processes were once at work on the surface of Vesta and provide extensive evidence for Vesta’s planetary aspirations.”

– Chris Russell, Dawn mission principal investigator at UCLA

Read more on the American Geophysical Union’s press release here, and follow the latest from NASA’s Dawn mission here.

Planets in our Solar System May Have Formed in Fits and Starts

Solar shockwaves would have produced proto-planetary rings at different times, meaning the planets did not form simultaneously (artist concept). Credit: ESO.

Did all the planets in our Solar System form at about the same time? Conventional thinking says the components of our Solar System all formed at the same time, and formed rather quickly. But new research indicates that a series of shockwaves emitted from our very young Sun may have caused the planets to form at different times over millions of years.

“The planets formed in intervals – not altogether, as was previously thought,” said Dr. Tagir Abdylmyanov, Associate Professor from Kazan State Power Engineering University in Russia.

Abdylmyanov’s research, which models the movements of particles in fluids and gasses and in the gas cloud from which our Sun accreted, indicates that the first series of shockwaves during short but very rapid changes in solar activity would have created the proto-planetary rings for Uranus, Neptune, and dwarf planet Pluto first. Jupiter, Saturn, and the asteroid belt would have come next during a series of less powerful shockwaves. Mercury, Venus, Earth, and Mars would have formed last, when the Sun was far calmer. This means that our own planet is one of the youngest in the Solar System.

“It is difficult to say exactly how much time would have separated these groups,” Abdylmyanov said, “but the proto-planetary rings for Uranus, Neptune and Pluto would have likely formed very close to the Sun’s birth. 3 million years later and we would see the debris ring destined to form Saturn. Half a million years after this we would see something similar but for Jupiter. The asteroid belt would have begun to form about a million years after that, and another half a million years on we would see the very early stages of Mercury, Venus, Earth and Mars.”

The shockwaves emitted from the new-born Sun would have rippled out material at different times, creating a series of debris rings around the Sun from which the planets formed.

Abdylmayanov hopes that this research will help us understand the development of planets around distant stars. “Studying the brightness of stars that are in the process of forming could give indications as to the intensity of stellar shockwaves. In this way we may be able to predict the location of planets around far-flung stars millions of years before they have formed.”

His work was part of the European Planetary Science Congress taking place this week in Madrid, Spain.

Researchers Present the Sharpest Image of Pluto Ever Taken from Earth

A “speckle image” reconstruction of Pluto and its largest moon, Charon (Gemini Observatory/NSF/NASA/AURA)

Real planet, dwarf planet, KBO, who cares? What matters here is that astronomers have created the sharpest image of Pluto ever made with ground-based observations — and developed a new way to verify potential Earth-like exoplanets at the same time.

Here’s how they did it:


After taking a series of quick “snapshots” of Pluto and Charon using a recently-developed camera called the Differential Speckle Survey Instrument (DSSI), which was mounted on the Gemini Observatory’s 8-meter telescope in Hawaii, researchers combined them into a single image while canceling out the noise caused by turbulence and optical aberrations. This “speckle imaging” technique resulted in an incredibly clear, crisp image of the distant pair of worlds — especially considering that 1. it was made with images taken from the ground, 2. Pluto is small, and 3. Pluto is very, very far away.

Read: Why Pluto is No Longer a Planet

Less than 3/4 the diameter of our Moon, Pluto (and Charon, which is about half that size) are currently circling each other about 3 billion miles from Earth — 32.245 AU to be exact. That’s a long way off, and there’s still much more that we don’t know than we do about the dwarf planet’s system. New Horizons will fill in a lot of the blanks when it passes close by Pluto in July 2015, and images like this can be a big help to mission scientists who want to make sure the spacecraft is on a safe path.

“The Pluto-Charon result is of timely interest to those of us wanting to understand the orbital dynamics of this pair for the 2015 encounter by NASA’s New Horizons spacecraft,” said Steve Howell of the NASA Ames Research Center, who led the Gemini imaging study.

See images of Pluto taken by Hubble here.

In addition, the high resolution achievable through the team’s speckle imaging technique may also be used to confirm the presence of exoplanet candidates discovered by Kepler. With an estimated 3- to 4-magnitude increase in imaging sensitivity, astronomers may be able to use it to pick out the optical light reflected by a distant Earth-like world around another star.

Speckle imaging has been used previously to identify binary star systems, and with the comparative ability to “separate a pair of automobile headlights in Providence, RI, from San Francisco, CA” there’s a good chance that it can help separate an exoplanet from the glare of its star as well.

The research was funded in part by the National Science Foundation and NASA’s Kepler discovery mission, and will be published in the journal Publications of the Astronomical Society of the Pacific in October 2012. Read more here.

Main image: the first speckle reconstructed image for Pluto and Charon from which astronomers obtained not only the separation and position angle for Charon, but also the diameters of the two bodies. North is up, east is to the left, and the image section shown is 1.39 arcseconds across. Resolution of the image is about 20 milliarcseconds rms. Credit: Gemini Observatory/NSF/NASA/AURA. Inset: the Gemini North telescope on the summit of Mauna Kea. (Gemini Observatory)

How Many Asteroids Are Out There?

Answer: a LOT. And there’s new ones being discovered all the time, as this fascinating animation by Scott Manley shows.


Created using data from the IAU’s Minor Planet Center and Lowell Observatory, Scott’s animation shows the progression of new asteroid discoveries since 1980. The years are noted in the lower left corner.

As the inner planets circle the Sun, asteroids light up as they’re identified like clusters of fireflies on a late summer evening. The clusters are mainly positioned along the outer edge of Earth’s orbit, as this is the field of view of most of our telescopes.

Once NASA’s WISE spacecraft begins its search around 2010 the field of view expands dramatically, as well as does the rate of new discoveries. This is because WISE’s infrared capabilities allowed it to spot asteroids that are composed of very dark material and thus reflect little sunlight, yet still emit a telltale heat signature.

While Scott’s animation gives an impressive — and somewhat disquieting — illustration of how many asteroids there are knocking about the inner Solar System, he does remind us that the scale here has been very much compacted; a single pixel at the highest resolution corresponds to over 500,000 square kilometers! So yes, over half a million asteroids is a lot, but there’s also a lot of space out there (and this is just a 2D top-down view too… it doesn’t portray any vertical depth.)

While most asteroids are aligned with the horizontal plane of the Solar System, there are a good amount whose orbits take them at higher inclinations. And on a few occasions they even cross Earth’s orbit.

(Actually, on more than just a few.)

Read: 4700 Asteroids Want to Kill You

An edge-on view of the Solar System shows the positions of asteroids identified by the NEOWISE survey. About 4700 potentially-hazardous asteroids (PHAs) have been estimated larger than 100 meters in size. (NASA/JPL-Caltech)

As far as how many asteroids there are… well, if you only consider those larger than 100 meters orbiting within the inner Solar System, there’s over 150 million. Count smaller ones and you get even more.

I don’t know about you but even with the distances involved it’s starting to feel a little… crowded.

You can see more of Scott Manley’s videos on YouTube here (including some interesting concepts on FTL travel) and learn more about asteroids and various missions to study them here.

Inset image: the 56-km (35-mile) wide asteroid Ida and its satellite, seen by the Galileo spacecraft in 1993. (NASA)