An Enormous Arctic Spiral

Satellite image of a cloud vortex off the coast of Greenland (NASA/MODIS/Chelys)

Looking south across the southern tip of Greenland, this satellite image shows an enormous cloud vortex spiraling over the northern Atlantic ocean on January 26, 2013. An example of the powerful convection currents in the upper latitudes, these polar low cyclones are created when the motion of cold air is energized by the warmer ocean water beneath.

Sometimes referred to as Arctic cyclones, these spiraling storms can bring gale-force winds and heavy snowfall over a wide area of ocean during their 12- to 36-hour lifespans. Hurricane-type storms don’t only form in the tropics!

This image was captured by the MODIS instrument on NASA’s Aqua satellite from its polar orbit 705 km (438 miles) above the Earth. The view has been rotated so south is up; the southernmost tip of Greenland can be seen at lower right. Click for an impressive high-resolution view.

Image via EOSNAP/Chelys

NASA Satellite Snaps Winter Storm “Nemo”

GOES-13 satellite view of the eastern US on Feb. 8 (NASA)

Captured by NASA’s GOES-13 weather satellite on Friday, Feb. 8, this image shows the convergence of two massive low-pressure systems that are expected to bring high winds and up to 2–3 feet of snowfall across much of New England over the next 24 hours. This is the second and most powerful “nor’easter” of the season, and states in the region are preparing for the worst.

Acquired at 9:01 a.m. EST, the GOES image shows clouds associated with the western frontal system stretching from Canada through the Ohio and Tennessee valleys and down into the Gulf of Mexico. The comma-shaped low pressure system located over the Atlantic, east of Virginia, is forecast to merge with the front and create a powerful nor’easter, which The Weather Channel (in a recent move to name winter storms) has dubbed “Nemo.”

Watch a video of this process in action below.

Snowfall forecasts for New England states (Weather Channel)

At the time of this writing, the snow has begun to fall outside this writer’s house. Accumulations are less than an inch — but that’s soon to change! Many cancellations and closings have already been announced across the region, with people making apprehensive associations with the infamous Blizzard of ’78. It’s unlikely that as many people will be caught unprepared, though, especially since modern forecasting methods have dramatically improved over the past 35 years — due in no small part to space technology like NASA’s GOES (Geostationary Operational Environment Program) satellites.

Orbiting Earth at an altitude of 35,790 km (22,240 miles) the 4 operational GOES satellites keep a constant eye on the globe, providing the NOAA with accurate, real-time measurements of water vapor and land and sea temperature variations. See more GOES image data here.

In the path of Nemo? Here’s some tips on how to be prepared.

The Most Remote Workplace on Earth

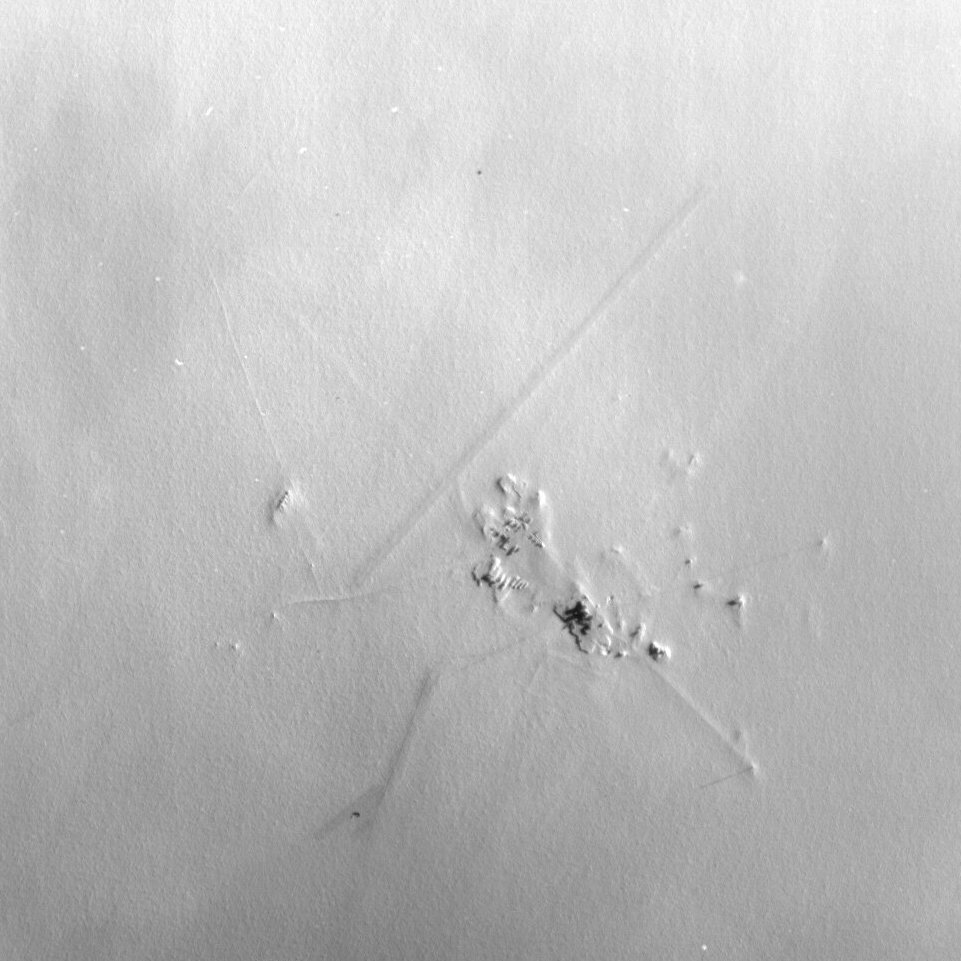
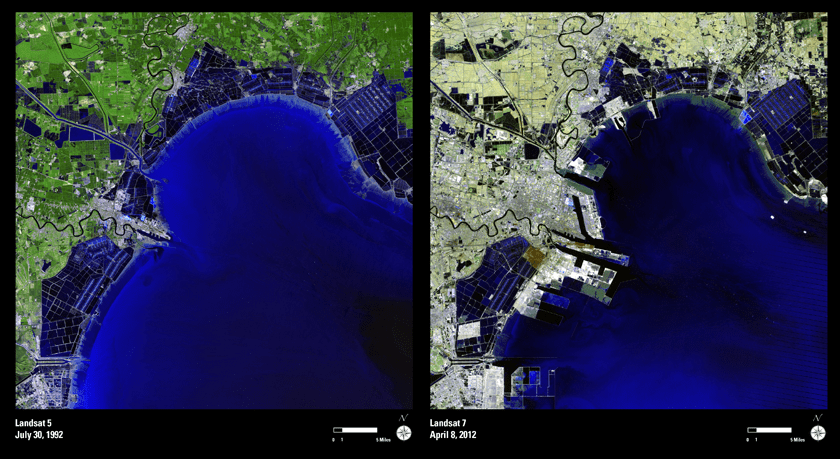
ESA’s Proba-1 satellite imaged the French-Italian Concordia base on November 21, 2012 (ESA)

Located in one of the loneliest locations on Earth, the French-Italian Concordia station was captured on high-resolution camera by ESA’s Proba-1 microsatellite last month, showing the snow-covered base and 25 square kilometers of the virtually featureless expanse of Antarctic ice surrounding it.

A cluster of scientific research buildings situated 3233 meters above sea level in the Antarctic interior, Concordia is one of the only permanently-crewed stations on the southern continent. Around 12–15 researchers and engineers spend months — sometimes over a year —  in isolation at Concordia, where during the winter months there are no deliveries, no chance of evacuation, temperatures below -80 ºC (-112 ºF) and the next closest station is 600 km (370 miles) away. It’s like working on another planet.

And that’s precisely why they’re there.

The researchers who live and work at Concordia are there because of the station’s incredible remoteness and harsh conditions. This allows them to study not only the pristine Antarctic ice beneath their feet but also how humans behave in such an environment, where a small team must learn to work together and merely venturing outside can be a hazardous task.

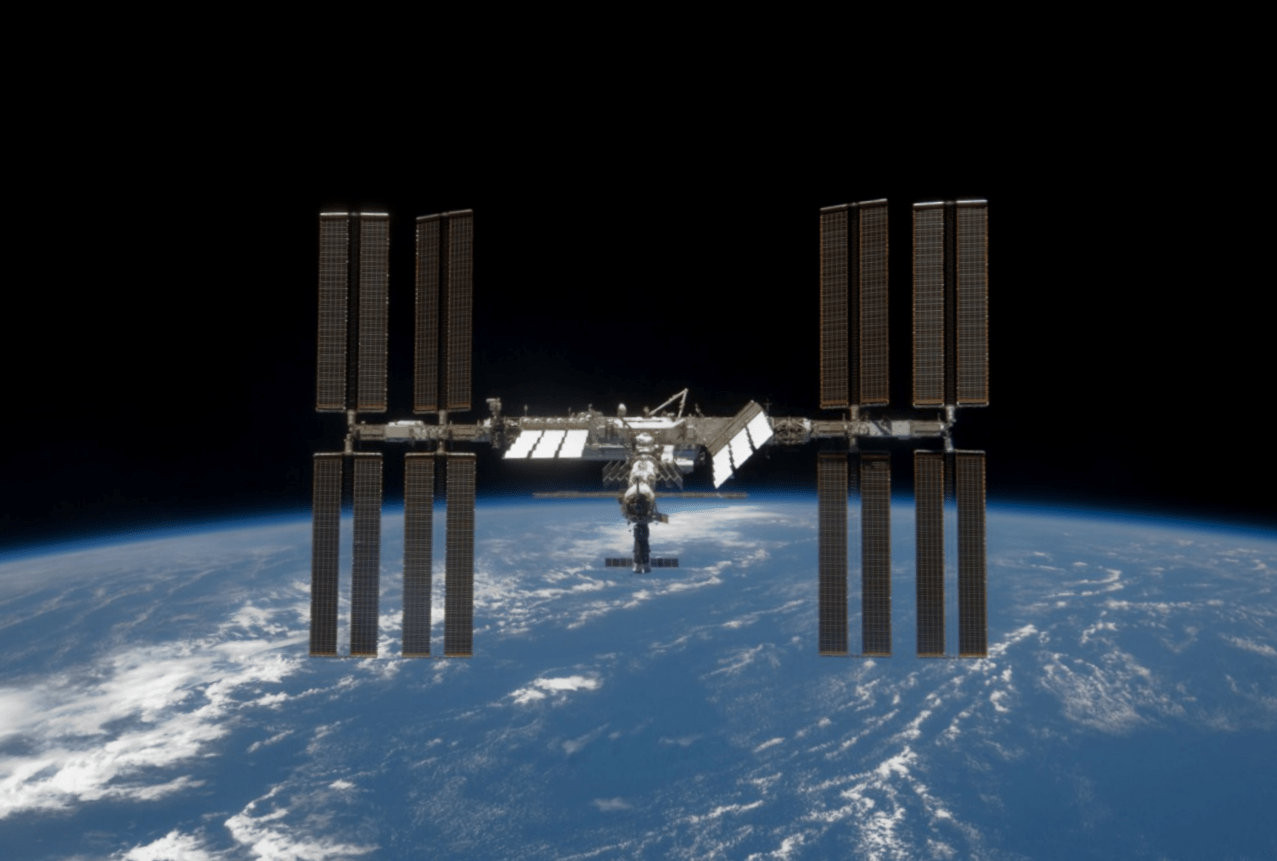
It’s the next closest thing to an actual outpost on Mars, or the Moon. Even the astronauts on the ISS aren’t as far removed from the rest of the world.

(Although the night sky views from Concordia can be comparably stunning.)

Concordia Base boasts some of the clearest, darkest — and coldest — skies on Earth (ESA/IPEV/PNRA – A. Salam)

Read more: Milky Way to Concordia Base… Come In, Concordia Base…

“Boredom and monotony are the enemy,” wrote ESA-sponsored medical researcher Dr. Alex Salam, regarding his 2009 13-month stay. “The darkness has a habit of sucking the motivation out of even the hardiest. But despite the effects the darkness can have on sleep, mood and cognitive performance, there is something inherently special about the Antarctic night. The heavens present a view that many stargazers can only ever dream of. You just have to try and catch a glimpse of the stars before your eyelashes freeze together!

“Seeing the station from a distance with the Milky Way towering far above it never failed to make me feel both awe inspired and simultaneously insignificant.”

And another recent long-term resident of Concordia, Dr. Alexander Kumar, who departed the base on November 15, shared this reflection as his year-long term was approaching its end:

“Concordia has, in removing me from civilisation where sometimes it is harder to step back, enabled me to see the bigger picture, provide a unique experience and reminded me of somethings, setting a course and direction for the future… I think once you come to Antarctica, drawn to it under a spell like a seaman to a mermaid, you never can break the link you form with this raw, rugged and ruthlessly beautiful and enticing continent.”

 The Sun returns to the Antarctic plateau (ESA/IPEV/PNRA – A. Salam)

“It’s the closest thing I’ll ever have to living on another planet.”

– Dr. Alex Salam

Read more about Concordia on the newly-redesigned ESA site here.

In orbit for over 11 years, Proba-1’s unique images are used by hundreds of scientific teams worldwide. To date its main Compact High Resolution Imaging Spectrometer (CHRIS) has acquired over 20,000 environmental science images used by a total of 446 research groups in 60 countries.

Incredible Video of Sandy’s Swirling Progression

Just released, this mesmerizing animation was created by Kevin Ward from images acquired by NOAA’s GOES-O/14 satellite. It shows the progression of Hurricane Sandy, currently a Category 1 hurricane off the coast of the eastern U.S. that’s poised to make a devastating impact when its heavy rains, winds and storm surges strike the shores of many major metropolitan coastal areas — including New York City and Washington, D.C.

Nearly 12 hours of time are compressed into 30 seconds, revealing the evolution of Sandy as it churned over the Atlantic on Sunday, October 28.

 From NASA’s Earth Observatory’s YouTube page:
This time-lapse animation shows Hurricane Sandy from the vantage point of geostationary orbit—35,800 km (22,300 miles) above the Earth. The animation shows Sandy on October 28, 2012, from 7:15 to 6:26 EDT. Light from the changing angles of the sun highlight the structure of the clouds. The images were collected by NOAA’s GOES-14 satellite. The “super rapid scan” images — one every minute from 7:15 a.m. until 6:30 p.m. EDT — reveal details of the storm’s motion.

Launched by NASA as GOES-O on June 27, 2009, GOES-14 is now under control by the NOAA, keeping an eye on the mid-Atlantic region from a geostationary position approximately 22,300 miles (35,800 km) above the Earth.

Sandy is expected to bring up to 10 inches of rain into New York, with a surge possible over 6 feet above high tide and wind gusts in excess of 75 mph. Once the hurricane moves inland there could be millions left without electricity. States of emergency have already been declared in many areas within Sandy’s projected path.

Read: Hurricane Sandy Barreling to Eastern Seaboard, Menacing Millions

Currently Sandy is off the coast of North Carolina (at the time of this writing, 34.5 N / 70.5 W) moving northeast at 14 mph (22  km/h) with a low pressure of 950 mb… that’s as low or lower than some of the most powerful storms to hit the eastern U.S. over the past century, including the “perfect storm” of 1991 (a low system which also struck at Halloween) and the deadly 1938 “Great Hurricane”, which devastated coastal regions all across southern New England.

Stay up to date on Hurricane Sandy’s progress on the NOAA page here, with the latest public advisories being posted here.

NASA animation by Kevin Ward, using images from NOAA and the University of Wisconsin-Madison Cooperative Institute for Meteorological Satellite Studies.

NASA Satellite Sees Ghostly Remains of Vanishing Arctic Sea Ice

Sea ice swirls in ocean currents off the coast of Greenland (NASA/GSFC)

Spooky spectral swirls of last season’s sea ice drift in currents off the coast of eastern Greenland in this image from NASA’s Aqua satellite, acquired on October 17. Although sea ice in the Arctic will start forming again after September’s record low measurements, these ghostly wisps are likely made up of already-existing ice that has migrated south.

As global temperatures rise — both over land and in the ocean — thinner sea ice builds up during the Arctic winter and thus more of it melts during the summer, a pattern that will eventually lead to an ice-free Arctic if trends continue. The past several years saw sea ice in the Arctic below the 1979-2000 average, with this past September displaying the lowest volumes yet recorded.

The graph below, made from data modeled by the Polar Science Center at the University of Washington, show the chilling — or, perhaps, not-so-chilling — results of this century’s recent observations.

Along Greenland’s east coast, the Fram Strait serves as an expressway for sea ice moving out of the Arctic Ocean. The movement of ice through the strait used to be offset by the growth of ice in the Beaufort Gyre.

Until the late 1990s, ice would persist in the gyre for years, growing thicker and more resistant to melt. Since the start of the twenty-first century, however, ice has been less likely to survive its trip through the southern part of the Beaufort Gyre. As a result, less Arctic sea ice has been able to pile up and form multi-year ice.

Thin, free-drifting ice — as seen above — moves very easily with winds and currents.

Aqua is a NASA Earth Science satellite mission named for the large amount of information that the mission is collecting about the Earth’s water cycle, including evaporation from the oceans, water vapor in the atmosphere, clouds, precipitation, soil moisture, sea ice, land ice, and snow cover on the land and ice. Aqua was launched on May 4, 2002, and carries six Earth-observing instruments in a near-polar low-Earth orbit. MODIS, which acquired the image above, is a 36-band spectroradiometer that measures physical properties of the atmosphere, oceans and land.

Source: NASA Earth Observatory

NASA image courtesy Jeff Schmaltz, LANCE MODIS Rapid Response Team at NASA GSFC. Graph by Jesse Allen based on modeled ice volume data from the Polar Science Center, University of Washington. Caption portions by Michon Scott with information from Ted Scambos, National Snow and Ice Data Center.

Exploded Rocket Fragments Could Endanger ISS and Future Missions

The International Space Station will have to look out for new debris from an exploded Russian rocket (NASA image)

Traveling through low-Earth orbit just got a little more dangerous; a drifting Russian Breeze M (Briz-M) rocket stage that failed to execute its final burns back on August 6 has recently exploded, sending hundreds of shattered fragments out into orbit.

Russia and the U.S. Defense Department (JFCC-Space) have stated that they are currently tracking 500 pieces of debris from the disintegrated Breeze M, although some sources are saying there are likely much more than that.

After a successful liftoff via Proton rocket on August 6 from the Baikonur Cosmodrome, the Breeze M upper stage’s engines shut off after only 7 seconds as opposed to the normal 18 minutes, leaving its fuel tanks filled with 10 to 15 tons of hydrazine and nitrogen tetroxide propellants. Its payloads, the Indonesian Telkom 3 and the Russian Express-MD2 communications satellites, were subsequently deployed into the wrong orbits as the Breeze M computer continued functioning.

Although originally expected to remain intact for at least another year, the rocket stage “violently disintegrated” on October 16. Evidence of the explosion was first observed by astronomer Robert McNaught at Australia’s Siding Springs Observatory, who counted 70 fragments visible within the narrow field-of-view telescope he was using for near-Earth asteroid observations.

The exact cause of the explosion isn’t known — it may have been sparked by an impact with another piece of space junk or the result of stresses caused by the Breeze M’s eccentric orbit, which varied in altitude from 265 to 5,015 kilometers (165 miles to 3,118 miles) with an inclination of 49.9 degrees.

This was the third such breakup of a partially-full Breeze M upper stage in orbit, the previous events having occurred in 2007 and 2010, and yet another Breeze M still remains in orbit after a failed burn in August 2011.

Most of the latest fragments are still in orbit at altitudes ranging from 250 to 5,000 km (155 to 3,100 miles), where they are expected to remain.

“Although some of the pieces have begun to re-enter, most of the debris will remain in orbit for an extended period of time.”

– Jamie Mannina, US State Department spokesperson

According to NASA the debris currently poses no immediate threat to the Space Station although the cloud is “believed not to be insignificant.” Still, according to a post on Zarya.com the Station’s course will periodically take it within the Breeze M debris cloud, and “will sometimes spend several days at a time with a large part of its orbit within the cloud.”

Source: RT.com and SpaceflightNow.com.  Inset image: the Breeze M (Briz-M) upper stage which disintegrated on Oct. 16. (Khrunichev)

Manhattan-Sized Ice Island Heads Out to Sea

An “ice island” that calved from the Petermann Glacier in July is seen by NASA satellite (MODIS/Terra)

Remember that enormous slab of ice that broke off Greenland’s Petermann Glacier back in July? It’s now on its way out to sea, a little bit smaller than it was a couple of months ago — but not much. At around 10 miles long and 4.6 miles across (16.25 x 7.5 km) this ice island is actually a bit shorter than Manhattan, but is fully twice as wide.

The image above was acquired on September 14 by the Moderate Resolution Imaging Spectroradiometer (MODIS) aboard NASA’s Terra satellite.

Although the calving of this particular ice island isn’t thought to be a direct result of increasing global temperatures, climate change is thought to be a major factor in this year’s drop in Arctic sea ice extent, which is now below 4.00 million square kilometers (1.54 million square miles). Compared to September conditions in the 1980s and 1990s, this represents a 45% reduction in the area of the Arctic covered by sea ice.

Arctic sea ice extent data for June-July 2012 (NSIDC)

This year sea ice in the Arctic Ocean dropped below the previous all-time record, set in 2007. 2012 also marks the first time that there has been less than 4 million square kilometers (1.54 million square miles) of sea ice since satellite observations began in 1979.

The animation below, released today by the NOAA, shows the 2012 time-series of ice extent using data from the DMSP SSMI/S satellite sensor:

Read more here.

What Are The Radiation Belts?

NASA’s twin Radiation Belt Storm Probe (RBSP) satellites, scheduled to launch from Cape Canaveral Friday, August 24* at 4:08 a.m. ET, will enter into an eccentric orbit around our planet, repeatedly passing through both of the Van Allen radiation belts that surround Earth like enormous high-intensity particle filled inner tubes. The plasma contained within these belts can affect satellites, spacecraft and communication here on Earth, and are affected in turn by outbursts of solar energy from the Sun — especially during periods of solar maximum. But how do these invisible yet powerful radiation belts actually work, and how will two six-foot-wide satellites help us learn more about them? Watch the video.

(And then read more here.)

Video: NASA

*UPDATE: After several delays due to weather and technical issues, the RBSP mission successfully launched on Thursday, August 30.

The Top 5 “Earth as Art” Images, Thanks to Landsat

NASA’s first Earth-observing Landsat satellite launched from Vandenberg Air Force Base on July 23, 1972, and to celebrate the 40th anniversary of the program they asked the public to vote on their favorite images of the planet from the Landsat Earth as Art gallery. After over 14,000 votes, these were chosen as the top 5 favorites. Happy 40th anniversary, Landsat!

Landsat images from space are not merely pictures. They contain many layers of data collected at different points along the visible and invisible light spectrum. A single Landsat scene taken from 400 miles above Earth can accurately detail the condition of hundreds of thousands of acres of grassland, agricultural crops or forests.

“Landsat has given us a critical perspective on our planet over the long term and will continue to help us understand the big picture of Earth and its changes from space,” said NASA Administrator Charles Bolden. “With this view we are better prepared to take action on the ground and be better stewards of our home.”

In cooperation with the U.S. Geological Survey (USGS), a science agency of the Interior Department, NASA launched six of the seven Landsat satellites. The resulting archive of Earth observations forms a comprehensive record of human and natural land changes.

“The first 40 years of the Landsat program have delivered the most consistent and reliable record of Earth’s changing landscape.”

– Michael Freilich, director of NASA’s Earth Science Division

“Over four decades, data from the Landsat series of satellites have become a vital reference worldwide for advancing our understanding of the science of the land,” said Interior Department Secretary Ken Salazar. “The 40-year Landsat archive forms an indelible and objective register of America’s natural heritage and thus it has become part of this department’s legacy to the American people.”

The next satellite in the series, the Landsat Data Continuity Mission (LDCM) is scheduled to launch on February 11, 2013.

(Source: NASA/GSFC)

Find out more about the ongoing Landsat mission here, and see recent visualizations from Landsat on the USGS site here.

Video: NASA/GSFC. Inset image: Industrial growth in Binhai New Area, China.  Sub-feature: Erg Iguidi, an area of ever-shifting sand dunes extending from Algeria into Mauritania in northwestern Africa, one of the chosen top 5 Earth as Art images. NASA/GSFC/USGS.

CGI Movie From 1963 Shows Satellite Orbit

In what may very well be the world’s first computer-generated animation, this video shows the motion of a box-like “satellite” orbiting a rotating sphere… Pixar, eat your heart out.

Created in 1963 by Edward E. Zajac, a programmer at Bell Labs from 1954 to 1983, the animation was made to demonstrate a theoretical satellite that used gyroscopes to maintain an Earth-facing orientation. Only a year after the launch of Telstar 1, the world’s first communications satellite (which just had its 50th anniversary) Bell Labs was very much invested in the development of satellite technology.

According to the description on the ATT Tech YouTube channel:

Zajac programmed the calculations in FORTRAN, then used a program written by Zajac’s colleague, Frank Sinden, called ORBIT. The original computations were fed into the computer via punch cards, then the output was printed onto microfilm using the General Dynamics Electronics Stromberg-Carlson 4020 microfilm recorder. All computer processing was done on an IBM 7090 or 7094 series computer.

I’d like to say that many Bothans died to bring us this information but… well, I guess I just did.

Footage courtesy of AT&T Archives and History Center in Warren, NJ. H/T to Paul Caridad at VisualNews.com.