Getting to the Core of Earth’s Falling Snow

Visualization of the GPM Core Observatory and Partner Satellites. Credit: NASA

[/caption]

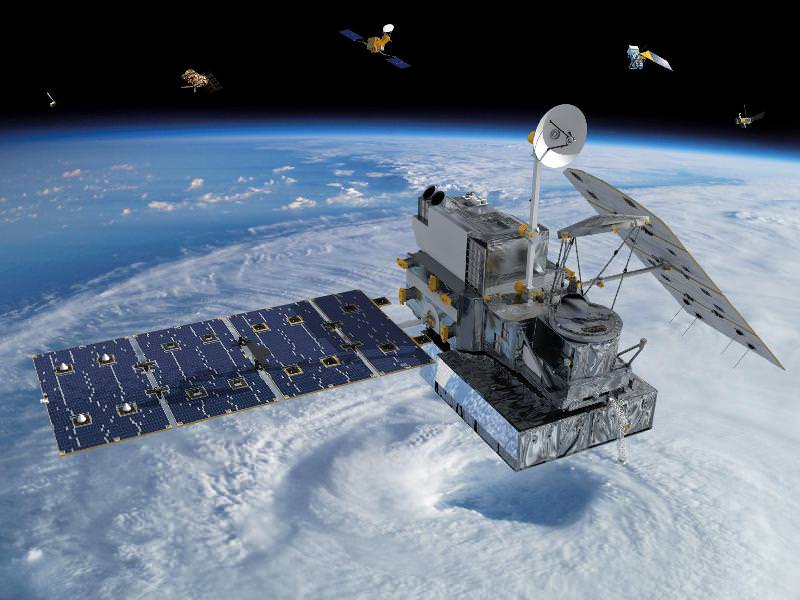
An international plan is unfolding that will launch satellites into orbit to study global snowfall precipitation with unprecedented detail. With the upcoming Global Precipitation Measurement (GPM) satellites, for the first time we will know when, where and how much snow falls on Earth, allowing greater understanding of energy cycles and how best to predict extreme weather.

Snow is more than just a pretty winter decoration… it’s also a very important contributor to fresh water supply in many regions around the world, especially those areas that rely on spring runoff from mountains.

The snowmelt from the Sierra Nevadas, for example, accounts for a third of the water supply for California.

But changing climate and recent drought conditions have affected how much snow the mountains receive in winter… and thus how much water is released in the spring. Unfortunately, as of now there’s no reliable way to comprehensively detect and measure falling snow from space… whether in the Sierras or the Andes or the Alps.

Engineers are building and testing the GPM Core Observatory at Goddard Space Flight Center. (NASA/GSFC)

The GPM Core satellite, slated to launch in 2014, will change that.

“The GPM Core, with its ability to detect falling snows, it’s one of the very first times that we’ve put sensors in space to specifically look at falling snow,” said GPM Deputy Project Scientist Gail Skofronick-Jackson in an online video. “We’re at that edge where rain was fifty years ago. We’re still figuring out how to measure snow.”

And why is snow such a difficult subject to study?

“Rain tends to be spherical like drops,” says Skofronick-Jackson. “But if you’ve ever been out in a snowfall and you’ve looked at your shirt, you see the snow comes in all different forms.”

Once GPM scientists calculate all the various types of snowflake shapes, the satellite will be able to detect them from orbit.

“The GPM Core, with its additional frequencies and information on the sensors, is going to be able to provide us for the first time a lot more information about falling snow than we’ve ever done before.”

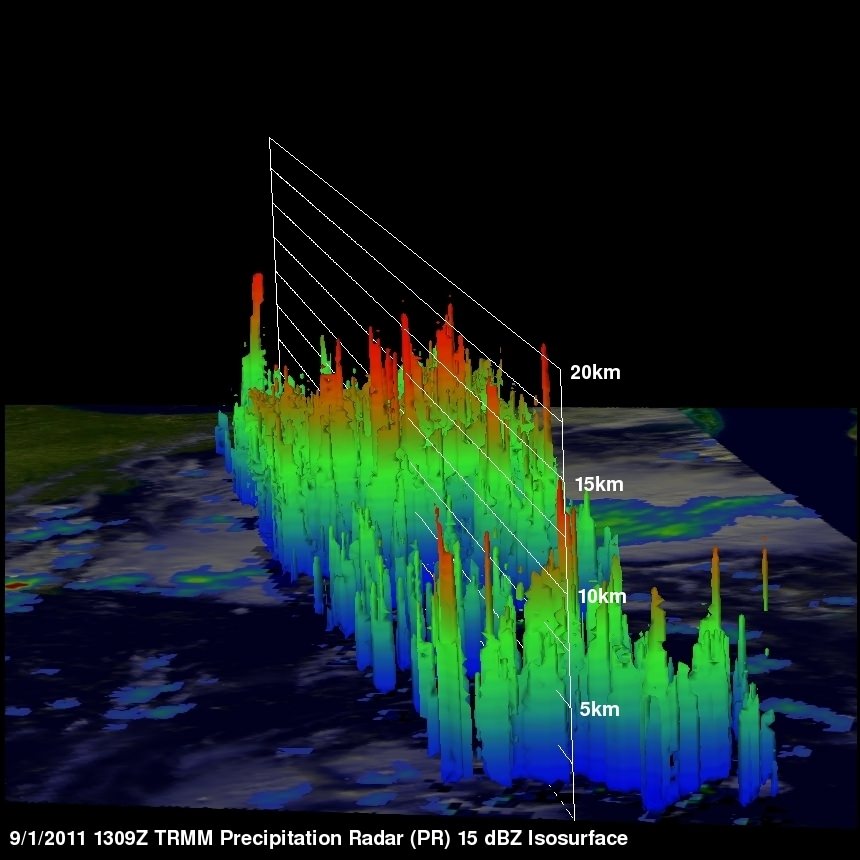
Knowing where and how much snow and rain falls globally is vital to understanding how weather and climate impact both our environment and Earth’s energy cycles, including effects on agriculture, fresh water availability, and responses to natural disasters.

Snowfall is a missing part of the puzzle, and GPM will fill those pieces in.

Find out more about the GPM program at pmm.nasa.gov/GPM.

GPM Core is currently being assembled at NASA’s Goddard Space Flight Center and scheduled to launch in 2014 on a Japanese H-IIA rocket.  Initiated by NASA and the Japanese Aerospace Exploration Agency (JAXA), GPM consists of a consortium of international agencies, including the Centre National d’Études Spatiales (CNES), the Indian Space Research Organization (ISRO), the National Oceanic and Atmospheric Administration (NOAA), the European Organization for the Exploitation of Meteorological Satellites (EUMETSAT), and others. 

NASA’s Blue Marble…Side B.

Earth's eastern hemisphere made from Suomi NPP satellite images. (NASA/NOAA)

[/caption]

In response to last week’s incredibly popular “Blue Marble” image, NASA and NOAA have released a companion version, this one showing part of our planet’s eastern hemisphere.

The image is a composite, made from six separate high-resolution scans taken on January 23 by NASA’s recently-renamed Suomi NPP satellite.

From the description on NASA Goddard Space Flight Center’s Flickr page:

Compiled by NASA Goddard scientist Norman Kuring, this image has the perspective of a viewer looking down from 7,918 miles (about 12,742 kilometers) above the Earth’s surface from a viewpoint of 10 degrees South by 45 degrees East. The four vertical lines of ‘haze’ visible in this image shows the reflection of sunlight off the ocean, or ‘glint,’ that VIIRS captured as it orbited the globe. Suomi NPP is the result of a partnership between NASA, NOAA and the Department of Defense.

Last week’s “Blue Marble” image is now one of the most-viewed images of all time on Flickr, receiving nearly 3.2 million views!

See the previously released image here.

NASA launched the National Polar-orbiting Operational Environmental Satellite System Preparatory Project (or NPP) on October 28, 2011 from Vandenberg Air Force Base. On Jan. 24, NPP was renamed Suomi National Polar-orbiting Partnership, or Suomi NPP, in honor of the late Verner E. Suomi. It’s the first satellite designed to collect data to improve short-term weather forecasts and increase understanding of long-term climate change.

Image credit: NASA/NOAA

Added: check out a “zoomified” version of this image on John Williams’ StarryCritters site.


Tropical Storm Lee Drenches Gulf Coast as Hurricane Katia Aims for US East Coast

Tropical Storm Lee - Visible image from the GOES-13 satellite on Sunday, Sept. 4 at 9:32 a.m. EDT. It shows the extent of Lee's cloud cover over Louisiana, Mississippi, Alabama and the Florida Panhandle and spread into the Tennessee Valley. The thickest clouds and heaviest rainfall stretch from the northeast to southwest of the center. Credit: NASA/NOAA GOES Project

[/caption]

New imagery from NASA and NOAA satellites taken today (Sept 4) shows the extent of a hurricane season storm currently ravaging the US Gulf Coast and another potentially posing a new threat to US East Coast areas still suffering from the vast destruction caused by Hurricane Irene just days ago. Data from the NASA and NOAA satellites is critical in providing advance warning to government officials and local communities to save human lives and minimize property damage. .

Slow moving Tropical Storm Lee has unleashed strong thunderstorms and heavy rainfall in several Gulf Coast states. Rainfall amounts of up to 7 to 14 inches over the last 48 hours are currently drenching coastal and inland communities – especially in Louisiana, Mississippi and Alabama along a wide swath that extends from Texas to the Florida panhandle.

Isolated pockets of Gulf State areas may see up to 20 inches of rainfall. Severe flooding to homes and roads has occurred in some locations. Winds have diminished from 60 mph on Saturday (Sept. 3) to 45 mph on Sunday.

Imagery and measurements from the Aqua and GOES-13 satellites from NASA and NOAA revealed that TS Lee finally made landfall in Louisiana after two days of drenching rain along the Gulf Coast..

A tropical storm warning is in effect on Sept 4 for New Orleans, Lake Pontchartrain, and Lake Maurepas. Fortunately the rebuilt levees in New Orleans appear to holding in the first serious test since the vast destruction of Hurricane Katrina. Other areas are less lucky.

This infrared image of Tropical Storm Lee on Sept. 3 at 3:47 p.m. EDT when the center was still sitting south of the Louisiana coast. The strongest thunderstorms and coldest clouds (purple) stretched from Mobile Bay, south into the Gulf of Mexico and covered about 1/3rd of the Gulf of Mexico. Winds were 55 mph at the time of this image. The image was taken by the AIRS instrument on NASA's Aqua satellite. Credit: NASA JPL, Ed Olsen NASA

Lee’s tropical force winds now extend out 275 miles from the center. A large part of Lee is still over the Gulf of Mexico where the driving wind and rain affected operations on some oil rigs.

Lee has spawned more than a dozen tornadoes in the Gulf Coast states. The storm is spreading more heavy rain and winds on a northeast to east- northeast heading tracking towards Tennessee over the next 24 to 36 hours according to the latest weather forecasts.

Meanwhile Hurricane Katia is packing winds of 110 MPH and is on a path that could cause it to make landfall on the Outer Banks of North Carolina just a week after the state suffered from Hurricane Irene.

Hurricane Katia has the potential to affect the launch of NASA’s GRAIL Lunar Mappers slated for liftoff on Sept. 8 from Cape Canaveral, Florida, depending on its exact course.

This GOES-13 satellite image shows Hurricane Katia (right), Tropical Depression 13 (left) and System 94L (top). Credit: NASA/NOAA GOES Project

Irene caused extensive flooding and devastation on the hundred year scale in several US states still reeling from flooding and destruction. More than 43 deaths have been reported so far, including emergency rescue workers. Initial damage estimates are over $6 Billion.

Thousands of East Coast homes and businesses are still without power as strong after effects from Irene continue to play out.

President Obama toured flood stricken areas of Paterson, New Jersey today (Sept. 4).

According to a statement by Rob Gutro, of NASA’s Goddard Space Flight Center, Greenbelt, Md; Tropical Storm Lee’s winds had dropped from 60 mph exactly 24 hours before to 45 mph at 8 a.m. EDT on Sept. 4.

Lee’s center was over Vermillion Bay, Louisiana near 29.7 North and 92.0 West. It was crawling to the northeast near 3 mph (6 kmh) and expected to continue in that direction today, turning to the east-northeast tonight. Because Lee’s center is over land, he is expected to continue weakening gradually in the next couple of days. Lee’s outer bands still extend far over the Gulf of Mexico, bringing in more moisture and keeping the system going.

Here's a 3-D look at Tropical Depression 13 from NASA's TRMM Satellite on Sept 1. Some of the highest thunderstorm towers in that area were shown by PR data to reach heights of over 15km (~9.3 miles) and there were areas of heavy rain - which is going to affect the shoreline.. waves of rainfall to move inland. Credit: NASA/Goddard
This visible image of Tropical Storm Lee was taken from the GOES-13 satellite on Saturday, Sept. 3 at 9:32 a.m. EDT. It shows the extent of Lee's cloud cover over Louisiana, Mississippi, Alabama and the Florida Panhandle. The clearing on the southeastern side is a result of drier air moving in and preventing development of thunderstorms. Credit: NASA/NOAA GOES Project

Deadly and Destructive Path of Hurricane Irene seen in NASA Videos and Images

Irene Makes Landfall Over New York. This GOES-13 satellite image is of Hurricane Irene just 28 minutes before the storm made landfall in New York City. The image shows Irene's huge cloud cover blanketing New England, New York and over Toronto, Canada. Shadows in Irene's clouds indicate the bands of thunderstorms that surrounded the storm. Credit: NASA/NOAA GOES Project

NASA Video Caption: The Life of Hurricane Irene from the Caribbean to Canada from August 21 through August 29 seen by NASA/NOAA satellites. Credit: NASA/NOAA/GOES/MODIS

The new NASA animation above shows the birth and subsequent destructive and deadly path followed by Hurricane Irene from August 21 through August 29, 2011 starting in the Caribbean, and then tracking along the US East Cost and up into Canada. The observations combine images taken by NASA and NOAA Earth orbiting satellites.

The cloud images were captured by the NASA/NOAA GOES-13 satellite and overlaid on a true-color NASA MODIS map. Irene followed a lengthy course over Puerto Rico, Hispaniola, the Bahamas, and then along the entire US East with landfalls over North Carolina, New Jersey and New York.

NASA ISS astronaut Ron Garan and cameras flying overhead aboard the International Space Station (ISS) also photographed vivid images showing the magnitude of Irene slamming into the US East coast.

Irene caused widespread property damage. Massive and raging flooding in several US states destroyed houses, crushed businesses and washed away bridges and roads and more. The worst flooding is yet to come to some inland portions of Vermont, New Jersey, New York, Pennsylvania and elsewhere as uncontrollable waters continue to rise at numerous rivers, lakes and even ponds, threatening even more misery in their wake.

[/caption]

So far 41 fatalities in 12 states have been attributed to Irene and more may be expected as searches continue. Some communities have been entirely cut off due to washed out access. Airlifts of food and water have begun. More people are being evacuated from New Jersey towns today, Aug 30.

Brave emergency rescue workers have put their own lives at peril and saved the lives of countless others of all ages from babies to the elderly. Some 8 million customers, including my area, lost power due to extensive flooding, downed trees and electrical wires, and devastated infrastructure.

Hurricane Irene twitpic from the International Space Station on 8/27/11 by NASA Astronaut Ron Garan
Irene From Space and the ISS as it crossed the coast on August 27, 2011 at 3:32pm EST. Hope everyone is OK wrote NASA Astronaut Ron Garan with his twitpic from the ISS. Credit: NASA/Ron Garan aboard the ISS

Emergency crews are hard at work to restore power as quickly as possible, but many thousands of homes and businesses could be without power for up to a week or more. About 3.3 million customers are still without power today.

NASA’s GOES-13 satellite captured a dramatic view of Hurricane Irene just 28 minutes prior to making landfall over New York City. Today’s NASA Image of the day shows the humongous cloud cover spanning the US East coast from the Mid-Atlantic States up to New Jersey, New York, Pennsylvania, and New England and into Toronto, Canada.

This GOES-13 image from Monday, August 29 at 7:45 a.m. EDT shows an active Atlantic Ocean with the remnants of Hurricane Irene moving into Quebec and Newfoundland (left), Tropical Storm Jose (center) and newly formed Tropical Depression 12 (right). Credit: NASA/NOAA GOES Project
Irene slams into North Carolina. The GOES-13 satellite saw Hurricane Irene on August 27, 2011 at 10:10 a.m. EDT after it made landfall at 8 a.m. in Cape Lookout, North Carolina. Irene's outer bands had already extended into New England. Credit: NASA/NOAA GOES Project

Many transit systems and airports in Irene’s path were shutdown ahead of the storm.

Send me your photos of Irene’s destruction to post at Universe Today.

Latest Satellite Images/Videos as Hurricane Irene Bears Down on US East Coast

GOES satellite image of Hurricane Irene as of 18:15 UTC on August 26, 2011. Credit: NOAA

What a view: Here’s a video of Hurricane Irene’s path, starting on August 24 up until 18:40 UTC on August 26, 2011, as seen by a GOES satellite. Even though Hurricane Irene is continuing to slowly weaken as it pushes closer to the Carolina coast, this massive storm could affect a huge area of the Eastern US seaboard, and tropical storm force winds and squalls are buffeting the coast. Irene will impact the entire Mid-Atlantic and Northeast Coast, including Washington, Philadelphia, New York City, Hartford, Ct. and Boston this weekend.

This hurricane spans nearly 1,000 kilometers (600 miles).

Below is a video taken from the International Space Station late yesterday afternoon. Includes astronaut commentary on the view of this “huge, scary storm” from 370 km (230 miles) up:

Or click on this link to see the latest video of Hurricane Irene from GOES and Goddard Space Flight Center

Cameras mounted on the International Space Station captured this video. Forecasters are predicting landfall on the outer banks of North Carolina Saturday before tracking up the mid-Atlantic states and a possible path over the metropolitan New York area and New England late this weekend.

[/caption]

Hot off the wires is this satellite image of Hurricane Irene taken less than an hour ago (as of this writing) by one of the GOES satellites for NOAA.

Here’s the latest from WeatherBug:

Imagery of Hurrican Irene from WeatherBug.com

And here’s the latest from the Moderate Resolution Imaging Spectroradiometer (MODIS) on the Terra satellite on August 25:

Hurricane Irene as seen by Moderate Resolution Imaging Spectroradiometer (MODIS) 
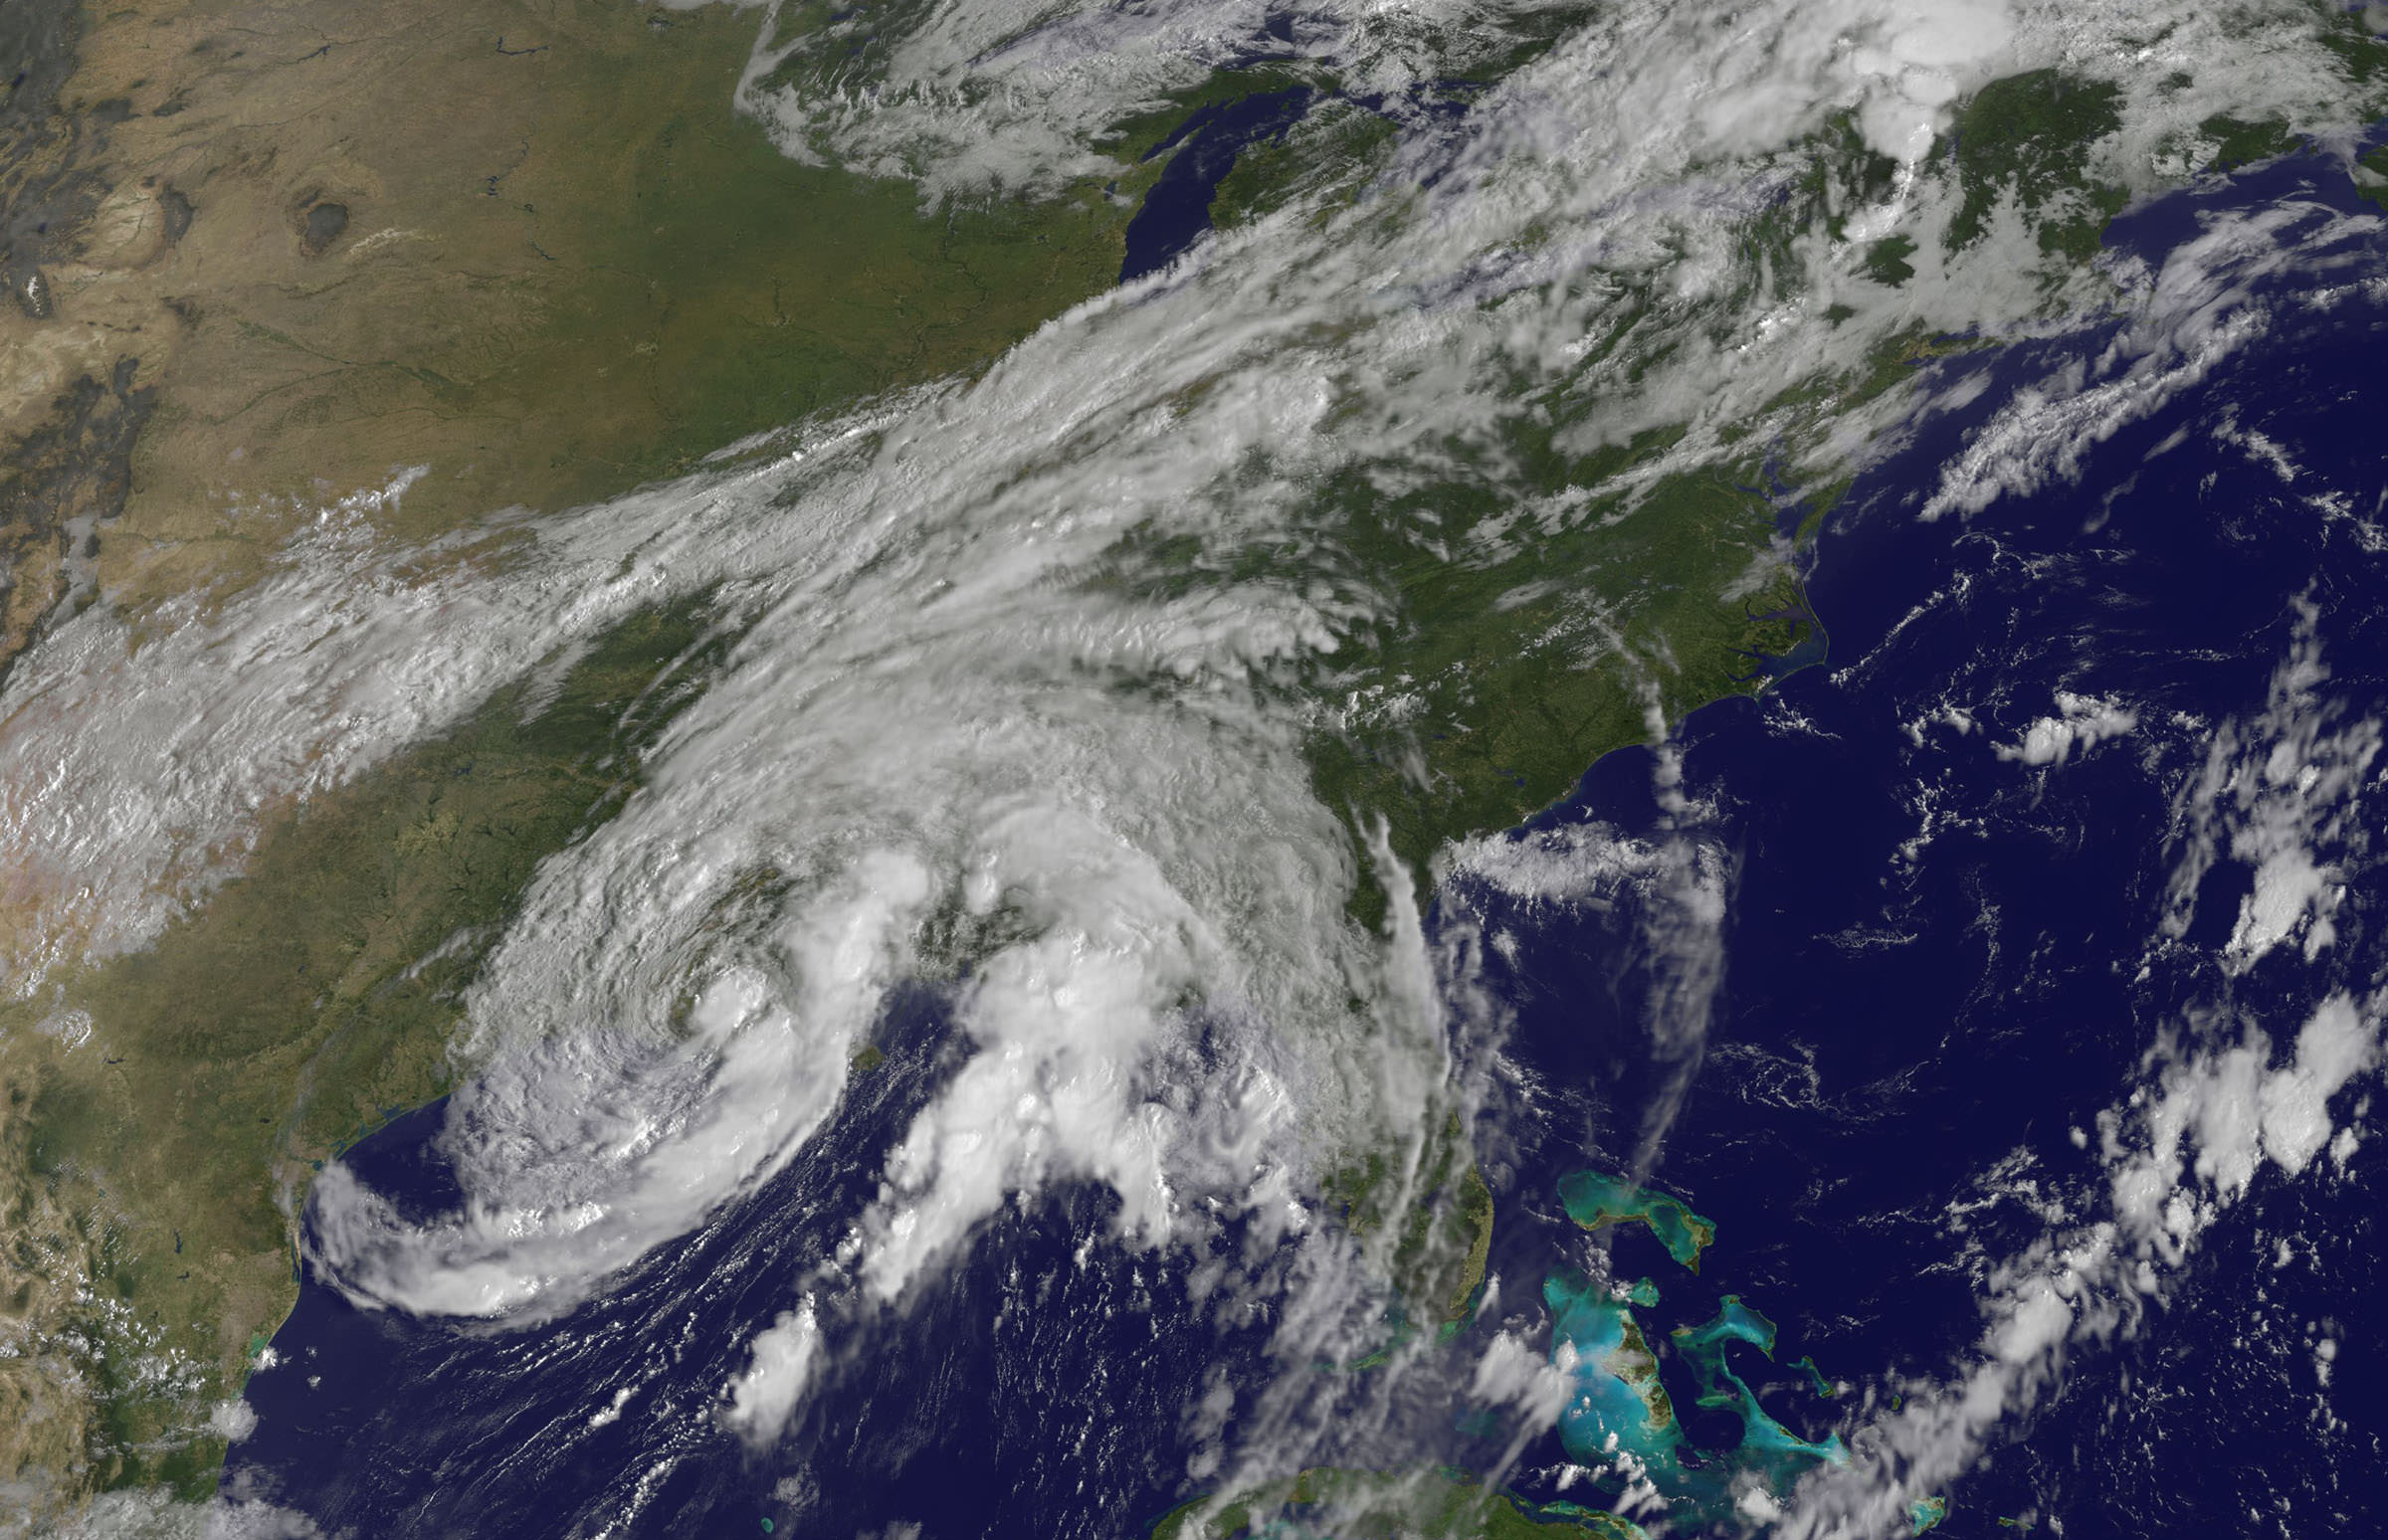
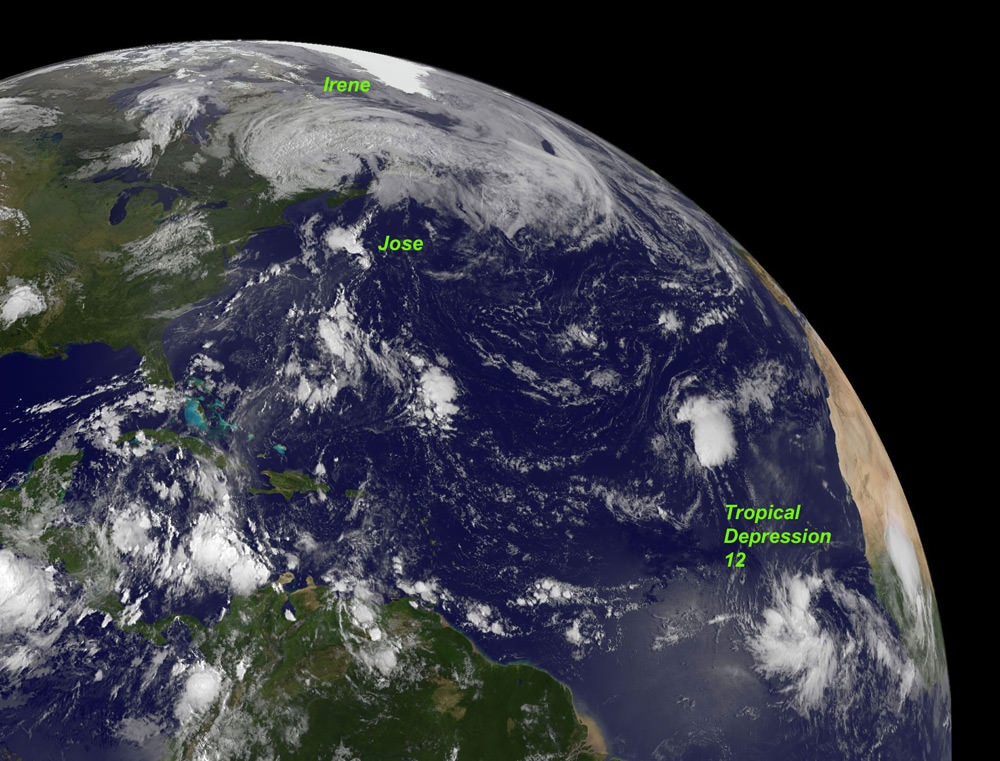
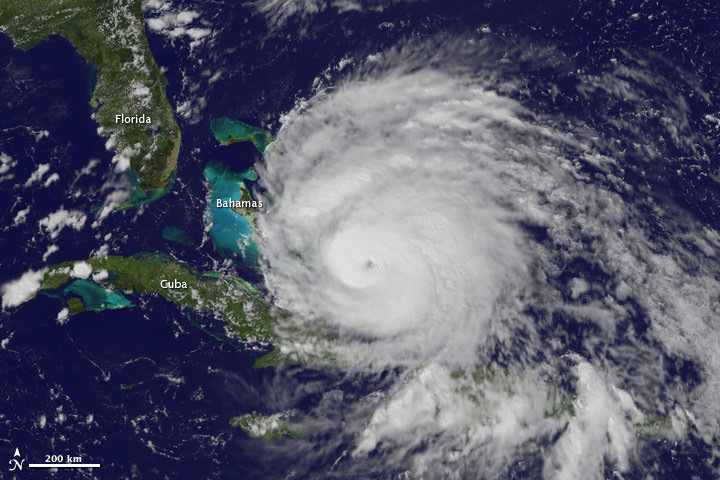
on the Terra satellite on August 25. Credit: NASA

See more up-to-date satellite images from NOAA’s cadre of Earth-observing satellites at this link.

Sources: NASA Earth Observatory, WeatherBug, NOAA, Goddard Space Flight Center

2010 Tied for Warmest Year on Record say NOAA and NASA

World map with global temperature changes from 1880 to 2010. Credit: NASA GISS

[/caption]

Newly released scientific data shows that 2010 equals 2005 as the Earths warmest year on record over the last 131 years, say researchers from NOAA and NASA. Temperature measurements from instrumented monitoring stations date back to 1880.

The past decade from 2001 to 2010 was the warmest on record and includes 9 of the 10 hottest years. A NOAA ranking of the 15 hottest years globally shows they all occurred in the last 15 years since 1995.

2010 was the 34th consecutive year with global temperatures above the 20th century average of 57.0 F (13.9°C), according to NOAA data. 1976 was the last year with a below average global temperature. Updated.

Global surface temperature anomalies for 2010. Credit: NOAA

Overall, the combined global land and ocean surface temperatures for 2010 and 2005 has risen 1.12 F (0.62 C) compared with the 20th century average, according to NOAA. The average global temperature in 2010 was 58.12 degrees compared to 57.0 F (13.9°C) as the average for all of 20th century. 2010 was also the wettest year on record.

The rise in Earths’ global temperature has been accompanied by a decline in arctic sea ice. Specifically, surface air temperatures in the arctic were warmer than normal during the summer of 2010. The sea ice extent measured in September 2010, was the 3rd lowest on record since accurate monitoring began in 1979, states NOAA in the annual Arctic report card. See Video below.

Scientists from NOAA’s National Climatic Data Center (NCDC) in Asheville, N.C. and NASA’s Goddard Institute for Space Studies (GISS) in New York City announced the findings on Jan 12. The temperature data are collected by weather stations that span across the globe.

Global measurements by independent researchers in the UK at the Met Office Hadley Centre and at the Japanese Meteorological Agency closely match the trend of warming temperatures gathered by NOAA NCDC and NASA GISS.

The graphic below combines the actual temperature data collected independently by the four research agencies. The temperature trend lines are remarkably consistent.

Multiple institutions monitor global surface temperatures. Despite subtle differences in the ways the scientists perform their analyses, these four widely referenced records show remarkable agreement. Credit: NASA Earth Observatory/Robert Simmon

Much of the rise in global temperatures has taken place since the late 1970’s, says NASA. The rate of increase has been about 0.36 F per decade. The NASA GISS weather data were collected using over 1000 meteorological stations around the world, satellite observations of sea surface temperature and Antarctic research station measurements.

2010 average annual temperature ranks by state in the US. Credit: NOAA

The data are fed into a computer program which then calculates temperature anomalies — the difference between surface temperature in a given month and the average temperature for the same period during 1951 to 1980. NASA GISS uses that three-decade period as the baseline for analysis against which climate change can be tracked. NOAA uses the entire 20th century.

For the contiguous United States, NOAA analysis shows that “2010 was the 14th consecutive year with an annual temperature above the long-term average. Since 1895, the temperature across the US has increased at an average rate of approximately 0.12 F per decade.”

More at these press releases from NOAA and NASA

There are large areas in the Arctic without weather stations. NASA GISS approaches the problem by filling in gaps with data from the nearest land stations. The Climatic Research Unit at the University of East Anglia, which works jointly with the Met Office Hadley Centre, leaves much of the region out of its global temperature analysis. Credit: NASA Earth Observatory/Robert Simmon
2010 Global Significant Weather and Climate Events. Credit: NOAA
Global Temperatures.
The year 2010 tied with 2005 as the warmest year since records began in 1880. The annual global combined land and ocean surface temperature was 0.62°C (1.12°F) above the 20th century average. The range associated with this value is plus or minus 0.07°C (0.13°F). The 2010 combined land and ocean surface temperature in the Northern Hemisphere was also the warmest on record, while the combined land and ocean surface temperature in the Southern Hemisphere was the sixth warmest such period on record. Credit: NOAA

NOAA Arctic Report Card 2010