Powerful New Next-Gen US/Japan GPM Satellite to Revolutionize Global Precipitation Observations and Climate Science Research

NASA’s next generation Global Precipitation Measurement (GPM) observatory inside the clean room at NASA Goddard Space Flight Center, MD. Technicians at work on final processing during exclusive up-close inspection tour by Universe Today. GPM is slated to launch on February 27, 2014 and will provide global measurements of rain and snow every 3 hours. Credit: Ken Kremer/kenkremer.com

NASA GODDARD SPACE FLIGHT CENTER, MARYLAND – Weather researchers and forecasters worldwide are gushing with excitement in the final days leading to blastoff of the powerful, new Global Precipitation Measurement (GPM) Core Observatory – built by NASA in a joint effort with Japan.

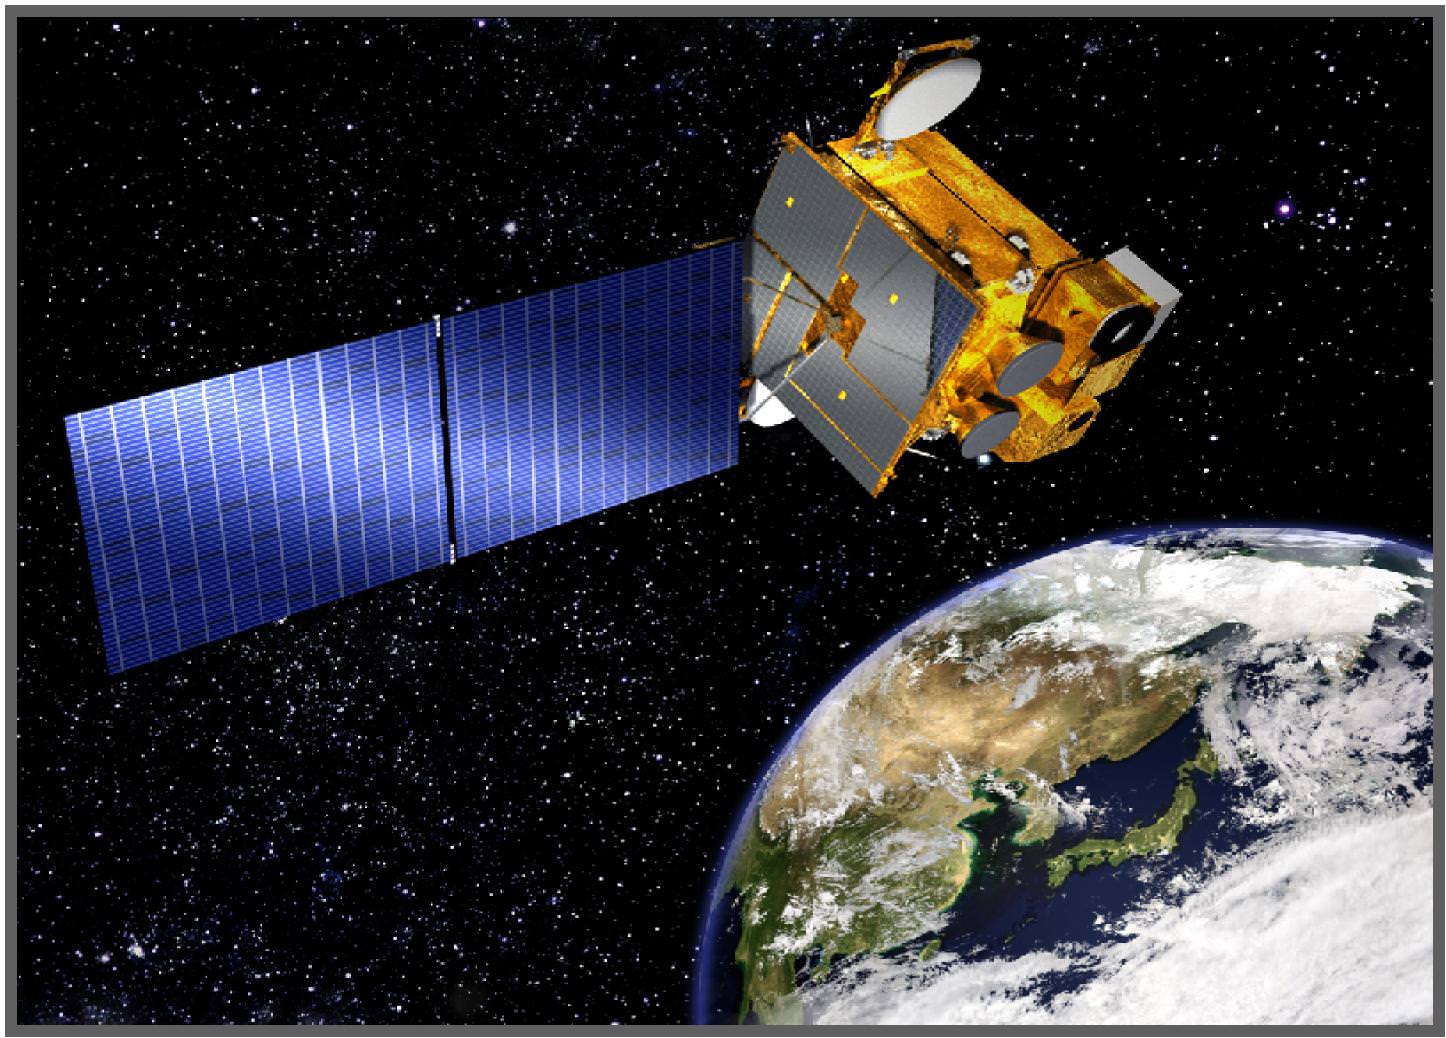
GPM is a next-generation satellite that will provide global, near real time observations of rain and snow from space and thereby open a new revolutionary era in global weather observing and climate science. Therefore it will have a direct impact on society and people’s daily lives worldwide.

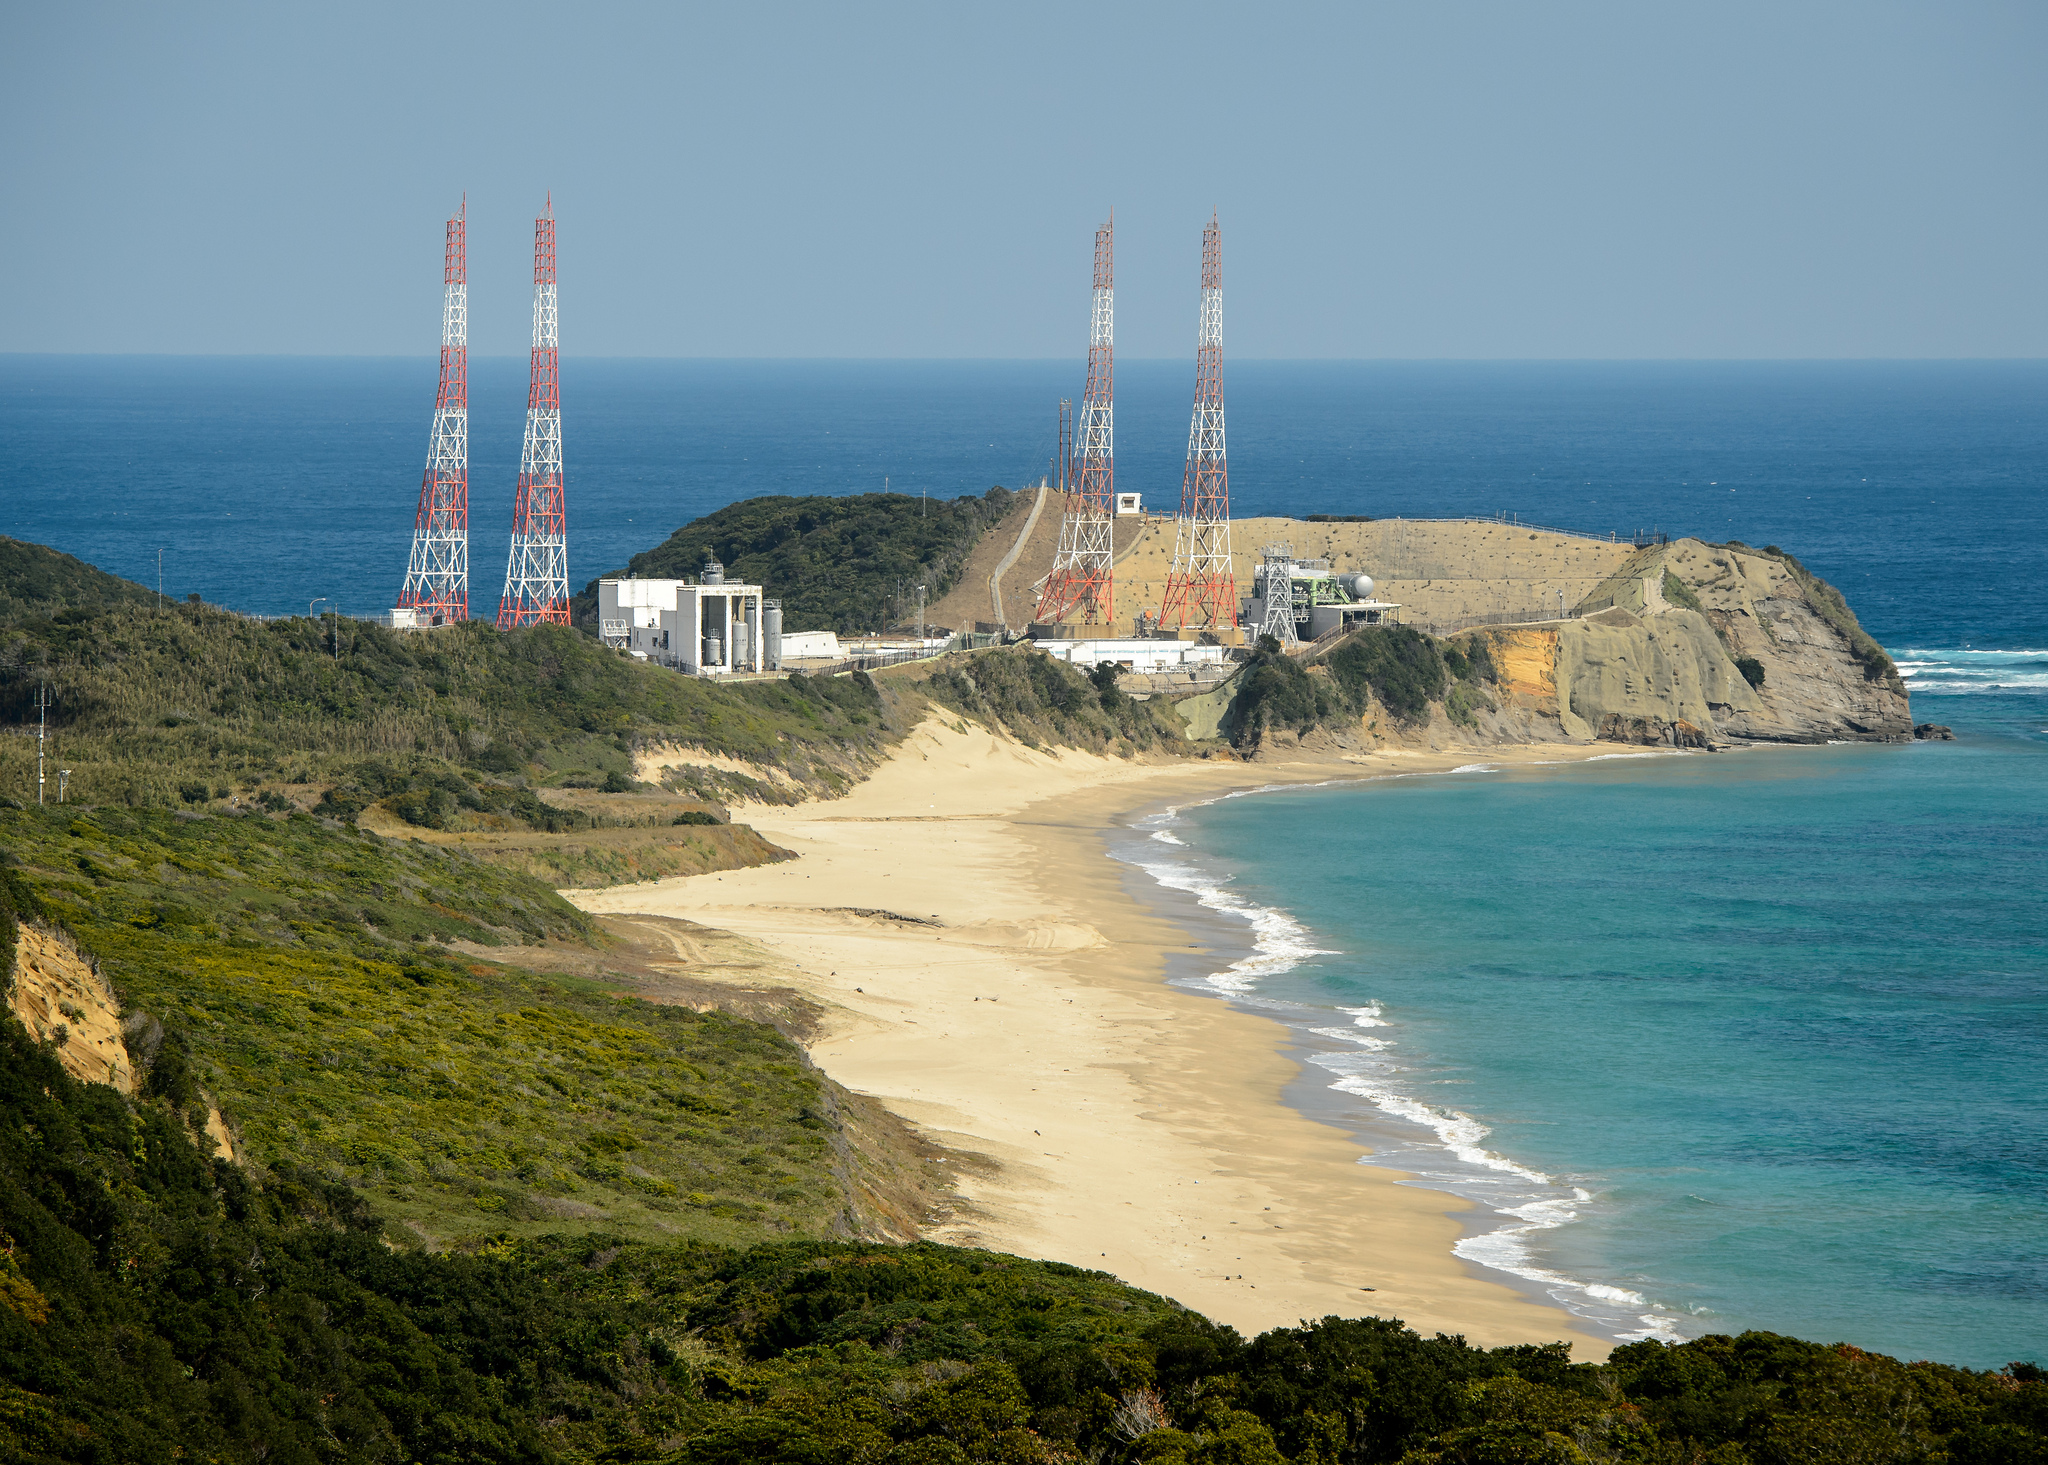
The team is counting down to liftoff in less than 5 days, on Feb. 27 at 1:07 PM EST from the Tanegashima Space Center, on Tanegashima Island off southern Japan, atop the highly reliable Mitsubishi Heavy Industries H-IIA rocket.

The GPM launch to low Earth orbit was delayed by both natural and manmade disasters – namely the 2011 Fukushima earthquake in Japan as well as the ridiculous US government shutdown in Oct. 2013. That’s the same foolish shutdown that also delayed NASA’s new MAVEN Mars orbiter and numerous other US space & science projects.

Visualization of the GPM Core Observatory satellite orbiting the planet earth.  Credit: NASA Goddard
Visualization of the GPM Core Observatory satellite orbiting the planet earth. Credit: NASA Goddard

The $933 Million mission is a joint venture between NASA and the Japan Aerospace Exploration Agency (JAXA), Japan’s space agency.

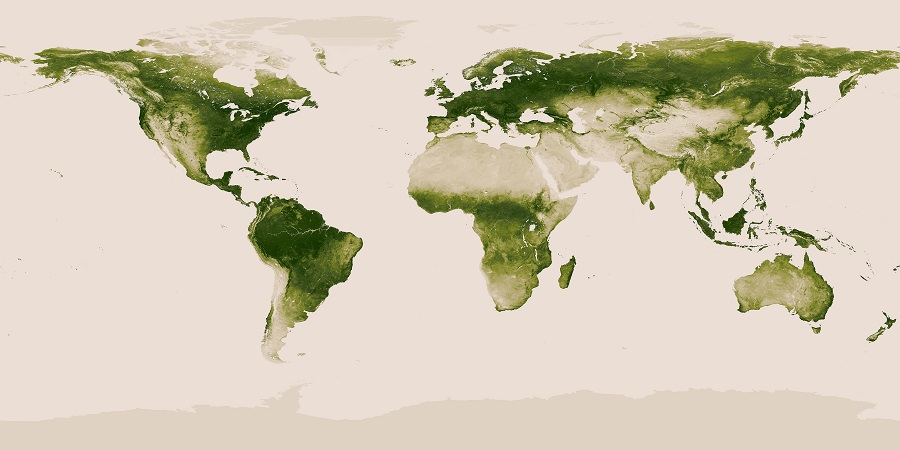
The mission will significantly advance our understanding of Earth’s water and energy cycles and improve forecasting of extreme weather events.

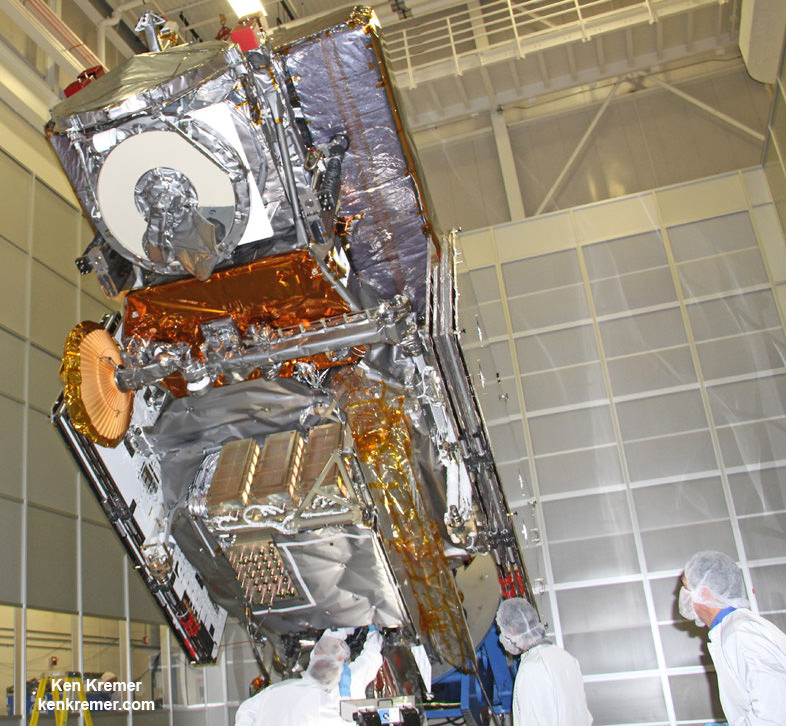
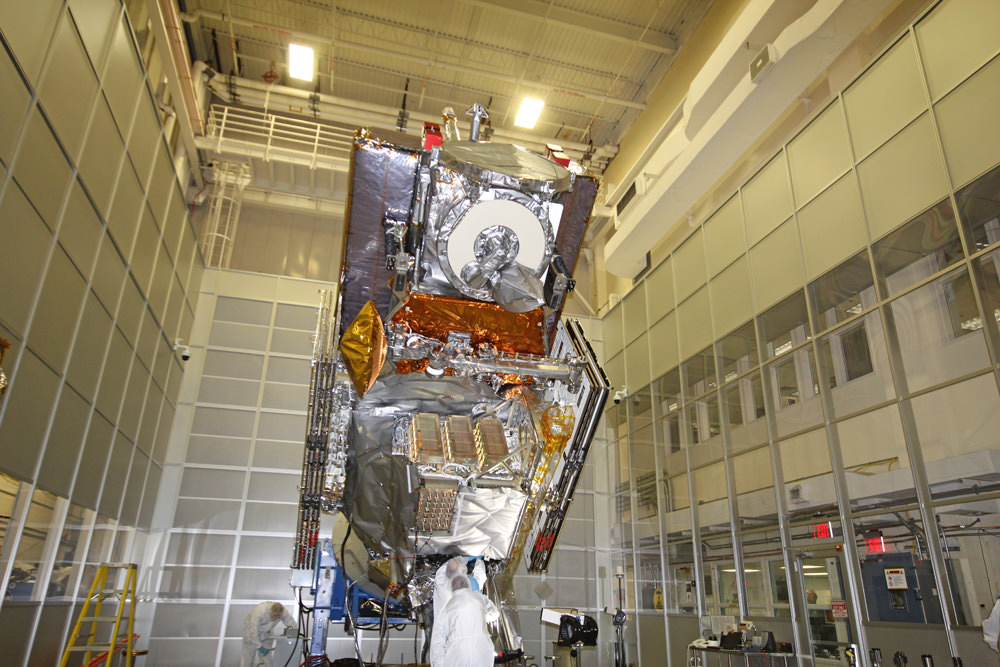
It is equipped with an advanced, higher resolution dual -frequency precipitation (DPR) radar instrument (Ku and Ka band) built by JAXA in Japan and the GPM microwave imager (GMI) built by Ball Aerospace in the US.

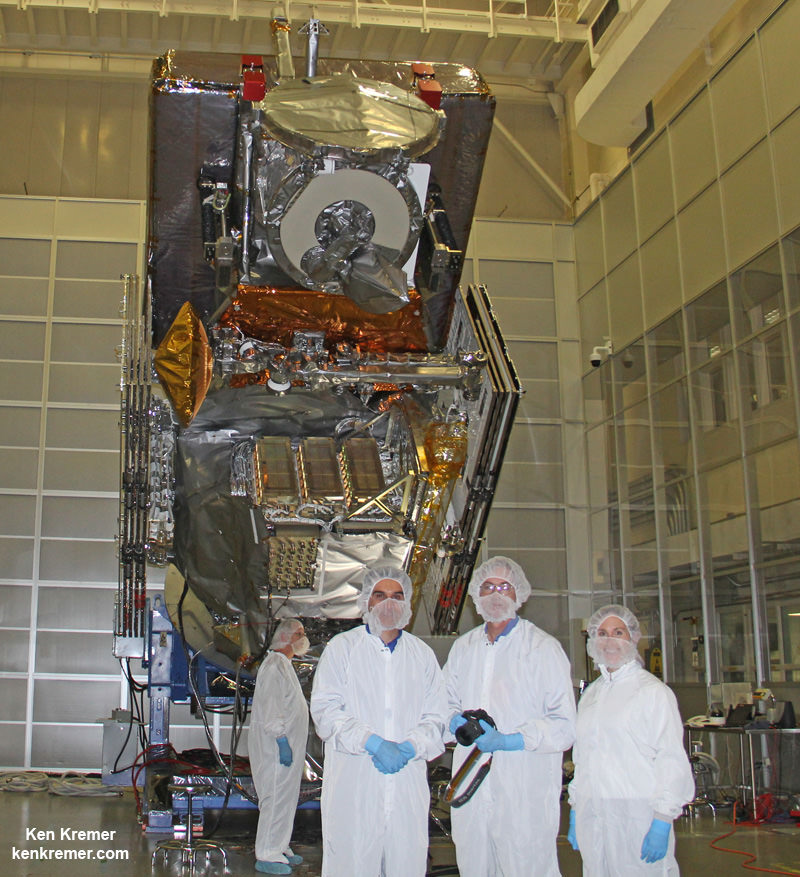
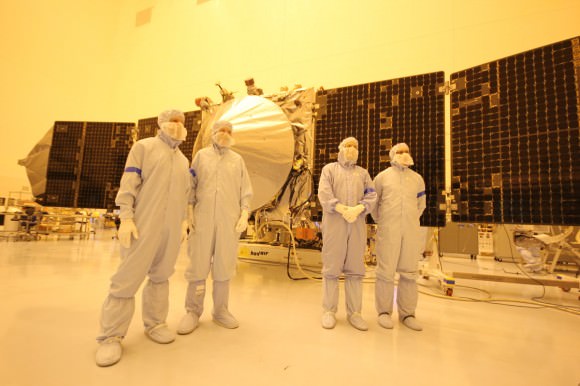
“The GPM satellite was built in house at NASA’s Goddard Space Flight Center in Maryland,” Art Azarbarzin, GPM project manager, told Universe Today during my exclusive up-close clean room inspection tour of the huge satellite as final processing was underway.

Global Precipitation Management Measurement (GPM) observatory satellite inside the clean room at NASA Goddard Space Flight Center undergoes final processing - side view. Credit: Ken Kremer/kenkremer.com
Global Precipitation Measurement (GPM) observatory satellite inside the clean room at NASA Goddard Space Flight Center undergoes final processing – side view. Credit: Ken Kremer/kenkremer.com

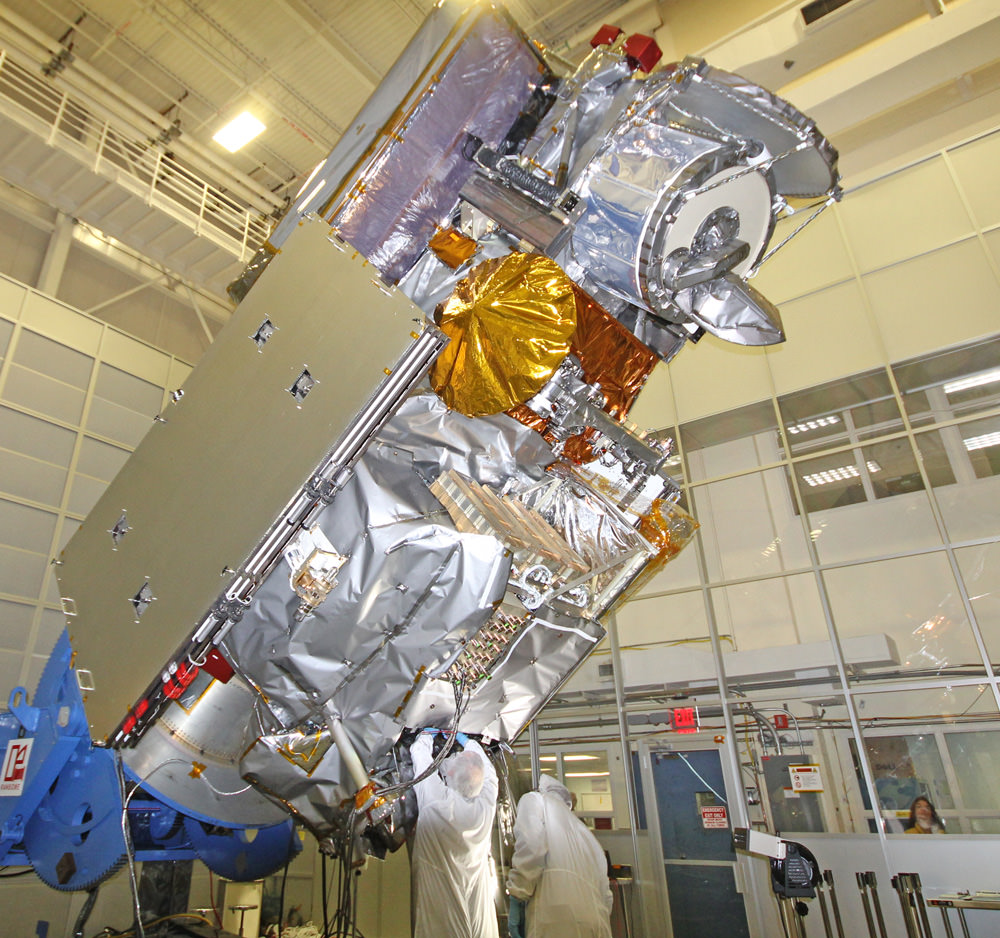
Shortly after my tour of GPM, the 3850 kilogram satellite was carefully packed up for shipment to the Japanese launch site.

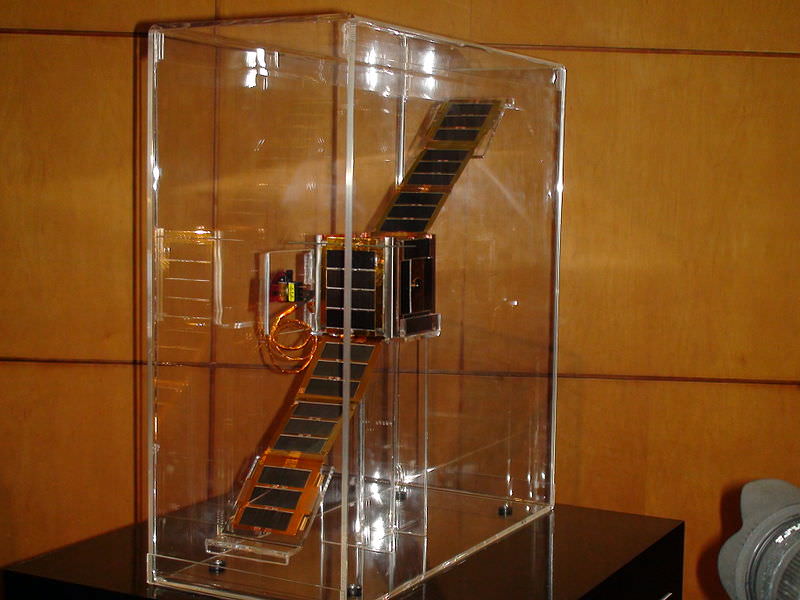
“GPM will join a worldwide constellation of current and planned satellites,” Azarbarzin told me during an interview in the Goddard cleanroom with GPM.

gpm-decal-smallAnd the imminent launch to augment the existing satellite constellation can’t come soon enough, he noted.

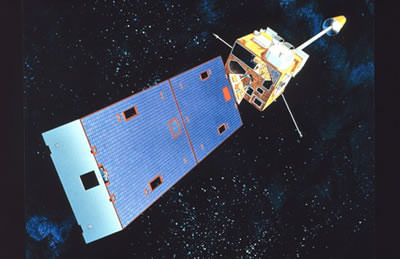
The GPM observatory will replace the aging NASA/JAXA Tropical Rainfall Measuring Mission (TRMM), satellite launched back in 1997.

“GPM is the direct follow-up to the currently orbiting TRMM satellite,” Azarbarzin explained.

“TRMM is reaching the end of its usable lifetime. GPM launches on February 27, 2014 and we hope it has some overlap with observations from TRMM.”

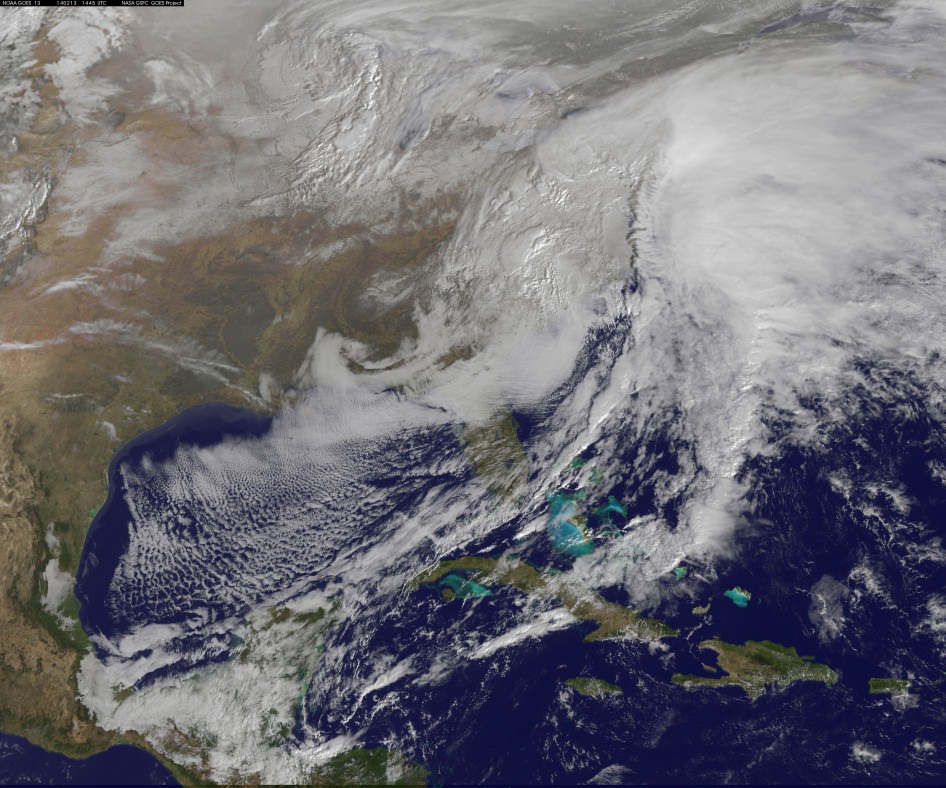
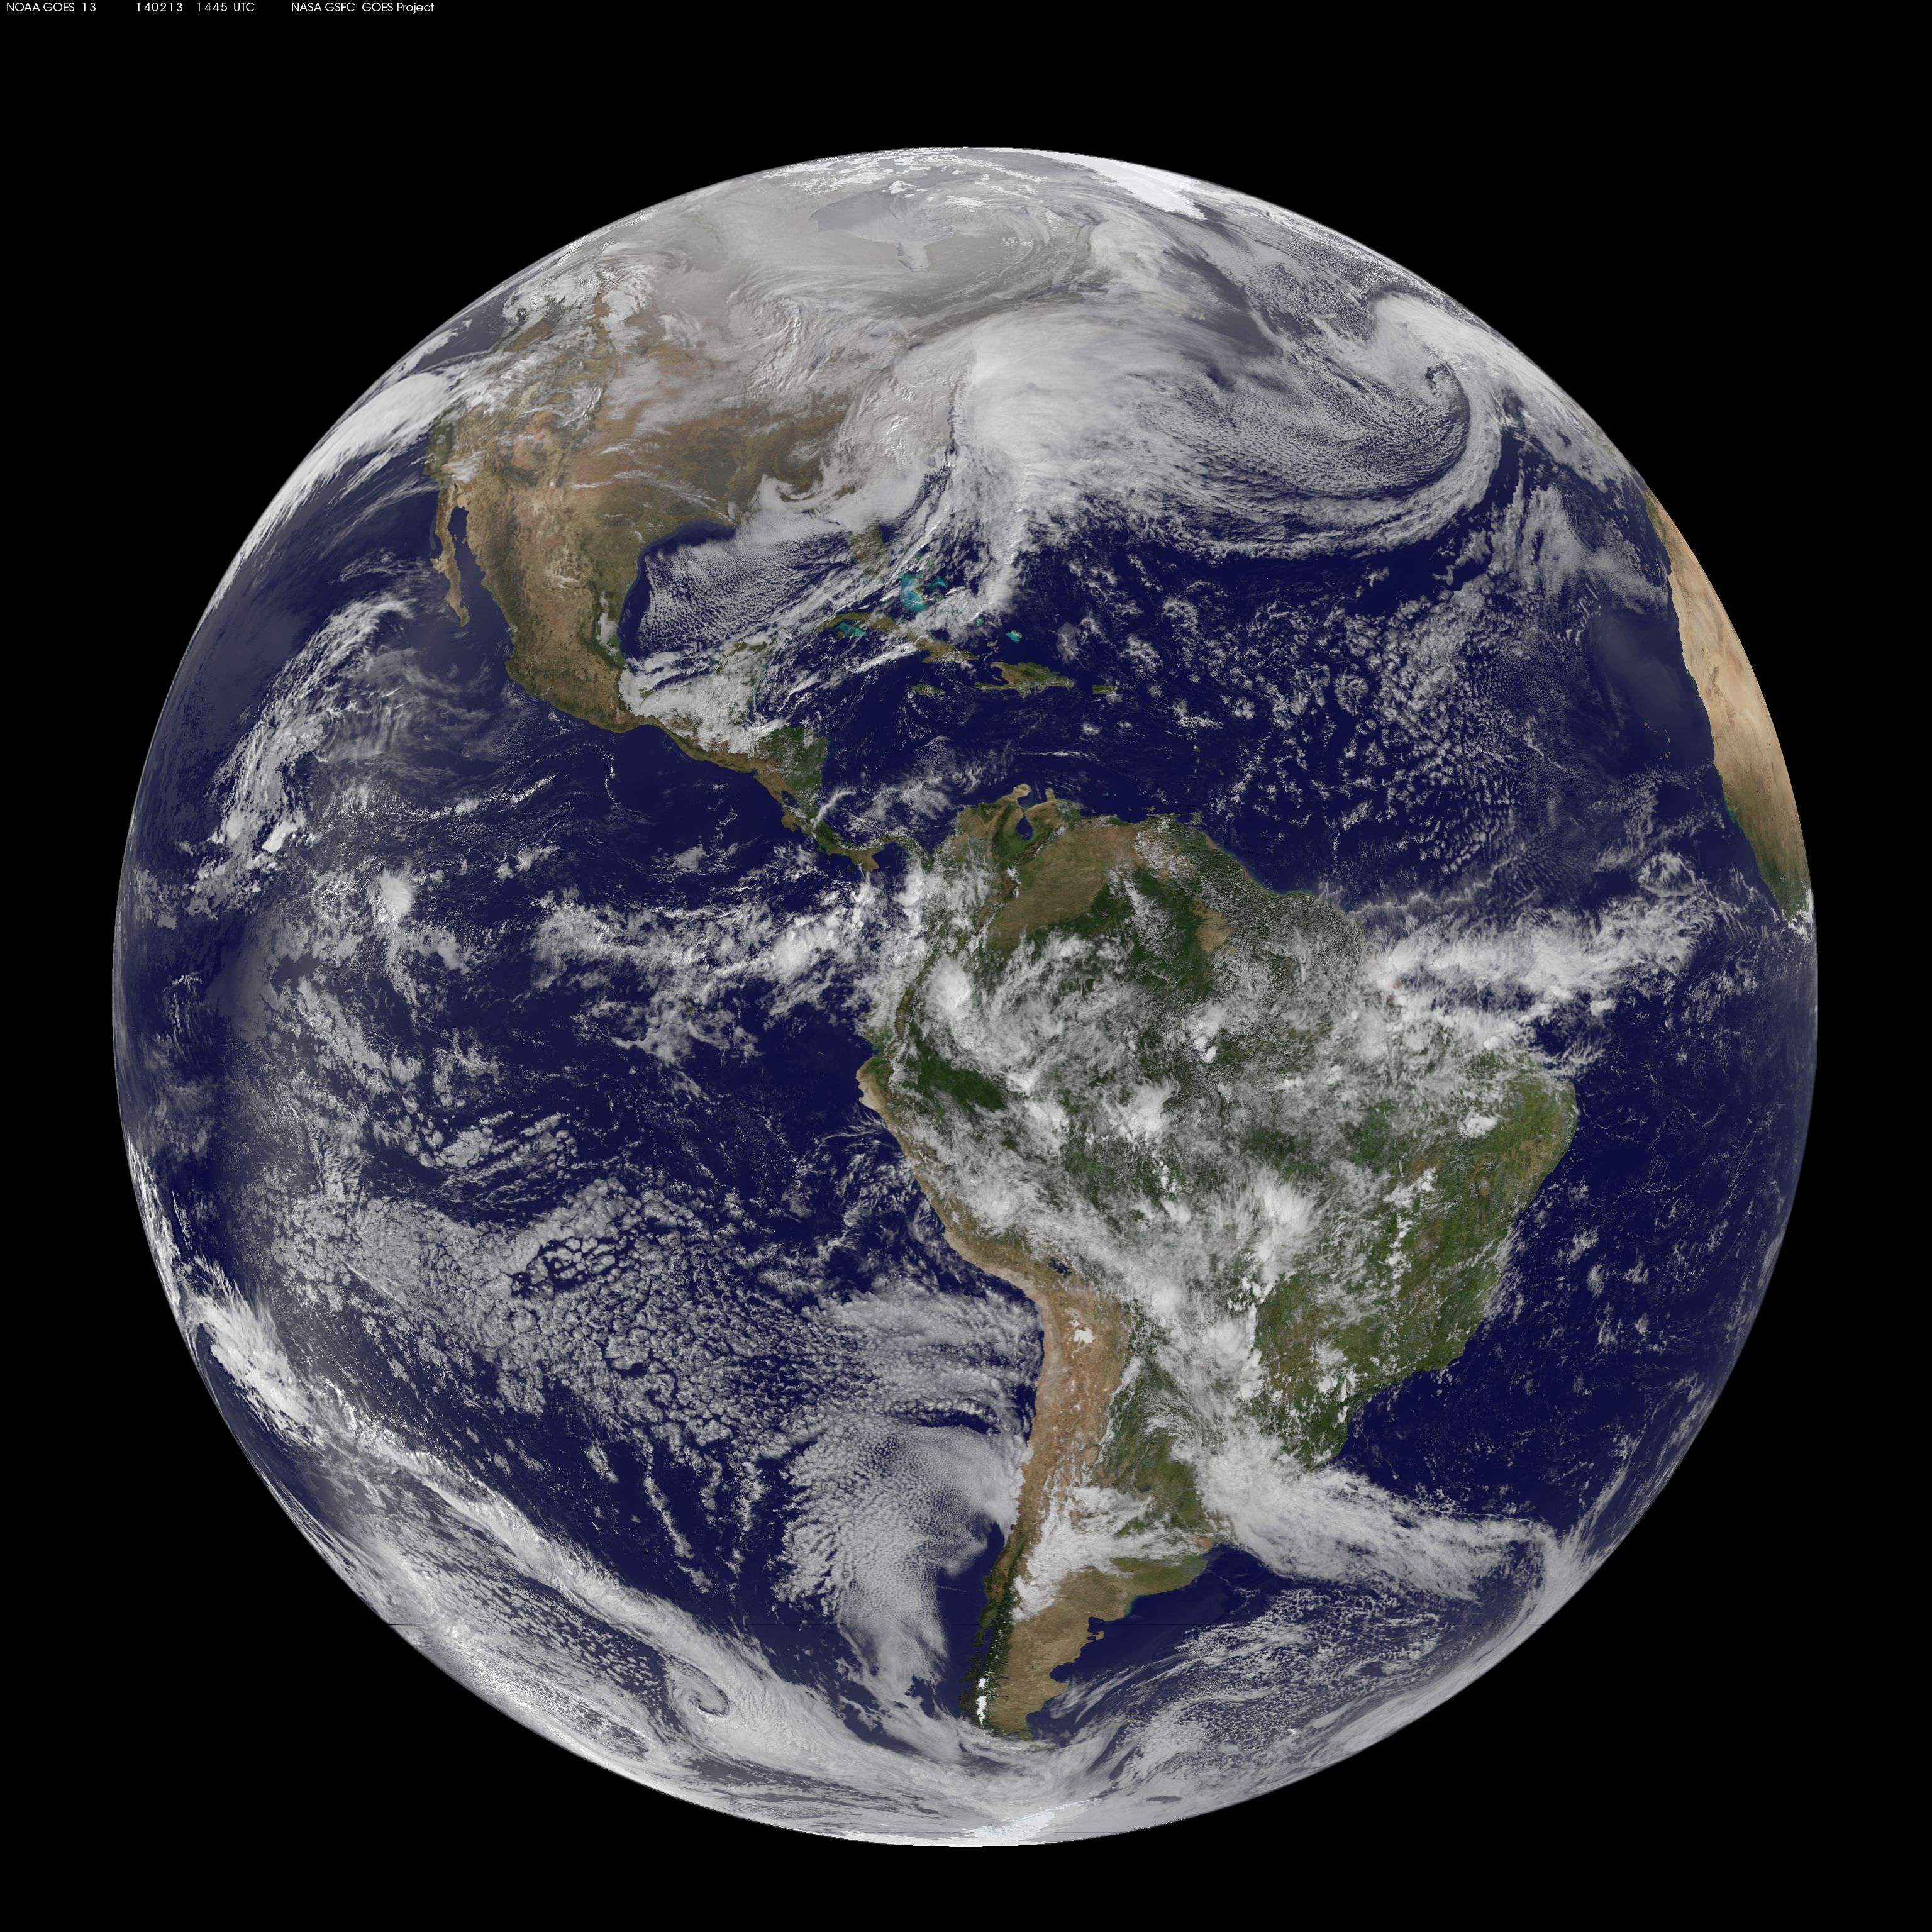
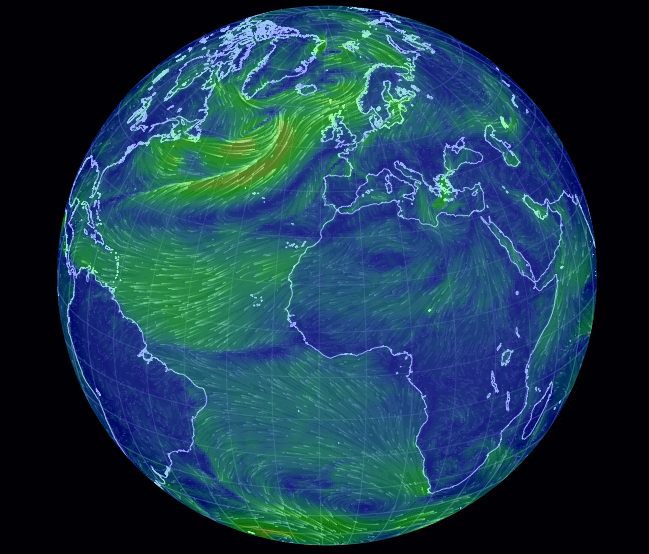
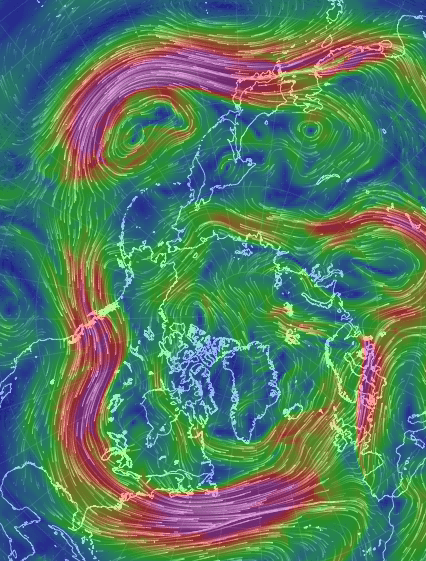
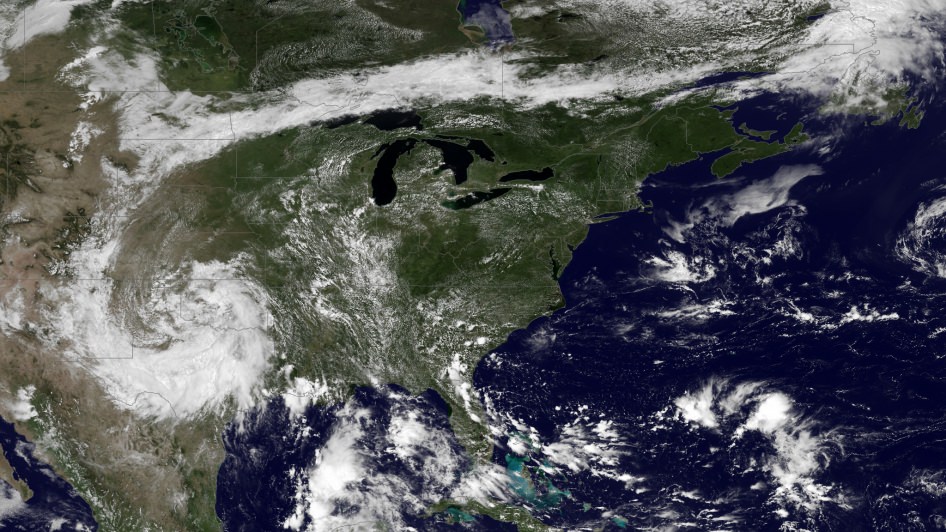
“The Global Precipitation Measurement (GPM) observatory will provide high resolution global measurements of rain and snow every 3 hours,” Dalia Kirschbaum, GPM research scientist, told me during an interview at Goddard.

NASA’s next generation Global Precipitation Measurement (GPM) observatory inside the clean room at NASA Goddard Space Flight Center, MD. Technicians at work on final processing during exclusive up-close inspection tour by Universe Today.  GPM is slated to launch on February 27, 2014 and will provide global measurements of rain and snow every 3 hours. Credit: Ken Kremer/kenkremer.com
NASA’s next generation Global Precipitation Measurement (GPM) observatory inside the clean room at NASA Goddard Space Flight Center, MD. Technicians at work on final processing during exclusive up-close inspection tour by Universe Today. GPM is slated to launch on February 27, 2014 and will provide global measurements of rain and snow every 3 hours. Credit: Ken Kremer/kenkremer.com

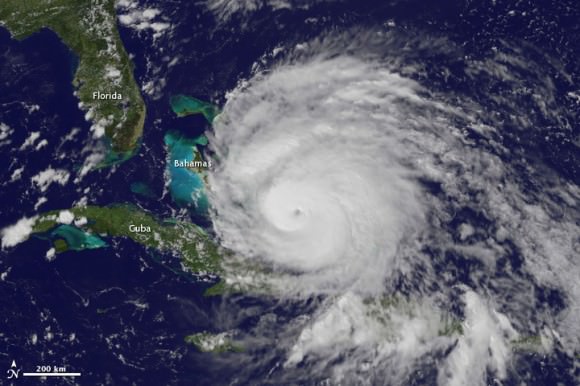
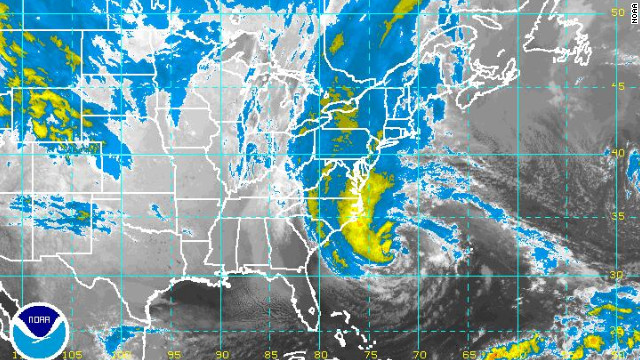
It is vital to continuing the TRMM measurements and will help provide improved forecasts and advance warning of extreme super storms like Hurricane Sandy and Super Typhoon Haiyan, Azarbarzin and Kirschbaum explained.

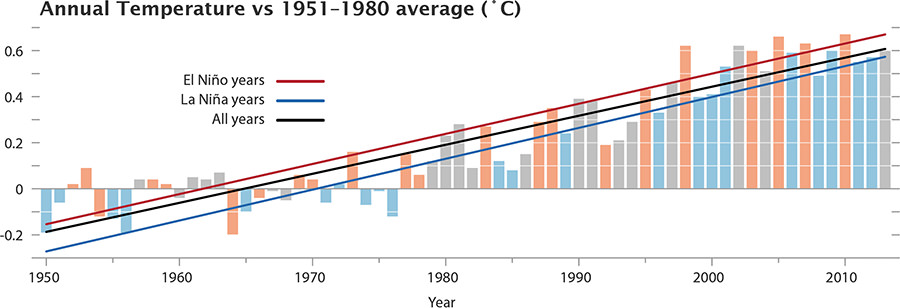
Researchers will use the GPM measurements to study climate change, freshwater resources, floods and droughts, and hurricane formation and tracking.

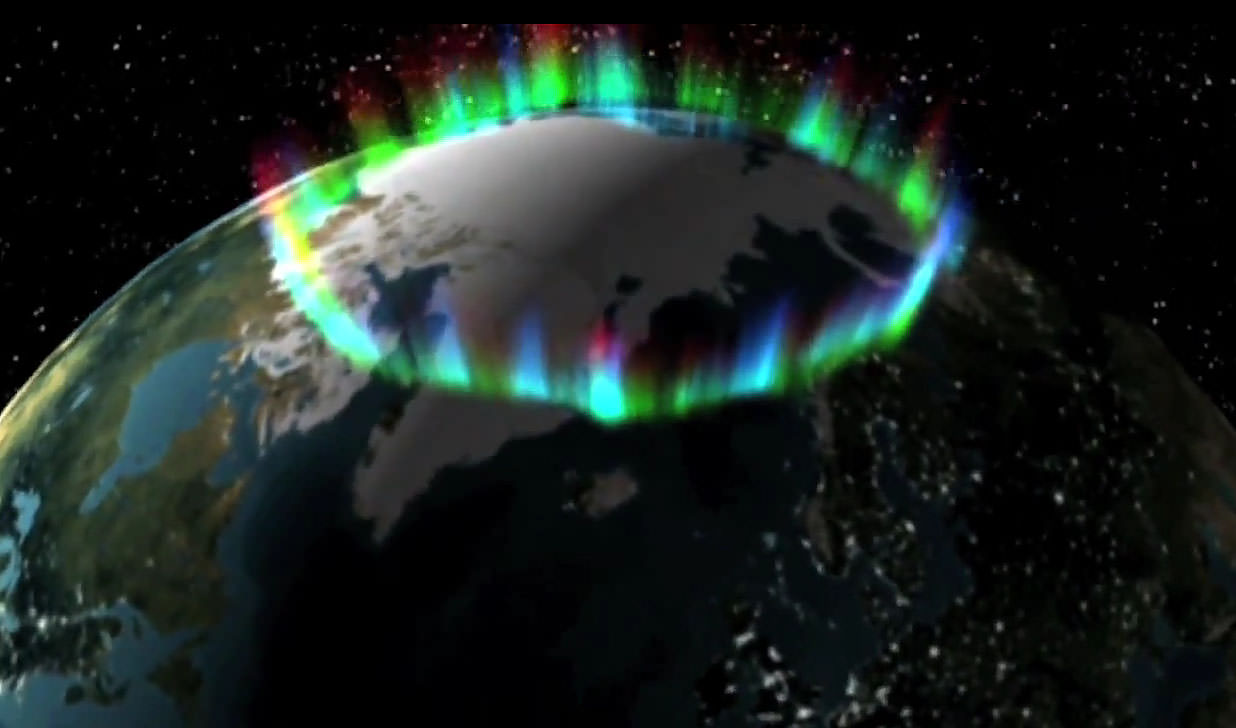
“The water-cycle, so familiar to all school-age young scientists, is one of the most interesting, dynamic, and important elements in our studies of the Earth’s weather and climate,” said John Grunsfeld, associate administrator for NASA’s Science Mission Directorate in Washington, in a statement.

“GPM will provide scientists and forecasters critical information to help us understand and cope with future extreme weather events and fresh water resources.”

Tanegashima Space Center, on Tanegashima Island off southern Japan
GPM satellite launch site at Tanegashima Space Center, Tanegashima Island, Japan. Credit: NASA

NASA TV will carry the launch live with commentary starting at 12 Noon EST on Feb. 27.

Stay tuned here for Ken’s continuing GPM reports and onsite coverage at NASA Goddard Space Flight Center in Maryland.

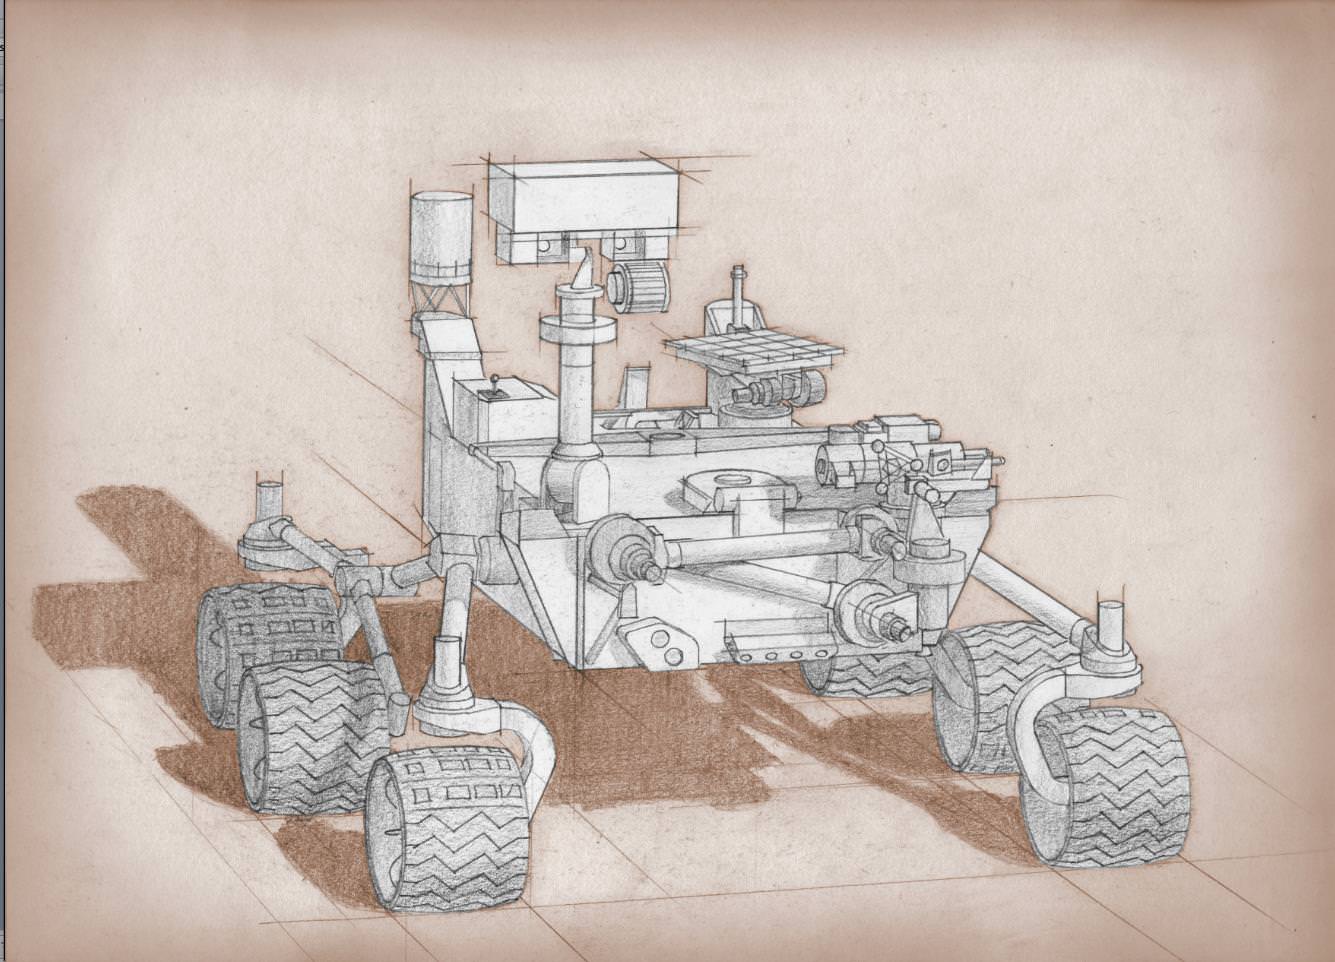
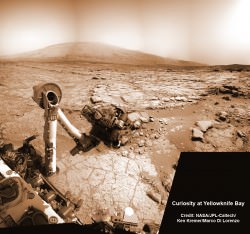
And watch for Ken’s continuing planetary and human spaceflight news about Curiosity, Opportunity, Chang’e-3, SpaceX, Orbital Sciences, LADEE, MAVEN, MOM, Mars, Orion and more.

Ken Kremer

NASA/JAXA Global Precipitation Measurement (GPM) satellite inside the clean room at NASA Goddard Space Flight Center, MD, undergoes final processing during exclusive up-close inspection tour by Universe Today:   Dr. Art Azarbarzin/NASA GPM project manager, Dr. Ken Kremer/Universe Today and Dr. Dalia Kirschbaum/NASA GPM research scientist.    Credit: Ken Kremer/kenkremer.com
NASA/JAXA Global Precipitation Measurement (GPM) satellite inside the clean room at NASA Goddard Space Flight Center, MD, undergoes final processing during exclusive up-close inspection tour by Universe Today: Dr. Art Azarbarzin/NASA GPM project manager, Dr. Ken Kremer/Universe Today and Dr. Dalia Kirschbaum/NASA GPM research scientist. Credit: Ken Kremer/kenkremer.com

Deadly Monster Winter Storm Batters US Eastern Seaboard – More Snow and Ice on the Way!

This visible image of the winter storm over the U.S. south and East Coast was taken by NOAA's GOES-13 satellite on Feb. 13 at 1455 UTC/9:45 a.m. EST. Snow covered ground can be seen over the Great Lakes region and Ohio Valley. Image Credit: NASA/NOAA GOES Project

This visible image of the winter storm over the U.S. south and East Coast was taken by NOAA’s GOES-13 satellite on Feb. 13 at 1455 UTC/9:45 a.m. EST. Snow covered ground can be seen over the Great Lakes region and Ohio Valley. Image Credit: NASA/NOAA GOES Project
Story updated[/caption]

A deadly monster storm is battering virtually the entire US Eastern seaboard today, Thursday, Feb. 13, as it moves from the Southeast to the Northeast and into the New England states, wreaking havoc and causing miserable weather conditions for over 100 million Americas.

This afternoon, NASA and NOAA published a new image taken by a GOES satellite that showed the extent of the clouds associated with the massive winter storm over the US East Coast – see above and below.

Blizzard, white out and slippery conditions have already caused more than 18 deaths.

The killer storm has brought relentless waves of snow, sleet and ice over the past two days covering a vast swath stretching from inland to coastal areas as it moved up from the southern to northern states.

More than a foot of snow has already fallen in many areas today stretching from the Mid-Atlantic into the entire Northeast region.

Several states have declared states of emergency.

This is the season’s 12th snow storm. In many Northeast localities, the accumulated snowfall totals are three times the normal average. As a result many municipalities are running out of road salt.

And to add insult to injury, much more icy snow is falling overnight into Friday on top of the massive existing mounds and piles of frozen ice and snow that’s accumulated over the past few weeks of subfreezing temperatures.

There are also predictions for patches of “thunder snow” — which is a snow storm mixed with thunder and lightning!

Full disk image of the winter storm over the U.S. south and East Coast was taken by NOAA's GOES-13 satellite on Feb. 13 at 1455 UTC/9:45 a.m. EST. Credit:  NASA/NOAA GOES Project
Full disk image of the winter storm over the U.S. south and East Coast was taken by NOAA’s GOES-13 satellite on Feb. 13 at 1455 UTC/9:45 a.m. EST. Credit: NASA/NOAA GOES Project

Incredibly, another round of snow is forecast for Saturday.

Much of the I-95 corridor where I also live has been especially hard hit.

The image above was created from data captured by NOAA’s GOES-East satellite today, Feb. 13 at 1455 UTC/9:45 a.m. EST by a team from the NASA/NOAA’s GOES Project at NASA’s Goddard Space Flight Center in Greenbelt, Md.

“The clouds and fallen snow data from NOAA’s GOES-East satellite were overlaid on a true-color image of land and ocean created by data from the Moderate Resolution Imaging Spectroradiometer or MODIS instrument that flies aboard NASA’s Aqua and Terra satellites,” said NASA in a statement.

An eight months pregnant 36 year old women was tragically killed in New York City accident today by a snowplow. Thank God the unborn baby was saved and delivered by cesarean section.

The storm has caused thousands of traffic accidents and several deaths.

Video Caption: This animation of NOAA’s GOES satellite data shows the progression of the major winter storm in the U.S. south from Feb. 10 at 1815 UTC/1:15 p.m. EST to Feb. 12 to 1845 UTC/1:45 p.m. EST. Credit: NASA/NOAA GOES Project, Dennis Chesters

Hundreds of thousands of customers have lost power due to fallen tree limbs on exposed power lines, mostly in the southeast. In recent days, hundreds of thousands of us here in the Northeast lost power after a severe ice storm.

Mountains of snow inundate the Northeast. Credit: Mark Usciak

Most of those affected were left with no heat in subfreezing temperatures. It’s definitely no fun when you can see you exhaled breath – indoors.

Many school districts were closed today. But not in NYC where the new Mayor Bill DeBlasio kept schools open, and faced a hail of criticism – including from NBC News weatherman Al Roker.

Over 6500 airplane flights have been cancelled, stranding over a half million people.

So after days of shoveling, even more is on tap for the morning. Be careful, pace yourself and don’t overdo it – as several people died from heart attacks digging out the heavy slushy mess


Here is this evenings forecast (Feb 13) from the National Weather Service (NWS):

STORM SUMMARY NUMBER 09 FOR SOUTHERN PLAINS TO EAST COAST WINTER STORM
NWS WEATHER PREDICTION CENTER COLLEGE PARK MD – – 1000 PM EST THU FEB 13 2014

…LOW PRESSURE CENTER HAS MOVED OFF THE NEW JERSEY COAST AND IS
RAPIDLY INTENSIFYING…HEAVY SNOW BANDS IMPACTING INTERIOR
NORTHEAST AND I 95 CORRIDOR…WINDS INCREASING ACROSS THE AFFECTED
REGION…

WINTER STORM WARNINGS AND WINTER WEATHER ADVISORIES ARE IN EFFECT
FOR THE NORTHERN MID ATLANTIC AND NORTHEAST….

FOR A DETAILED GRAPHICAL DEPICTION OF THE LATEST
WATCHES…WARNINGS AND ADVISORIES…PLEASE SEE WWW.WEATHER.GOV

AT 900 PM EST…THE MAIN CENTER OF A RAPIDLY INTENSIFYING LOW
PRESSURE SYSTEM WITH ESTIMATED CENTRAL PRESSURE OF 986 MB…29.12
INCHES…WAS LOCATED JUST EAST OF THE SOUTHERN NEW JERSEY COAST.
NATIONAL WEATHER SERVICE DOPPLER RADAR AND SURFACE OBSERVATIONS
INDICATED THAT OVER THE PAST FEW HOURS…A BAND OF HEAVY SNOW WAS
IMPACTING CENTRAL PENNSYLVANIA ACROSS NORTHERN NEW ENGLAND TO
NORTHERN MAINE. MEANWHILE…ANOTHER BAND OF MODERATE TO HEAVY
SNOW WAS LOCATED ALONG THE I 95 CORRIDOR FROM WASHINGTON DC TO NEW YORK CITY. EAST OF I 95 THE PRECIPITATION TYPE IS MAINLY RAIN…BUT A CHANGEOVER BACK TO SNOW IS EXPECTED.

Stay tuned here for Ken’s continuing planetary and human spaceflight news.

Ken Kremer

Recent ice and snow storms caused hundreds of thousands to lose power and heat in the Northeast. Credit: Ken Kremer
Recent ice and snow storms caused hundreds of thousands to lose power and heat in the Northeast in subfreezing temperatures. Credit: Ken Kremer
Mountains of snow inundate the Northeast. Credit: Mark Usciak

Latest Data Shows Global Climate Continues Warming Trend

Chart of the temperature anomalies for 1950-2013, also showing the phase of the El Niñ0-La Niña cycle. (Image Credit: NASA/GSFC/Earth Observatory, NASA/GISS)

The latest statistics are in from 2013 and both NASA’s and NOAA’s measurements of global temperatures show Earth continued to experience temperatures warmer than those measured several decades ago.

NASA scientists say 2013 tied with 2009 and 2006 for the seventh warmest year since 1880, continuing a long-term trend of rising global temperatures, while NOAA – which uses a different method of analyzing temperature data – said that 2013 tied with 2003 as 4th-warmest year globally since 1880.

“The long-term trends are very clear, and they’re not going to disappear,” said climatologist Gavin Schmidt from NASA’s Goddard Institute for Space Studies (GISS). “It isn’t an error in our calculations.”

Land and ocean global temperatures in 2013 from both NASA and NOAA. Via NASA.

NASA data shows that since 1950, average temperatures have increased 1.1°F to an average of 58.3° in 2013.

NOAA data shows the average temperature across global land and ocean surfaces was 1.12 degrees above the 20th-century average. This is the 37th consecutive year that the annual temperature was above the long-term average.

This coincides with another recent study that showed the so-called “pause” in global warming is not happening, and that the temperatures over the past 15 years are still on the rise.

Both NASA and NOAA scientists say the increase in greenhouse gas levels continue to drive the temperature increase.

Additionally, with the exception of 1998, the 10 warmest years in the 134-year record all have occurred since 2000, with 2010 and 2005 ranking as the warmest years on record.

NASA says the average temperature in 2013 was 58.3 degrees Fahrenheit (14.6 Celsius), which is 1.1 F (0.6 C) warmer than the mid-20th century baseline. The average global temperature has risen about 1.4 degrees F (0.8 C) since 1880, according to the new analysis. Exact rankings for individual years are sensitive to data inputs and analysis methods.

“Long-term trends in surface temperatures are unusual and 2013 adds to the evidence for ongoing climate change,” GISS climatologist Gavin Schmidt said. “While one year or one season can be affected by random weather events, this analysis shows the necessity for continued, long-term monitoring.”

Scientists emphasize that weather patterns always will cause fluctuations in average temperatures from year to year, but the continued increases in greenhouse gas levels in Earth’s atmosphere are driving a long-term rise in global temperatures. Each successive year will not necessarily be warmer than the year before, but with the current level of greenhouse gas emissions, scientists expect each successive decade to be warmer than the previous.

More from NASA:

Carbon dioxide is a greenhouse gas that traps heat and plays a major role in controlling changes to Earth’s climate. It occurs naturally and also is emitted by the burning of fossil fuels for energy. Driven by increasing man-made emissions, the level of carbon dioxide in Earth’s atmosphere presently is higher than at any time in the last 800,000 years.

The carbon dioxide level in the atmosphere was about 285 parts per million in 1880, the first year in the GISS temperature record. By 1960, the atmospheric carbon dioxide concentration, measured at the National Oceanic and Atmospheric Administration’s (NOAA) Mauna Loa Observatory in Hawaii, was about 315 parts per million. This measurement peaked last year at more than 400 parts per million.

While the world experienced relatively warm temperatures in 2013, the continental United States experienced the 42nd warmest year on record, according to GISS analysis. For some other countries, such as Australia, 2013 was the hottest year on record.

The temperature analysis produced at GISS is compiled from weather data from more than 1,000 meteorological stations around the world, satellite observations of sea-surface temperature, and Antarctic research station measurements, taking into account station history and urban heat island effects. Software is used to calculate the difference between surface temperature in a given month and the average temperature for the same place from 1951 to 1980. This three-decade period functions as a baseline for the analysis. It has been 38 years since the recording of a year of cooler than average temperatures.

The GISS temperature record is one of several global temperature analyses, along with those produced by the Met Office Hadley Centre in the United Kingdom and NOAA’s National Climatic Data Center in Asheville, N.C. These three primary records use slightly different methods, but overall, their trends show close agreement.

You can read NASA’s press release here, and NOAA’s here. Here is a link to a presentation of the data released today from Gavin Schmidt of NASA and Tom Karl, director of NOAA’s Climatic Data Center.

Editor’s note: First quote from Gavin Schmidt is from Jacob Ward on Twitter.

When Science is Art: a New Map of Wind Patterns

Blah.

A new map of wind patterns is so visually stunning it’s easily mistaken for art.

This interactive visualization of wind patterns — modeled from the U.S. National Weather Service’s Global Forecast System database — provides nearly current weather conditions on the global scale. And it’s beautiful.

In an interactive form, this data set allows the user to move the globe around (simply drag with your mouse) and zoom in and out (use your scroll wheel). After a few seconds the colors appear in snaking lines, depicting wind patterns at varying speeds. Gentle breezes are thin lines of green, strong winds are light streaks of yellow, and the strongest current are thick lines of red and purple.

A screenshot of the Earth's north pole at 5,500 meters.
A screen capture of the Earth’s north pole at 5,500 meters. The thick purple line is the polar jet stream.

Adjustable parameters also allow the user to view the wind patterns at various heights in the atmosphere, from 100 meters (noted as 1000 hPa in the program) to 26,500 meters (10 hPa) above the Earth’s surface. Simply click on the word “earth” in the lower left-hand corner of the web browser.

At the surface the map is a mirage of blue and green — with fairly gentle wind patterns in green. Circling patterns over the oceans are cyclones. They rotate clockwise over the southern Indian ocean and counter-clockwise over the northern Pacific ocean. If you turn your eyes toward land, you can compare the light summer winds across Australia with the swirling gusts off the northeast coast of Japan.

But you can also graze the jet streams, where thick bands of purple and red dance among the less violent green and yellow streaks. The wavy polar jet stream is entering the U.S. near Seattle, dropping southward near the Rocky Mountains, and then turning northward again just beyond the Great Lakes.  It creates a temperature boundary, where south of the jet stream is warm and north of the jet stream is cold.

Users can view seven different altitudes using eight different map projections. This surprising new look at our own world is stunning in its artistic and educative beauty.

Could The U.S. Government Shutdown Hammer Earth and Mars Missions?

Artist's conception of the Mars 2020 rover. Credit: NASA

As Day 2 of the United States government shutdown continues, some short-term effects are already in evidence when it comes to Earth and space.

Most of the NASA and National Oceanic and Atmospheric Administration (NOAA) websites are offline. Social media updates are silent. At NASA, 97% of agency employees are off work and media reports indicate that 55% of NOAA’s employees are furloughed.

If the shutdown lasts for very long, however, long-term programs could feel the pain. This includes a couple of Mars missions NASA is developing, as well as Earth-based climate research and satellite observation from NOAA.

Mars 2020

A twin rover to Mars Curiosity, called Mars 2020 for now, is expected to leave for the Red Planet in 2020 and do investigations into past life and habitability. Planning is still in the early stages, but an announcement of opportunity for science investigators was supposed to happen on Oct. 8. Notices of intent were due Oct. 15.

“The preproposal conference, scheduled for 10/8, may be rescheduled and the due date for NOIs (currently 10/15) could be delayed, if the government is still shut down closer to those dates,” NASA officials wrote in an update before the shutdown on Monday.

MAVEN team members, including chief scientist Bruce Jakosky (2nd from left)  pose with spacecraft inside the cleanroom at the Kennedy Space Center on Sept. 27, 2013. Credit: Ken Kremer/kenkremer.com
MAVEN team members, including chief scientist Bruce Jakosky (2nd from left) pose with spacecraft inside the cleanroom at the Kennedy Space Center on Sept. 27, 2013. Credit: Ken Kremer/kenkremer.com

MAVEN

As widely reported yesterday, the next Mars orbiter from NASA is expected to lift off from Earth on Nov. 18. Now, however, preparatory work has ceased and there is some concern from team members that it will miss the launch window, which extends into December. At worst, this means MAVEN’s launch could be delayed until 2016, when the next opportunity opens.

“The hardware is being safed, meaning that it will be put into a known, stable, and safe state,” Bruce Jakosky, MAVEN’s principal investigator, told Universe Today‘s Ken Kremer yesterday. “We’ll turn back on when told that we can. We have some margin days built into our schedule.”

NOAA

As with NASA, NOAA is keeping up with mission-critical activities — which in their case, includes weather forecasting. Long-term climate research, however, is reportedly being shelved.

“For example, Harold Brooks, a top tornado researcher who works at the National Severe Storms Laboratory in Norman, Okla., reported his furlough notice on Facebook on Tuesday,” Climate Central wrote on Oct. 1. “Much of the staff at NOAA’s Earth Systems Research Lab and the Geophysical Fluid Dynamics Laboratory, except for positions related to maintaining computing resources, have also been furloughed. Those two labs are heavily involved in NOAA’s climate research programs.”

A view of Hurricane Irene taken by the GOES satellite at 2:55 p.m. Eastern Daylight Time on August 24, 2011. Credit: NASA

Observers are also worried that a lengthy shutdown could push back the time when new weather satellites become available. There have been multiple reports about a “weather satellite gap” coming in the United States as many of NOAA’s geostationary and polar-orbiting satellites are nearing the end of their expected lives. The Subcommittees on Oversight and Environment held hearings into this issue in September.

What’s still online?

These are some of the programs that are still happening at NASA and NOAA:

NASA’s Curiosity rover reaches out in ‘handshake’ like gesture with dramatic scenery of Mount Sharp in the background. This mosaic of images was snapped by Curiosity on Sol 262 (May 2, 2013) and shows her flexing the robotic arm. Two drill holes are visible on the surface bedrock below the robotic arm’s turret. Credit: NASA/JPL-Caltech/Ken Kremer-(kenkremer.com)/Marco Di Lorenzo

NASA:

  • Bare-bones management on programs such as the International Space Station and several robotic missions that are already in operation (such as the Lunar Atmosphere and Dust Environment Explorer (LADEE).
  • Certain missions are in critical phases that could be hurt if work stops, such as the James Webb Space Telescope, which is undergoing cryogenic testing on some of its instruments.
  • Several missions run out of the Jet Propulsion Laboratory and Applied Physics Laboratory are still running as usual, according to the Planetary Society, as these receive contract money from NASA; this means Mars Curiosity is still working, for example.
  • The Mars Reconnaissance Orbiter’s HiRISE camera is still snapping pictures, its Twitter account reported, which is positive given that it was intended to snap shots of Comet ISON during its closest approach to Mars yesterday.
  • The decades-long Landsat Earth observation program is still operating, according to The Atlantic, with data being sent back to Earth as usual. The difference is this information won’t be packaged as usual until government operations restart.

NOAA (all information according to this Department of Commerce document):

  • The Office of Oceanic and Atmospheric Research will keep 73 employees on board “to ensure continuity of crucial long-term historical climate records, and real-time regular research to support ongoing weather and air quality prediction services,” NOAA said.
  • 184 employees will stay with the Environmental Satellite and Data Information Service for command and control of several satellites for NOAA and the Department of Defense.
  • 474 employees will remain with the National Marine Fisheries Service. 174 are funded in another form besides appropriations. The others are a mix of law enforcement, fisheries management and property protection officials.
  • 490 employees are with the Office of Marine and Aviation Operations for observational data collection related to weather forecasting.
  • 173 employees are with the National Ocean Service. 17 are funded outside of appropriations, while the 156 remaining “are required to protect against imminent and significant threats to life and property by supporting safe maritime commerce in U.S. waters, including real-time water level data for ships entering U.S. ports, critical nautical chart updates, and accurate position information,” NOAA stated. Some are also monitoring marine health aspects such as algal blooms.
  • There are 19 IT-related employees and 20 employees providing support services.
  • The large bulk of employees still at work, 3,935 people, are with the National Weather Service to keep up weather forecasting.

There’s no word yet on when government employees could go back to work. Congress representatives are jousting over the implementation of a spending bill to keep the money flowing to government departments. One big issue: whether to include the Affordable Care Act, sometimes dubbed Obamacare, in the bill.

Another deadline is looming, too. Treasury Secretary Jack Lew has warned repeatedly that on Oct. 17, if the debt ceiling is not raised, the United States government may default on some financial obligations.

Space Debris: A Tale of Two Satellites

Artist's concept of a GOES spacecraft in orbit. (Credit: NOAA.gov).

It’s sometimes tough being a satellite in Earth orbit these days.

An interesting commentary came our way recently via NASA’s Orbital Debris Program Office’s Orbital Debris Quarterly News. The article, entitled High-Speed Particle Impacts Suspected in Two Spacecraft Anomalies, highlights a growing trend in the local space environment.

The tale begins with GOES 13 located in geostationary orbit over longitude 75° West. Launched on May 24th, 2006 atop a Delta IV rocket, GOES 13 is an integral part of the U.S. National Oceanic and Atmospheric Administration (NOAA’s) Geostationary Operational Environmental Satellite network.

The problems began when GOES-13 began to suffer an “attitude disturbance of unknown origin” on May 22nd of this year, causing it to drift about two degrees per hour off of its required nadir (the opposite of zenith) pointing.

The anomaly was similar to a problem encountered by the NOAA 17 spacecraft on November 20th, 2005. At the time, the anomaly was suspected to be due to a micrometeoroid impact. The Leonid meteors, which peak right around the middle of November, were a chief suspect. However, NOAA 17 suffered a second failure 18 days later, which was later traced down to a hydrazine leak from its errant thrusters.

GOES-13 has weathered hard times before.  Back in December of 2006, GOES-13’s Solar X-Ray Imager suffered damage after being struck by a solar flare shortly after initial deployment.   GOES-13 also began returning degraded imagery in September 2012, forcing it into backup status for Hurricane Sandy.

GOES-13 was restored to functionality last month. Current thinking is that the satellite was struck by a micrometeorite. No major meteor showers were active at the time.

Loss of a GOES satellite would place a definite strain on our weather monitoring and Earth observing capability. Begun with the launch of GOES-1 in 1975, currently six GOES satellites are in operation, including one used to relay data for PeaceSat (GOES-7) and one used as a communications relay for the South Pole research station (GOES-3).

The GOES program cost NOAA billions in cost overruns to execute. The next GOES launch is GOES-R scheduled in 2015.

But the universe seems to love coincidences.

NEE-01 Pegaso before deployment. (Credit:
NEE-01 Pegaso before deployment. (Credit: Wikimedia Commons image in the Public Domain).

Less than 26 hours after the GOES 13 anomaly, Ecuador’s first satellite, NEE-01 Pegaso began to have difficulties keeping a stable attitude. The event happened shortly after passage near an old Soviet rocket booster (NORAD designation 1986-058B) which launched Kosmos 1768 on August 2nd, 1986. The U.S. Joint Space Operations Center had warned the fledgling Ecuadorian Space Agency that conjunction was imminent, but of course, there’s not much that could’ve been done to save the tiny CubeSat.

Although the main mass passed Pegaso at a safe distance, current thinking is that the discarded booster may have left a cloud of debris in its wake. Researchers have tracked small “debris clouds” around objects it orbit before- the collision of Iridium 33 and the defunct Kosmos 2251 on February 10th, 2009 left a ring of debris in its wake, and the Chinese anti-satellite test carried out on January 11th, 2007 showered low-Earth orbit with debris for years to come.

The loss represents a blow to Ecuador and their first bid to become a space-faring nation. Launched less than a month prior atop a Long March 2D rocket, Pegaso was a small 10 centimetre nanosatellite equipped with solar panels and dual infrared and visible Earth imaging systems.

A translation from the Ecuadorian Space Agencies site states that;

 “The NEE-01 survived the crash and remains in orbit; however it has entered uncontrolled rotation due to the event.

 Due to this rotation, (the satellite) cannot point its antenna correctly and stably to the Earth station and although still transmitting and running, the signal cannot be decoded. The Ecuadorian Civilian Space Agency is working tirelessly to stabilize the NEE-01 and recover the use of their signal.

The PEGASUS aired for 7 days your signal to the world via EarthCam, millions could see the Earth seen from space in real time, many for the first time, the files in those 7 days have been published after transmission.”

Ecuador plans to launch another CubeSat, NEE 02 Krysaor later in 2013. A carrier has not yet been named.

While both events suffered by the GOES-13 and NEE-01 Pegaso satellites were unrelated, they underscore problems with space junk and space environmental hazards that are occurring with a higher frequency.

Gabbard diagram displaying a sample disintegration of a Long March 4 booster in 2000. (Credit: the NASA Orbital Debris Office).

Such is the modern hazardous environment of low Earth orbit that new satellites must face. With a growing amount of debris, impact threats are becoming more common. The International Space Station must perform frequent debris avoidance maneuvers to avoid hazards, and more than once, the crew has waited out a pass in their Soyuz escape modules should immediate evacuation become necessary.  Punctures from micro-meteoroids or space junk have even been seen recently on the ISS solar panel arrays.

Plans are on the drawing board to deal with space junk, involving everything from “space nets” to lasers and even more exotic ideas. Probably the most immediate solution that can be implemented is to assure new payloads have a way to “self-terminate” via de-orbit at the end of their life span.  Solar sail technologies, such as NanoSailD2 launched in 2010 have already demonstrated this capability.

Expect reentries also pick up as we approach the peak of solar cycle #24 at the end of 2013 and the beginning of 2014. Increased solar activity energizes the upper atmosphere and creates increased drag on low Earth satellites.

It’s a brave new world “up there,” and hazards, both natural and man-made, are something that space faring nations will have to come to terms with.

-Read and subscribe to the latest edition of NASA’s Orbital Debris Quarterly News for free here.


A Heat Wave So Big You Can See It From Space

Image taken by NOAA's GOES East satellite at 12:45 p.m. EDT on July 15, 2013. (NOAA/NASA GOES Project)

Hot enough for ya? If you live anywhere on the eastern half of the United States (like me) you’ve probably been sweating it out over the past several days in what certainly feels like the warmest week yet for the season. The cause of the oppressive weather? A large mid-level ridge centered over the Ohio Valley — large enough to be easily visible from space.

The image above was taken by the GOES East satellite at 12:45 p.m. EDT on July 15. The clear area over Ohio shows the center of the system, which has been driving temperatures up into the 90s for much of the eastern U.S. and is expected to expand into the plains by mid-week. Along with increased humidity, heat index values will exceed 100 ºF and even approach 110 ºF on Friday.

From the NASA Image of the Day page:

A very anomalous weather pattern is in place over the U.S. for mid-July. Trapped between an upper level ridge centered over the Ohio Valley and the closed upper level low over the Texas/Oklahoma border, atypical hot, muggy air is stifling a broad swath of the eastern U.S. The closed low is expected to drift west toward New Mexico bringing heavy, localized rain to some areas and temperatures running 10-20 degrees below mid-July averages. Across the east, temperatures will warm well into the 90s and stay there through the week. (NOAA)

Rendering of a GOES satellite (NOAA)

As of the time of this writing heat advisories are in place in many parts of Michigan, southern Minnesota, and southern New England, and excessive heat warnings are active in eastern Pennsylvania and west central New Jersey. (Source)

Click here for summer heat safety tips.

Meanwhile, a closed low — seen above as a large, moisture-laden spiraling cloud system — is moving west across Texas and New Mexico, and is expected to bring lower-than-average temperatures along with heavy rains and flash flooding.

Keep up to date with weather alerts for your area at the NOAA’s National Weather Service site here, and see the latest GOES satellite images here.

Image Credit: NOAA/NASA GOES Project

At an altitude of 22,336 miles, the geosynchronous GOES satellites continuously provide observations of 60 percent of the Earth including the continental United States, providing weather monitoring and forecast operations as well as a continuous and reliable stream of environmental information and severe weather warnings.

Auroras Dance Over Northern U.S. Last Night, May Return Tonight

A thick green arc of aurora settled in for the night last night. It was about 5 degrees thick and some 10 degrees high. A faint but colorful diffuse aurora glowed above it. All photos taken with a 16-35 mm lens at f/2.8 and 30-second time exposure. Credit: Bob King

A burst of energetic particles from the Sun called a coronal mass ejection peppered Earth’s magnetic field yesterday afternoon sparking a modest but beautiful all-night display of the aurora borealis. Another light show may be in the offing tonight for skywatchers living in the northern U.S.,  Canada and northern Europe.

Around 1 a.m. the arc became more active, sending up occasional rays that lasted from about a minute before fading away and being replaced by another. Credit: Bob King

Pale green fingers of light splayed across the northern sky at twilight’s end came as a surprise. NOAA space weather forecasters had predicted little activity. These soon faded but a thick, fuzzy arc persisted throughout the night. It arched from horizon to horizon across the northern sky like a pallid, monochromatic rainbow. Such arcs are common. Often the aurora never gets past this stage and simmers quietly or even fades away during the night.

Not this one. Around local midnight (1 a.m. CDT) here in Duluth, Minn. small bright spots and a series of tall, faint rays punctuated the arc and over the span of a half-hour completely reshaped it into loopy rayed arcs resembling a crown.

I wasn't alone when the northern lights peaked about 1:20-2 a.m. At upper left you'll see the trails of a couple of fireflies. Credit: Bob King
I wasn’t alone when the northern lights peaked about 1:20-2 a.m. At upper left you’ll see the trails of a couple of fireflies. Credit: Bob King

To the eye, the brightest parts of the aurora appeared green, but the taffy-stretched rays were colorless. The camera’s sensitivity coupled with a 30-second time exposure revealed striking pinks and hints of blue. Both pink and green colors are caused by the emission of light from oxygen atoms.

An especially beautiful ray sticks up above the arc. Shorter exposures coupled with shorter shutter speeds are the best way to capture fine details of a northern lights display. Credit: Bob King

Bombarded by high-speed solar wind electrons and protons, they get jazzed into higher energy states. When the atoms return to rest, each spits out a photon of green or red light. All those tiny flashes add up. Multiplied by the billions of atoms that exist even in the rarefied air at the aurora’s typical 60-150 mile (100-250 km) altitude and you get heavenly eye candy.

When we see an auroral arc - and associated rays - we really seeing a small section of the much larger, permanent aurora called the auroral oval. The northern oval is centered over the geomagnetic north pole located in northern Canada. Credit: NASA
When we see an auroral arc – and associated rays – we really seeing a small section of the much larger, permanent aurora called the auroral oval. The northern oval is centered over the geomagnetic north pole located in northern Canada. Credit: NASA

I started watching the northern lights at 11 from home then took a drive to darker skies. Even at dawn’s 3 a.m. start, the green arc held its own shot through with rays that occasionally towered halfway up the northern sky. While this display wasn’t a grand spectacle like some auroras, it possessed a certain majesty the same way a long, slow movement concludes a great symphony.

Chances for more of the same continues through tonight and possibly into tomorrow, so keep a watch on the northern sky before you hit the hay tonight. If you see something green and glowing it you might be in for a treat.

In another installment, I’ll share tips on how best to see the northern lights and share several excellent tools you can use for predicting when they might occur.

Herbal Earth: Spectacular Vegetation Views of Our Home Planet and the Natural World of Living Green Life

Earth’s Vegetation. World map of vegetation created with Suomi NPP data. Credit: NASA/NOAA

Earth’s Vegetation from Suomi NPP satellite. World map of vegetation data collected by the Suomi NPP satellite (National Polar-orbiting Partnership) in a partnership between NASA and the National Oceanic and Atmospheric Administration (NOAA). Credit: NASA/NOAA
Photo and Video Gallery below[/caption]

Herbal Earth: that’s the title of a spectacular collection of vivid new views of the Earth’s vegetation captured over the past year by the Suomi NPP satellite.

NPP is short for National Polar-orbiting Partnership – an Earth science satellite partnership between NASA and the National Oceanic and Atmospheric Administration (NOAA).

Although it’s rather reminiscent of the manmade ‘World at Night’ – its actually the ‘Natural World of Living Green Life.’

The Suomi NPP satellite data were collected with the Visible-Infrared Imager/Radiometer Suite (VIIRS) instrument from April 2012 to April 2013 and used to generate this gallery of images and animations – released by NASA and NOAA on June 19.

Western Hemisphere -Vegetation on Our Planet. The darkest green areas are the lushest in vegetation, while the pale colors are sparse in vegetation cover either due to snow, drought, rock, or urban areas. Suomi NPP Satellite data from April 2012 to April 2013 was used to generate these images. Credit: NASA/NOAA

Suomi NPP was launched on October 28, 2011 by a Delta II rocket and placed into a sun-synchronous orbit 824 km (512 miles) above the Earth. It orbits Earth about 14 times daily.

The VIIRS instrument measures vegetation changes over time by looking at changes in the visible and near-infrared light reflected by vegetation. The 22-band radiometer sensor can detect subtle differences in greenness.

Nile Delta: July 9-15, 2012.  Amidst the deserts of Egypt, the Nile River provides life-sustaining water to the region. Also visible are the urbanized areas of northern Egypt. Credit: NOAA/NASA
Nile Delta: July 9-15, 2012. Amidst the deserts of Egypt, the Nile River provides life-sustaining water to the region. Also visible are the urbanized areas of northern Egypt. Credit: NASA/NOAA

The data are incorporated into the Normalized Difference Vegetation Index (NDVI) which represents the photosynthetic potential of vegetation.

The NVDI measures and monitors plant growth, vegetation cover and biomass production from the Suomi NPP satellite information.

The Florida Everglades: March 18-24, 2013. The "river of grass" extending south of Lake Okeechobee shows clear signs of its modified state with areas of dense agriculture, urban sprawl and water conservation areas delineated by a series of waterways that crisscross Southern Florida.  Credit: NOAA/NASA
The Florida Everglades: March 18-24, 2013. The “river of grass” extending south of Lake Okeechobee shows clear signs of its modified state with areas of dense agriculture, urban sprawl and water conservation areas delineated by a series of waterways that crisscross Southern Florida. Credit: NASA/NOAA

A quarter of the Earth’s surface is covered by some green vegetation, the remainder is the blue ocean.

Video: Green- Vegetation on Our Planet (Tour of Earth)

And don’t forget to “Send Your Name to Mars” aboard NASA’s MAVEN orbiter- details here. Deadline Very Soon: July 1, 2013. Launch: Nov. 18, 2013

Ken Kremer

…………….
Learn more about Earth, Mars, Curiosity, Opportunity, MAVEN, LADEE and NASA missions at Ken’s upcoming presentation

June 23: “Send your Name to Mars on MAVEN” and “CIBER Astro Sat, LADEE Lunar & Antares Rocket Launches from Virginia”; Rodeway Inn, Chincoteague, VA, 8 PM

Eastern Hemisphere -Vegetation on Our Planet. Credit: NASA/NOAA

Hurricane Sandy Barreling to Eastern Seaboard Menacing Millions

Image Caption: NOAA Satellite image of Hurricane Sandy threatening millions of people living along US Eastern Seaboard. See NASA satellite imagery below. Credit: NOAA

Hurricane Sandy, a powerfully monstrous and unprecedented late season storm, is barreling mightily towards the US Eastern Seaboard, menacing tens of millions of residents living in the path of her sustained destructive winds, rains and life threatening storm surges.

Mandatory mass evacuations involving hundreds of thousands of people are already in progress in anticipation of a devastating storm strike on Monday (Oct 29).

First effects from Sandy are expected on Sunday night (Oct 28) in the New York/ New Jersey/Connecticut/Pennsylvania metropolitan area. Wind gusts are already exceeding 40 MPH as of Sunday afternoon, here in New Jersey – and steadily worsening.

Coastal Wave heights of 6 to 11 feet are predicted – possibly breaking records.

Public transit systems in New York City/New York, New Jersey, Philadelphia, Pennsylvania, Connecticut and Washington, D.C. have been ordered to shut down later today – Sunday – by the Governors’ of the affected states. Most schools and government offices will also be closed on Monday.

Amtrak has just announced it will shutdown trains in the Northeast Corridor.

Image Caption: Hurricane Sandy off the southeastern United States was imaged at noon Eastern Daylight Time (16:00 UT) on October 28, 2012, acquired by the Moderate Resolution Imaging Spectroradiometer (MODIS) on NASA’s Terra satellite. Credit: NASA Terra satellite

As of Sunday afternoon (Oct. 28) Sandy is predicted to make a dramatic, sharp left hook on Monday morning and most likely will make a violent direct hit slamming somewhere along the Jersey shore which borders from Maryland to New York City and beyond – sending high waves surging into coastal towns and cities overwhelming protective barriers.

Image Caption: Predicted path of Hurricane Sandy. Credit: NOAA

Inland areas will also suffer widespread destruction and power losses as Sandy slowly moves onshore and lingers over an extraordinarily wide path spanning several hundred miles in diameter.

Heavy rains and hurricane force wind gusts will soak the ground, taking down trees and power lines. Leaves may block storm drains.

Hurricane Sandy is currently classified as a Category 1 Hurricane. Its effects could be catastrophic and should not be taken lightly.

Making matters even worse, Sandy will hit during a full moon and the astronomical highest tides.

The National Hurricane Service warns that major flooding effecting millions of homes and businesses is expected along the US East Coast stretching from North Carolina to New England.

Millions and millions of people have more than a 50% chance of losing power.

Local power companies learned hard lessons from the devastating effects of Hurricane Irene just 1 year ago, which caused widespread and serious misery, flooding and deaths throughout the Northeast. Some people went without power for more than 2 weeks in the aftermath of Hurricane Irene in 2011. This author lost power for several days and now we are in for another direct hit.

Additional Power crews have been called in from across the country and prepositioned as a precautionary measure. NEVER touch any downed power lines.

States of Emergency have been declared in 9 eastern States from North Carolina to Maine as well as the District of Columbia.

Mandatory evacuations of low lying coastal areas have been ordered by the Governors’ of New Jersey, New York and Connecticut. State Shelters are being opened now.

Ocean wave heights of 20 to 50 feet have already been reported near the Hurricane’s eye.

Even the US Presidential election is being affected by Hurricane Sandy. Campaign events by both candidates Obama and Romney have been cancelled in several key battleground states. It is possible that polling stations may lose power – and the consequences are unknown on the closely contested election that could hinge on a handful of votes !

Stay tuned to NOAA, NASA and local and national news for continuing Hurricane updates.

Ken Kremer