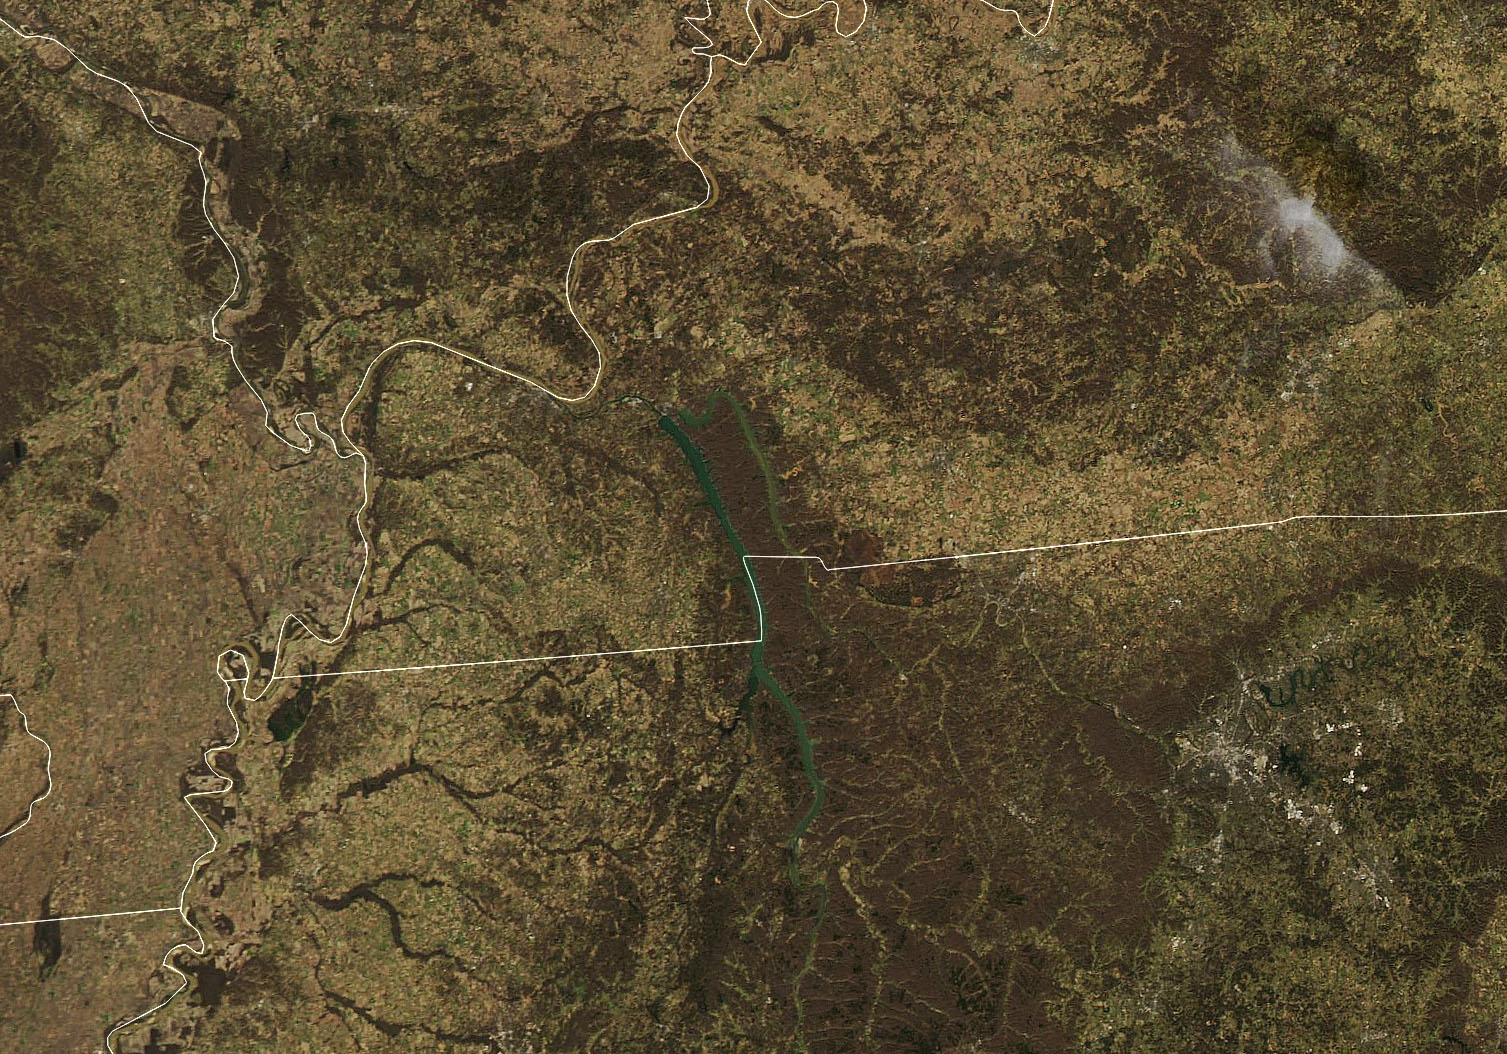
On December 12, 2021, the Moderate Resolution Imaging Spectroradiometer (MODIS) on NASA’s Aqua satellite acquired this natural-color image of the tornado track across western Kentucky near Mayfield. This area endured some of the worst damage of the fierce storm front. Credit: NASA/NOAA.
During the night of December 10, 2021, severe weather tore through several US states, Arkansas, Illinois, Kentucky, Mississippi, Missouri and Tennessee. At least 70 tornado-like events were reported, and one storm cell was tracked on radar for approximately four hours as it traveled for more than 400 km (250 miles.)
While the destruction these storms left behind is visible even from space, the heartbreaking devastation on the ground is sobering; over 100 people killed, with hundreds more injured.
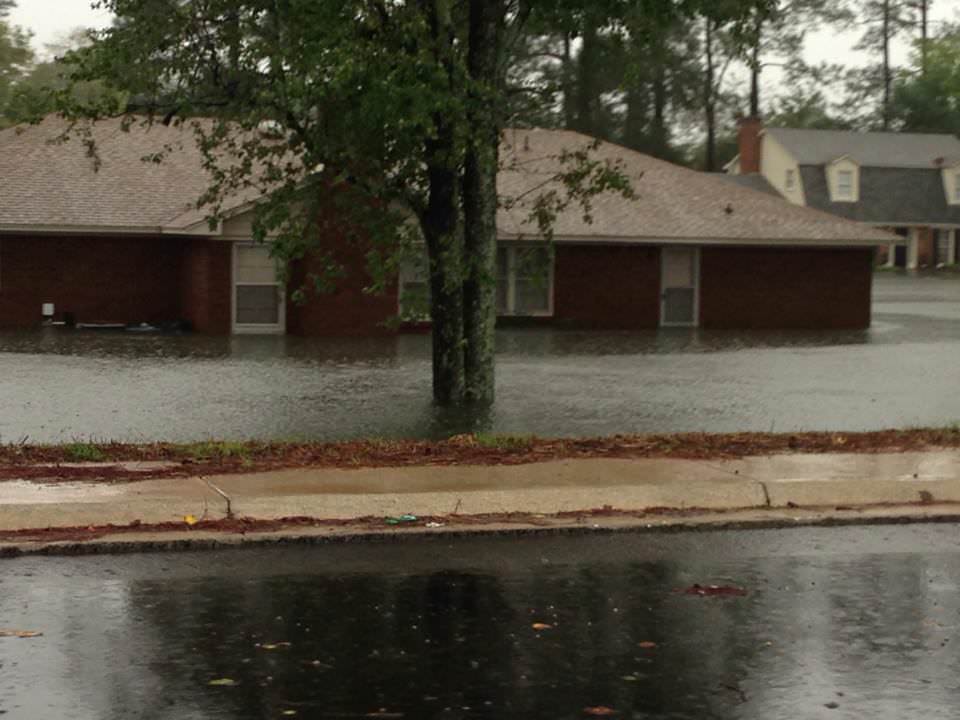
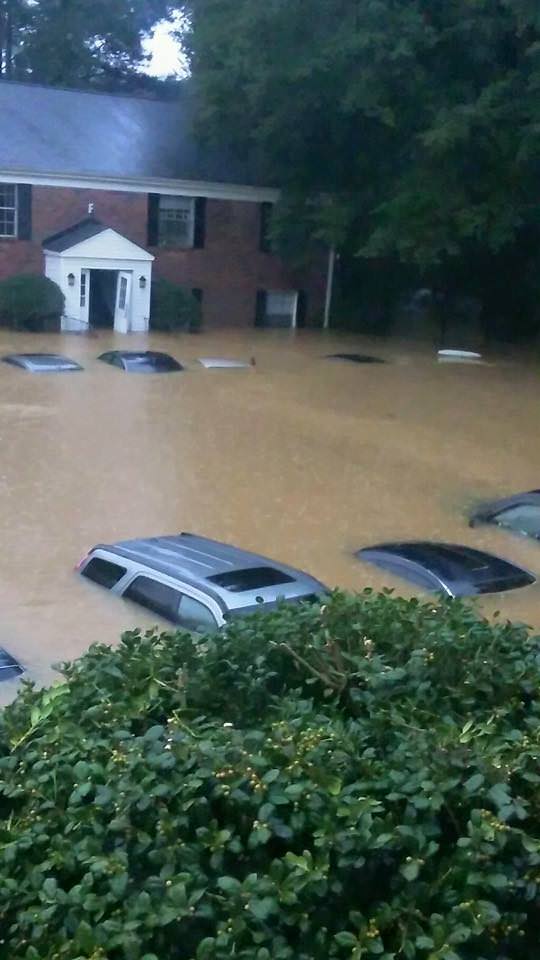
Flooded streets and houses in South Carolina. Credit: Hap Griffin
Video Caption: NASA/JAXA’s GPM satellite measured record rainfall that fell over the Carolinas from September 26 to October 5, 2015 from a plume of moisture from Hurricane Joaquin when it was located over the Bahamas and moved to Bermuda. The IMERG showed highest rainfall totals near 1,000 mm (39.3 inches) in a small area of South Carolina and rainfall between 700 and 900 mm (27.5 and 37.4 inches) over a large area of South Carolina. Credits: SSAI/NASA/JAXA, Hal Pierce See below ground level images and videos of storm devastation Story updated with additional details/imagery from NASA and South Carolina
South Carolina Gov. Nikki Haley declared the historic and torrential rain fall to be a “1000 Year event” on Sunday, Oct. 4. “We have never seen anything like this.” Governor Haley and President Obama issued a “State of Emergency.”
Although the horrendous rains in South Carolina may nearly be done, the nor’easter caused damage estimated to be in the Billions of Dollars and at least 9 storm related deaths as of today, Monday, Oct. 5.
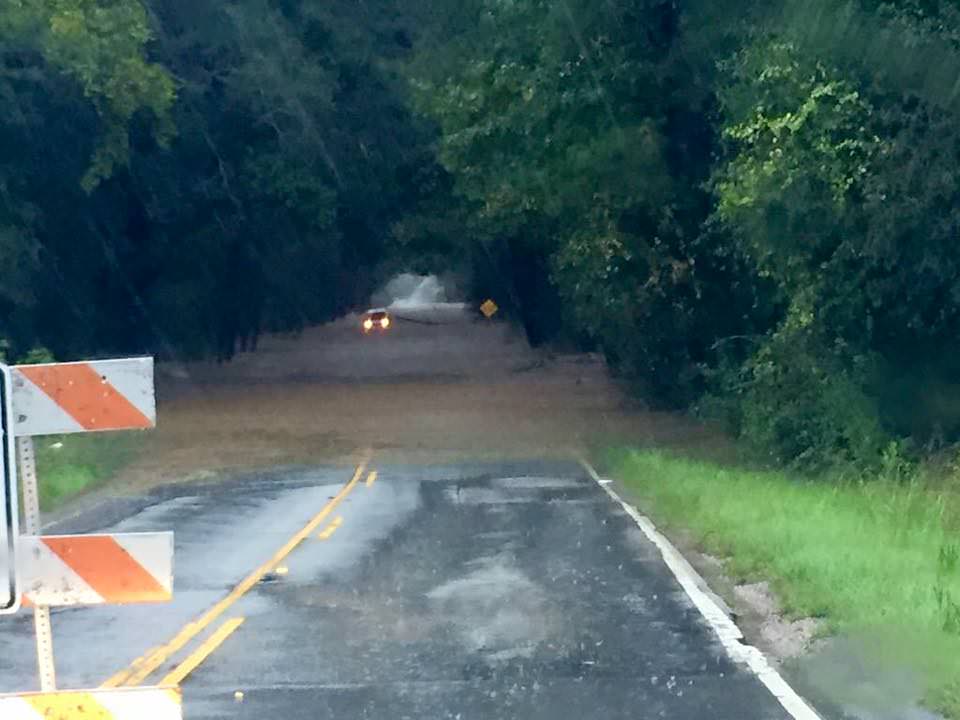
Rainfall totals ranging from 14 to 37 inches in local areas over the past week drenched a wide swath of the Palmetto state with never before seen flooding, according to NASA and NOAA. The most intense periods of rain fell over the weekend.
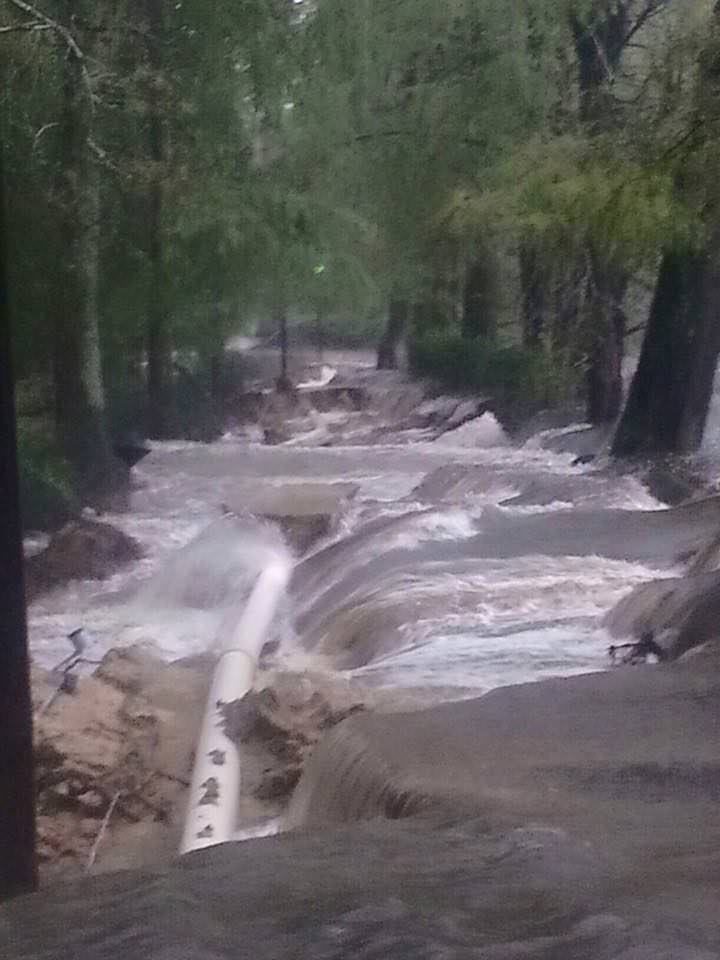
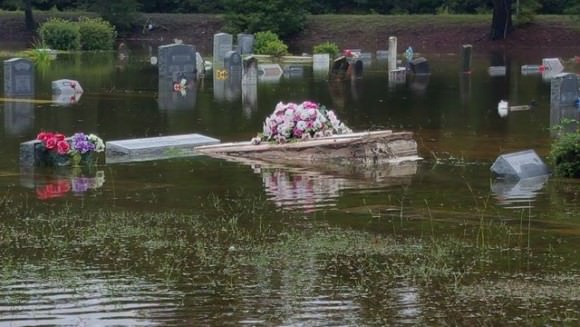
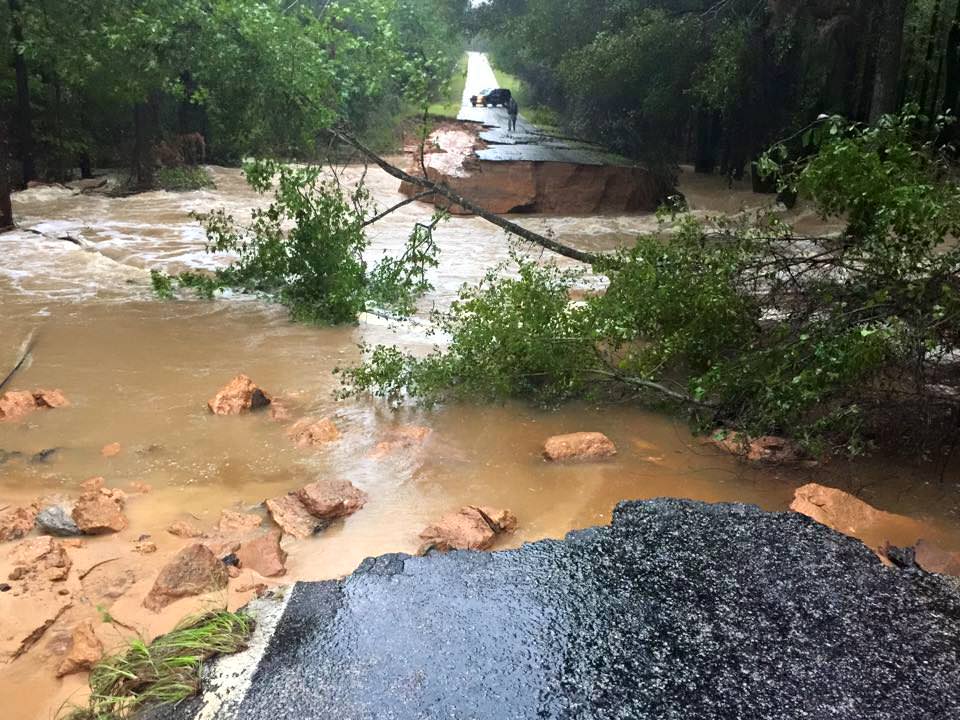
See herein a gallery of photos from friends and others living through the disaster in South Carolina.
NASA astronaut Scott Kelly also captured dramatic images of Hurricane Joaquin – as I reported earlier here.
A slew of NASA and NOAA orbiting weather satellites are constantly tracking the fierce storms and providing the state and federal governments with the most up to date forecasts to aid officials and emergency responders in evaluating and managing the disaster in the most effective manner possible.
NASA’s GPM and a global fleet of other international weather monitoring satellites gathered measurements every 30 minutes from September 26 to October 5, 2015 that were combined into the eyepoppongly dramatic IMERG (Integrated Multi-satellitE Retrievals for GPM) color-coded video above. It tracks the massive growth, spread and direction of the storms and shows the historic levels of destructive precipitation generated by the lethal pair of powerful storms.
The NASA GPM video shows plumes of moisture from the Nor’Easter and Hurricane Joaquin as they gather force and moved over South Carolina and through the Caribbean around and over the Bahamas and later as Joaquin fortunately veered away from the US eastern seaboard towards Bermuda.
“The IMERG showed highest rainfall totals near 1,000 mm (39.3 inches) in a small area of South Carolina and rainfall between 700 and 900 mm (27.5 and 37.4 inches) over a large area of South Carolina,” says NASA’s Hal Pierce.
Here’s a NASA video with NASA scientist Dalia Kirschbaum describing how GPM can see inside a hurricane to makes rainfall and precipitation measurements in 3D:
Video caption: NASA scientist Dalia Kirschbaum explains how the Global Precipitation Measurement Mission’s Core observatory has an instrument that can see layer by layer through a storm.
The GPM precipitation measurements come from both of its advanced radar instruments – the dual-frequency precipitation (DPR) radar instrument (Ku and Ka band) and the GPM microwave imager (GMI), NASA scientist George Huffman told Universe Today.
The IMERG video is based on an algorithm that also carefully combines and calibrates measurements gathered every 30 minutes from the passive microwave sensors flying aboard a large international constellation of satellites from the US, Europe, Japan and India – and outlined in complete detail further below by NASA’s Huffman and Kirschbaum; exclusively for Universe Today.
The visualization of data was created by NASAs Goddard’s Space Flight Center and shows Hurricane Joaquin around the Bahamas “when it was a tropical storm. Red and green colors show rain and the ice and snow at the top of the storm is visualized in blue.”
“Understanding hurricane structure helps weather forecasters around the world determine a storm’s structure and where it may be going,” says Kirschbaum.
Hurricane Joaquin was still packing winds exceeding 125 mph this morning, but it has lost strength throughout the day.
Over 40,000 homes and businesses are without power today, Oct. 5, in South Carolina due to the unending rain and widespread catastrophic flooding. And many folks had to be evacuated.
Some cemeteries were uprooted with caskets seen floating down flooded streets.
Residents are warned to stay out of the flood waters and standing waters that can be carrying bacteria and diseases presenting a significant health hazard.
In the capitol city of Columbia, there was widespread flooding with severe damage to water mains that cut off drinking water to over 15,000 people.
The governor deployed over 1300 national guard troops to render assistance. Over 150 folks were rescued by helicopter, some from the rooftops of their homes and apartments.
Here’s a helicopter rescue:
Video: Helicopter Rescue at Lakewood Links in Sumter, SC on Oct 4, 2014. Credit: Sean Reyes
Scores of South Carolina residents were getting rescued by canoes and even boats where waters surged in places up to 25 feet above normal.
At least 9 dams have been breached statewide, as well as levees, requiring many thousands people more to be evacuated.
Dam at Swan Lake in South Carolina on Oct. 4, 2015. Credit: Edwin Corning
Governor Haley confirmed that over 550 roads were either closed, damaged or destroyed, including back roads and major interstate highways vital to the states and US national economy.
A 70 mile stretch of I-95, a major north-south artery traveled by millions including myself, was closed to all traffic on Sunday and remains closed today. And many side roads that could serve as potential detours are also closed.
Historically high water levels in some of the areas worst hit by flooding has finally receded. But in other areas water levels are rising.
In addition, the US Coast Guard says the cargo ship ‘El Faro’ with 33 people aboard is believed to have sunk because it ventured straight into Hurricane Joaquin. The ship’s crew included 28 Americans and 5 Polish sailors. It sank in the area popularly known as the ‘Bermida Triangle’ in water some 3 miles deep.
Today, the Coast Guard reported the discovery of a debris field over 25-square-miles wide. At least one crew member has already been found dead.
The El Faro set out from the port of Jacksonville on Tuesday when Joaquin was a tropical storm with 85 mph wind speed.
The last distress call on last Thursday morning, as the ship neared the eye of the Hurricane, then a Category 3. The ship was listing over 15 degrees surrounded by 30 foot high waves.
The hurricane quickly grew into a Cat 4 and no further word was heard from the ship. It may be 3 miles underwater at the bottom of the Atlantic Ocean.
How and from which fleet of satellites does NASA obtain the orbital measurements used to create the high resolution, color-coded GPM IMERG visualizations?
“The Integrated Multi-satellitE Retrievals for GPM (IMERG) creates a merged precipitation product from the GPM constellation of satellites. These satellites include DMSPs from the U.S. Department of Defense, GCOM-W from the Japan Aerospace Exploration Agency (JAXA), Megha-Tropiques from the Centre National D’etudies Spatiales (CNES) and Indian Space Research Organization (ISRO), NOAA series from the National Oceanic and Atmospheric Administration (NOAA), Suomi-NPP from NOAA-NASA, and MetOps from the European Organisation for the Exploitation of Meteorological Satellites (EUMETSAT),” NASA scientists George Huffman and Dalia Kirschbaum told me exclusively for Universe Today.
“All of the instruments (radiometers) onboard the constellation partners are intercalibrated with information from the GPM Core Observatory’s GPM Microwave Imager (GMI) and Dual-frequency Precipitation Radar (DPR). The data are gridded at 0.1°x0.1° lat./lon and provided in 30 minute time slices through morphing between satellite overpasses. The satellite estimates are then calibrated with rainfall gauge information.”
Here’s another GPM visualization of Hurricane Joaquin:
Stay tuned here for Ken’s continuing Earth and planetary science and human spaceflight news.
Hurricane Joaquin captured on Oct. 2, 2015 by NASA Astronaut Scott Kelly from the International Space Station. Credit: NASA/Scott Kelly
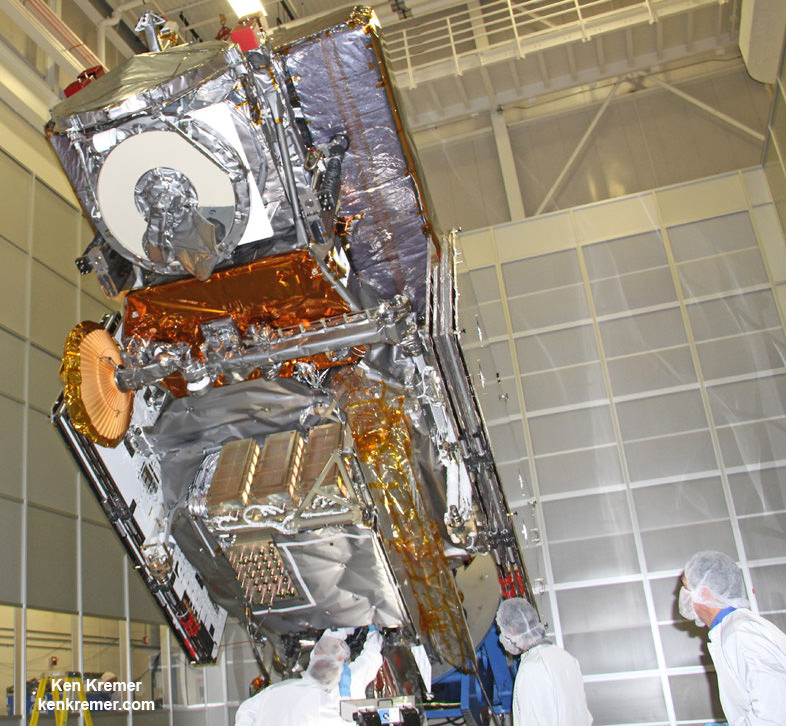
NASA’s next generation Global Precipitation Measurement (GPM) observatory inside the clean room at NASA Goddard Space Flight Center, MD. Technicians at work on final processing during exclusive up-close inspection tour by Universe Today. GPM wasn successfully launched on February 27, 2014 and will provide global measurements of rain and snow every 3 hours. Credit: Ken Kremer/kenkremer.com
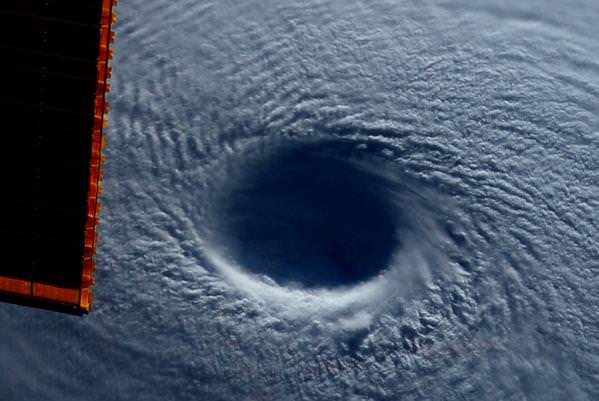
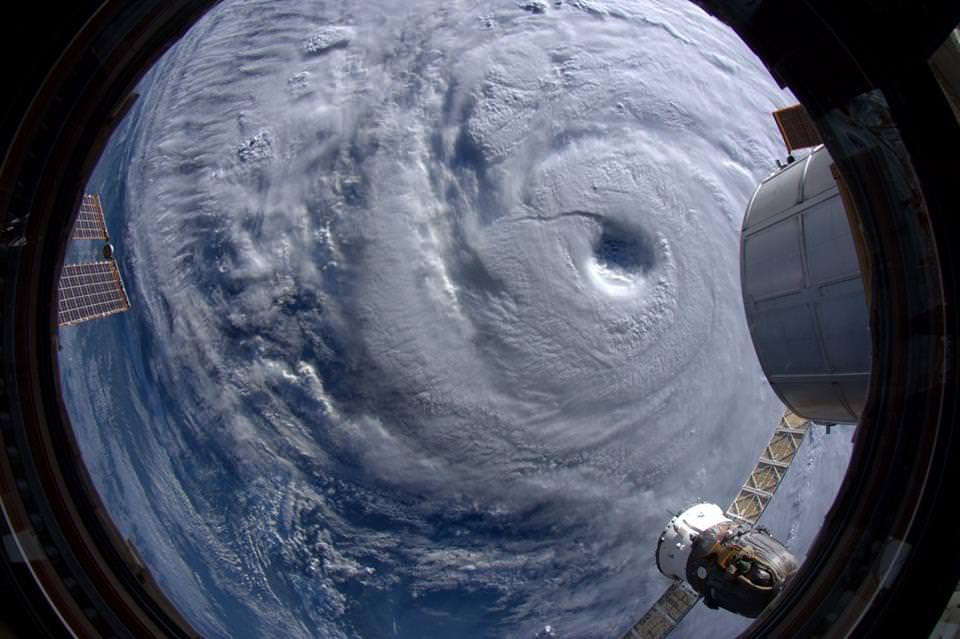
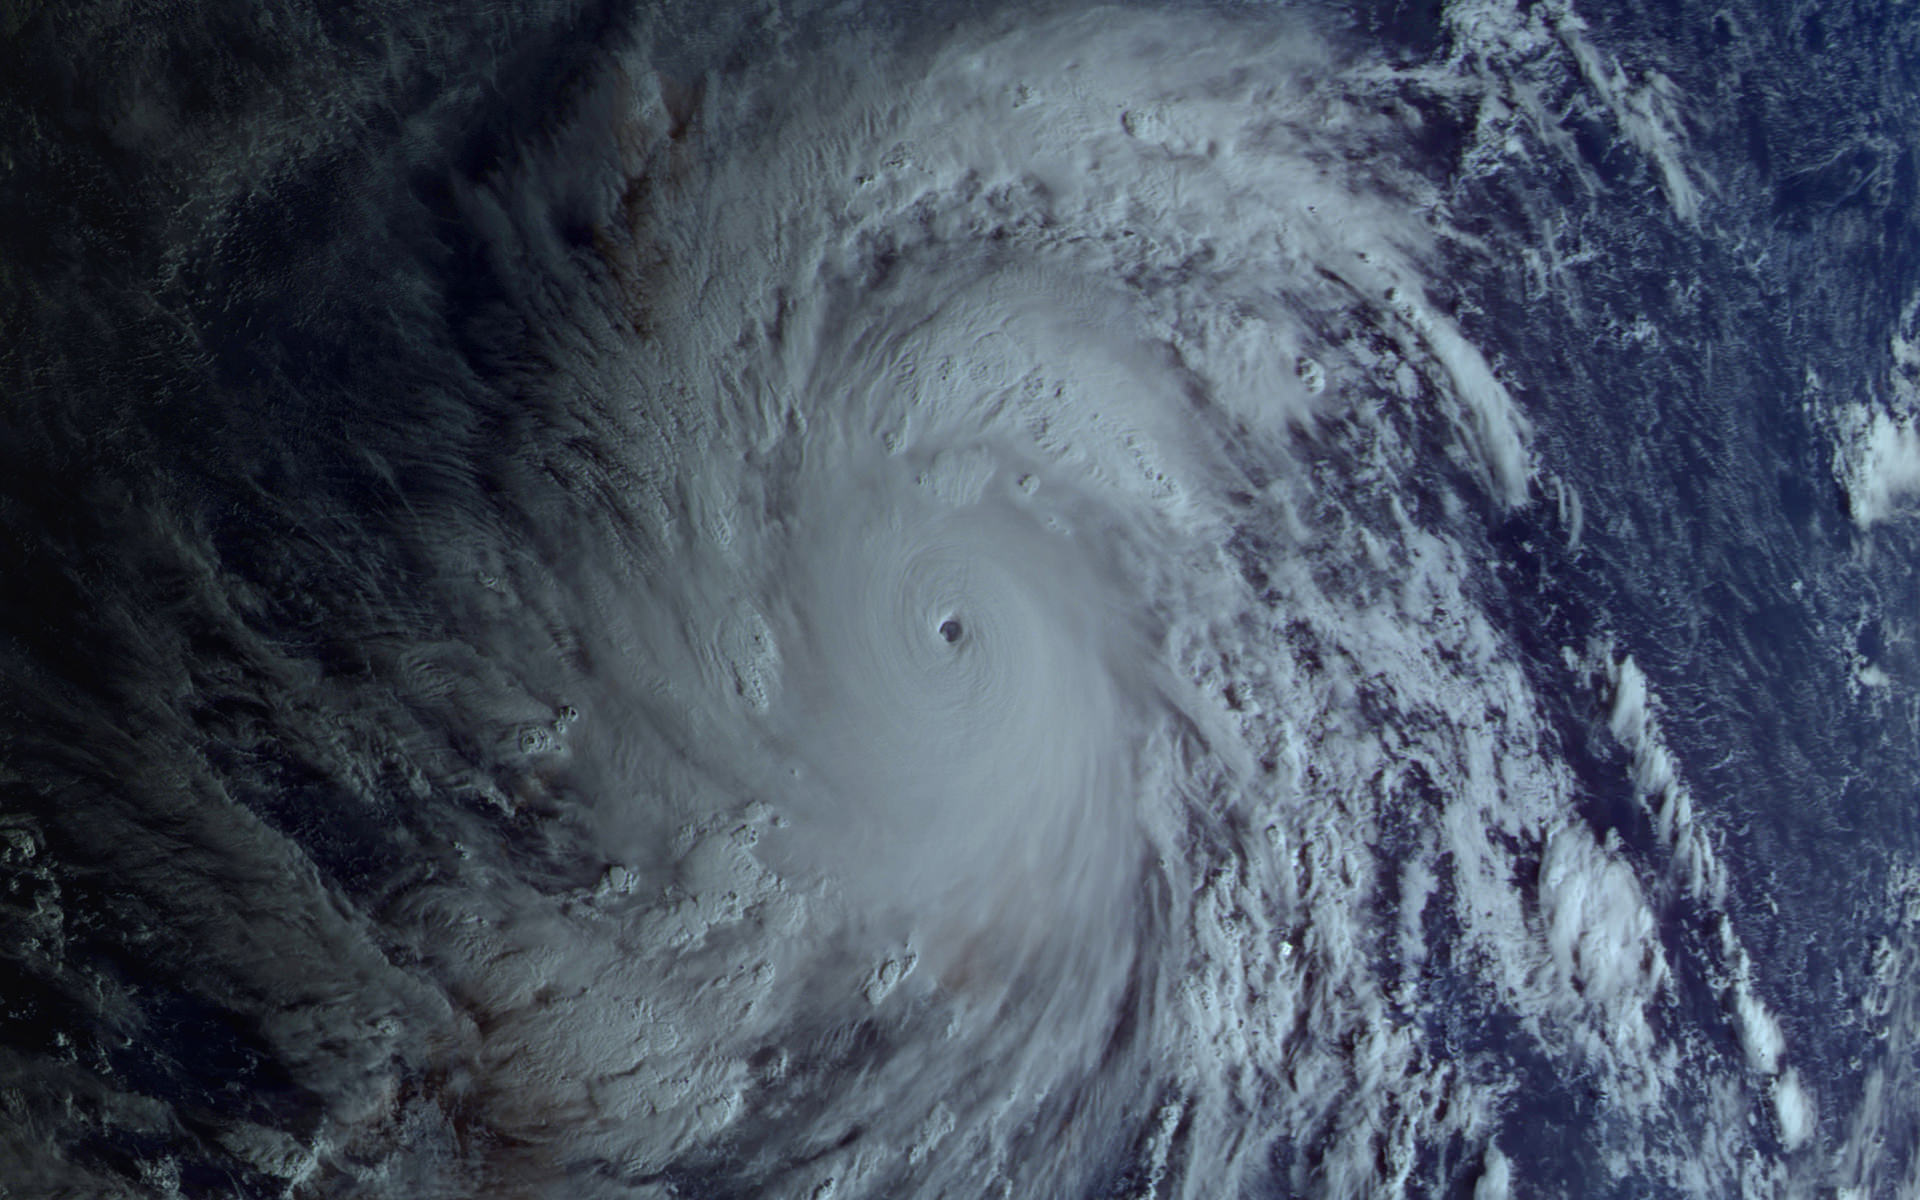
Maysak, a category 4 Super Typhoon, as photographed by astronaut Terry Virts on board the International Space Station. Credit: NASA/Terry Virts.
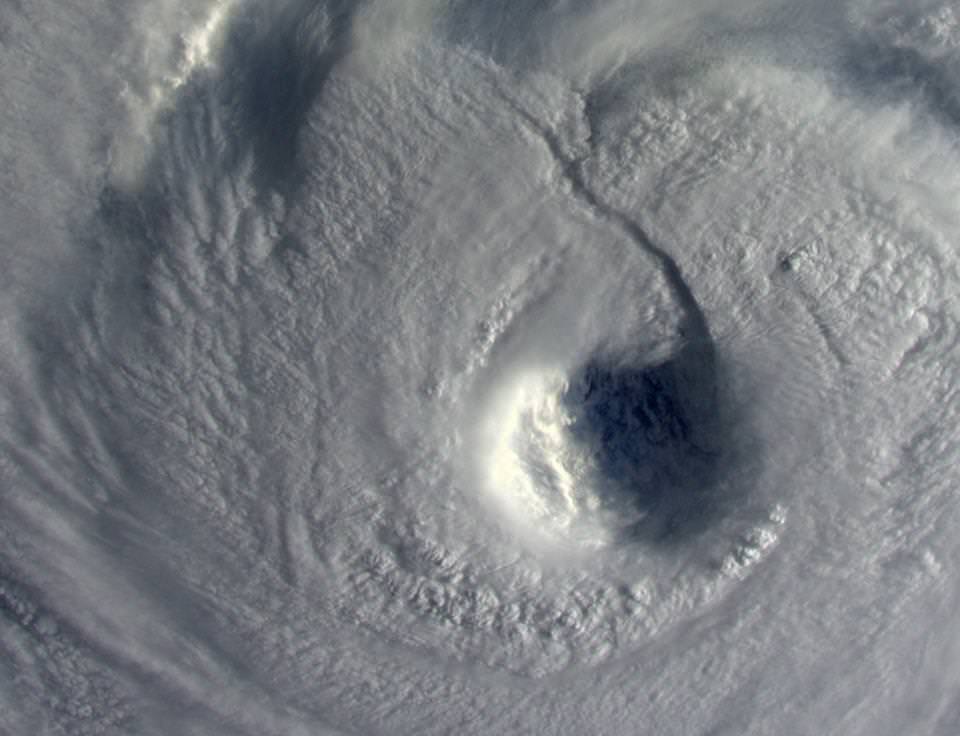
From his perch on the International Space Station, astronaut Terry Virts has been taking some beautiful photos of Earth and space and sharing them on social media. Today, he shared his views of Super Typhoon Maysak, including this terrifying view looking straight down into the huge eye of the storm. “Looking down into the eye – by far the widest one I’ve seen,” he tweeted. “It seemed like a black hole from a Sci-Fi movie.”
See more of his images, below.
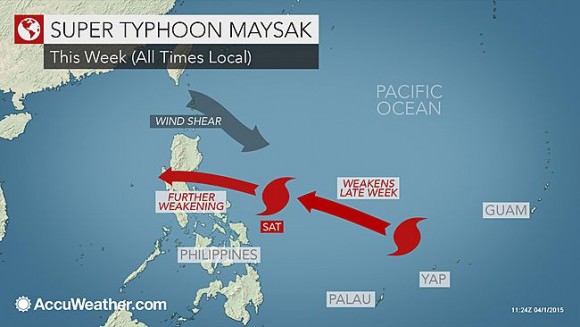
According to AccuWeather.com, Super Typhoon Maysak is one of the strongest cyclones in history during the months of January, February and March. It has slammed several Micronesian islands, killing 5 people, and is now on its way to the Philippines. As of early on April 1, Maysak had sustained winds of 240 kph (150 mph), equivalent of a Category 4 hurricane. Gusts as high as 390 kph (180 mph) are possible with this storm.
Looking down into the eye – by far the widest one I’ve seen. It seemed like a black hole from a Sci-Fi movie #Maysakpic.twitter.com/hmdBStaY6r
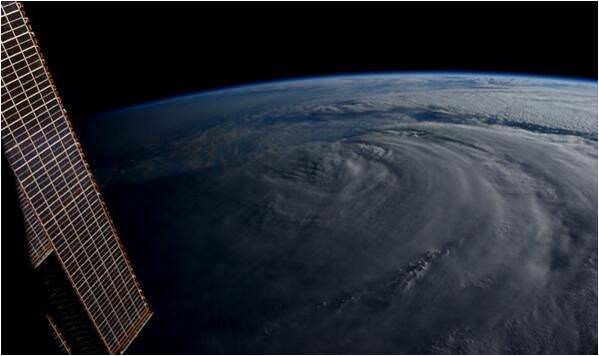
“Watch Out Japan!” added Gerst while he and his crewmates working aboard the ISS send back breathtaking imagery of the gigantic super typhoon heading towards Japan.
Neoguri is currently lashing the Japanese island of Okinawa with powerful damaging winds of over 125 mph and heavy downpours of flooding rain.
The Joint Typhoon Warning Center or JTWC reports that Neoguri is creating large and dangerous swells with wave heights to 37 feet (11.2 meters).
CNN reports today, July 8, that over 600,000 people have been told to evacuate and over 100,000 already have no power. Gusts have reached 212 kph (132 mph),
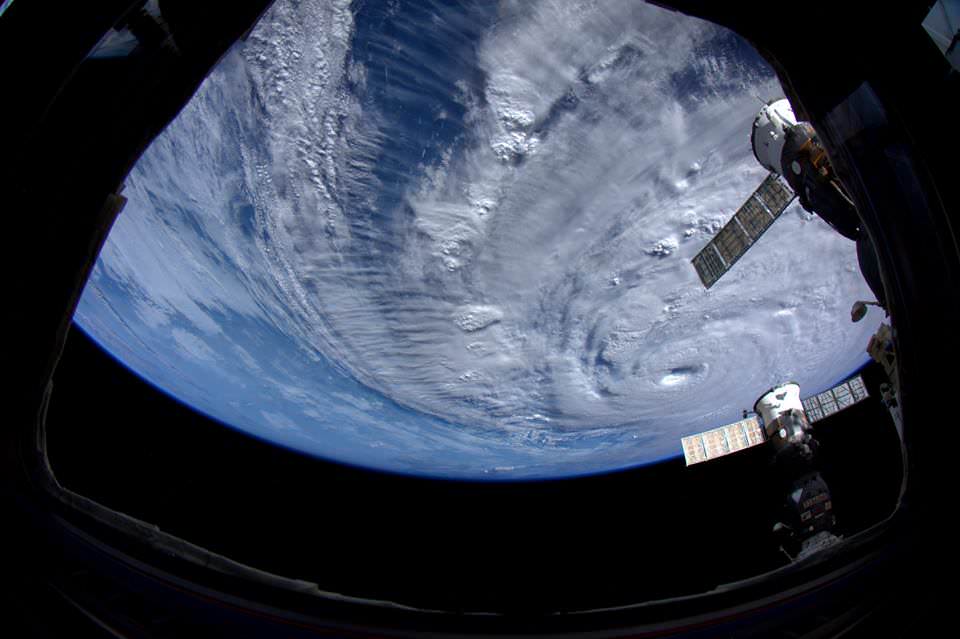
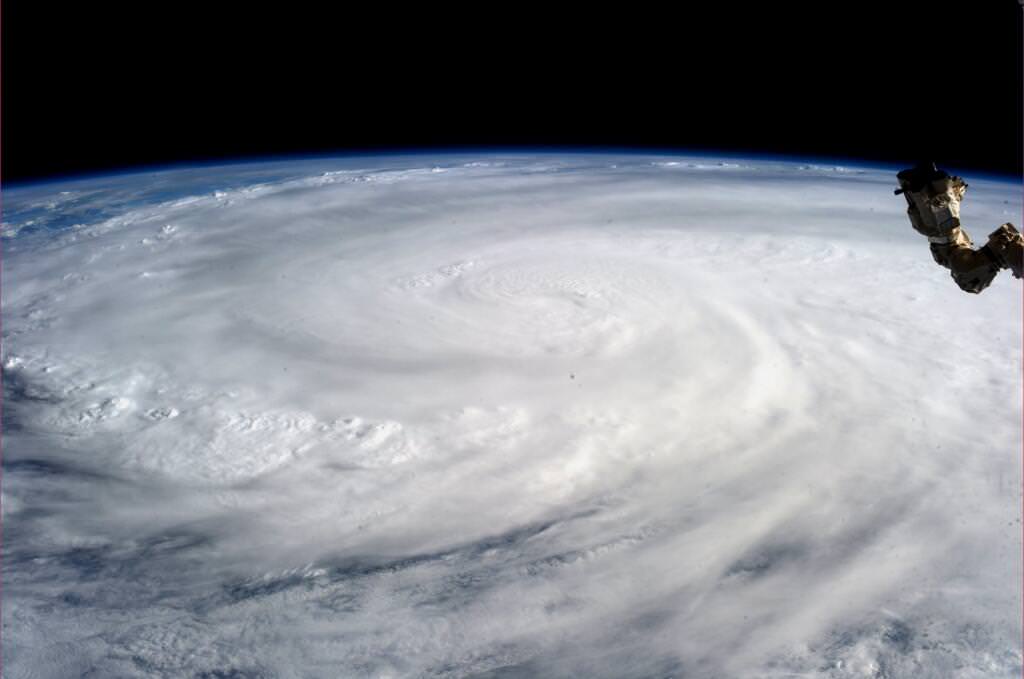
“Supertyphoon Neoguri did not even fit into our fisheye lens view. I have never seen anything like this.” Taken from the ISS on 8 July 2014. Credit: ESA/NASA/Alexander Gerst
The storm is so big it could not even be captured in a single image taken today using the astronauts fisheye lens on the ISS.
“Supertyphoon Neoguri did not even fit into our fisheye lens view. I have never seen anything like this,” reports Gerst today, July 8.
And the worst may be yet to come as Neoguri is forecast to make landfall on Kyushu, the southernmost island of the Japanese mainland and home to more than 13 million people after 0000 UTC on July 10 (8 p.m. EDT on July 9).
Super Typhoon Neoguri formed in the western Pacific Ocean south-southeast of Guam on July 3, 2014, according to NASA.
ISS above Supertyphoon Neoguri. Taken from the ISS on 7 July 2014. Credit: ESA/NASA/Alexander Gerst
By July 5 it had maximum sustained winds near 110 knots (127 mph).
The NASA and Japan Aerospace Exploration Agency’s Tropical Rainfall Measuring Mission or TRMM satellite passed over the typhoon on Monday, July 7. It was classified as a category four typhoon on the Saffir-Simpson hurricane scale with sustained winds estimates at 135 knots (155 mph), says NASA.
The eerie looking eye is 65 kilometers (40 miles) in diameter. See photo.
“Scary. The sunlight is far from reaching down the abyss of Neoguri’s 65 km-wide eye.” Taken from the ISS on 8 July 2014. Credit: ESA/NASA/Alexander Gerst
It has since decreased slightly in intensity to a category three typhoon.
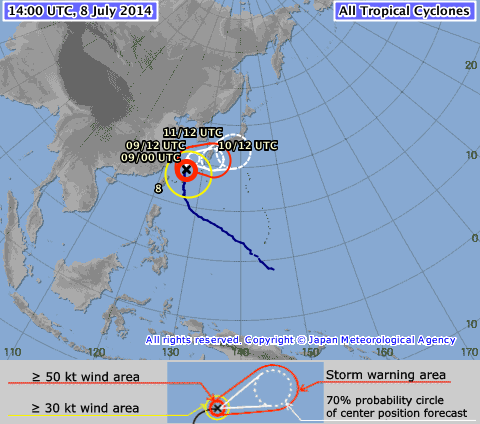
According to the Japanese Meteorological Agency Neoguri is currently located at 28°55′ (N) and E125°50′ (E).
At 5:02 PM EDT today, July 8, NASA just reported that the ISS flew directly over Neoguri and may have been visible in the new live HDEV cameras residing on the stations truss.
“Neoguri has been literally cut in half. Unreal.” Taken from the ISS on 8 July 2014. Credit: NASA/Reid Wiseman
Stay tuned here for Ken’s continuing ISS, OCO-2, GPM, Curiosity, Opportunity, Orion, SpaceX, Boeing, Orbital Sciences, MAVEN, MOM, Mars and more Earth & Planetary science and human spaceflight news.
Super Typhoon Haiyan over the Philippines on November 9, 2013 as imaged from Earth orbit by NASA Astronaut Karen Nyberg aboard the International Space Station. Credit: NASA/Karen Nyberg
Super Typhoon Haiyan over the Philippines on November 9, 2013 as imaged from Earth orbit by NASA Astronaut Karen Nyberg aboard the International Space Station.Category 5 killer storm Haiyan stretches across the entire photo from about 250 miles (400 kilometer) altitude. Credit: NASA/Karen Nyberg See more Super Typhoon Haiyan imagery and video below
[/caption]
NASA GODDARD SPACE FLIGHT CENTER, MARYLAND – Super Typhoon Haiyan smashed into the island nation of the Philippines, Friday, Nov. 8, with maximum sustained winds estimated at exceeding 195 MPH (315 kilometer per hour) by the U.S. Navy Joint Typhoon Warning Center – leaving an enormous region of catastrophic death and destruction in its terrible wake.
The Red Cross estimates over 1200 deaths so far. The final toll could be significantly higher. Local media reports today say bodies of men, women and children are now washing on shore.
The enormous scale of Super Typhoon Haiyan can be vividly seen in space imagery captured by NASA, ISRO and Russian satellites – as well as astronaut Karen Nyberg flying overhead on board the International Space Station (ISS); collected here.
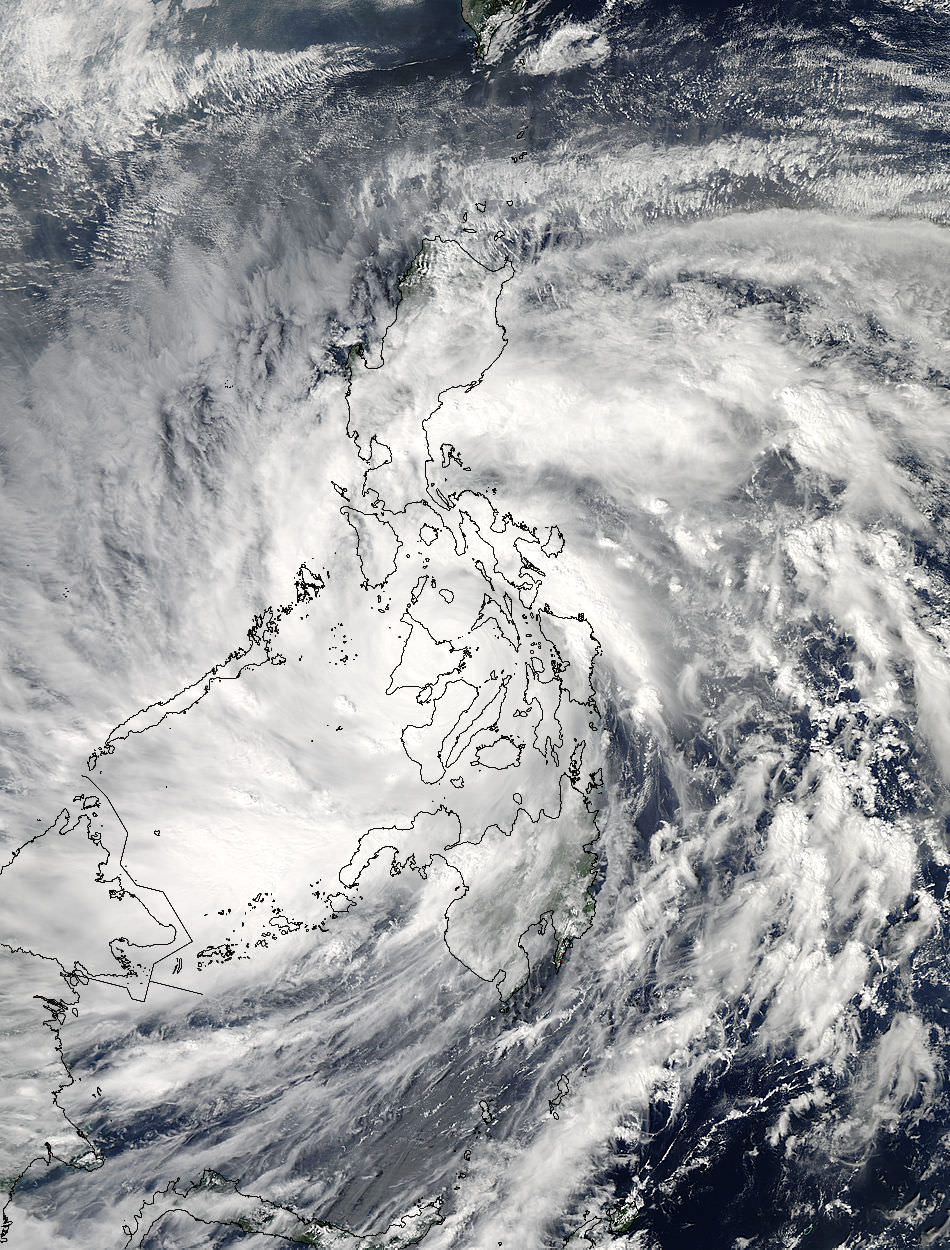
As Super-Typhoon Haiyan moved over the central Philippines on Nov. 8 at 05:10 UTC/12:10 a.m. EDT, the MODIS instrument aboard NASA’s Aqua satellite captured this visible image. Credit: NASA Goddard MODIS Rapid Response Team
Super Typhoon Haiyan is reported to be the largest and most powerful storm ever to make landfall in recorded human history.
Haiyan is classified as a Category 5 monster storm on the U.S. Saffir-Simpson scale.
It struck the central Philippines municipality of Guiuan at the southern tip of the province of Eastern Samar early Friday morning Nov. 8 at 20:45 UTC (4:45 am local time).
As Haiyan hit the central Philippines, NASA says wind gusts exceeded 235 mph (379 kilometers per hour).
The high resolution imagery and precise measurements provided by the worlds constellation of Earth observing space satellites (including NASA, Roscosmos, ISRO, ESA, JAXA) are absolutely essential to tracking killer storms and providing significant advance warning to evacuate residents in affected areas to help minimize the death toll and damage.
More than 800,000 people were evacuated. The storm surge caused waves exceeding 30 feet (10 meters), mudslides and flash flooding.
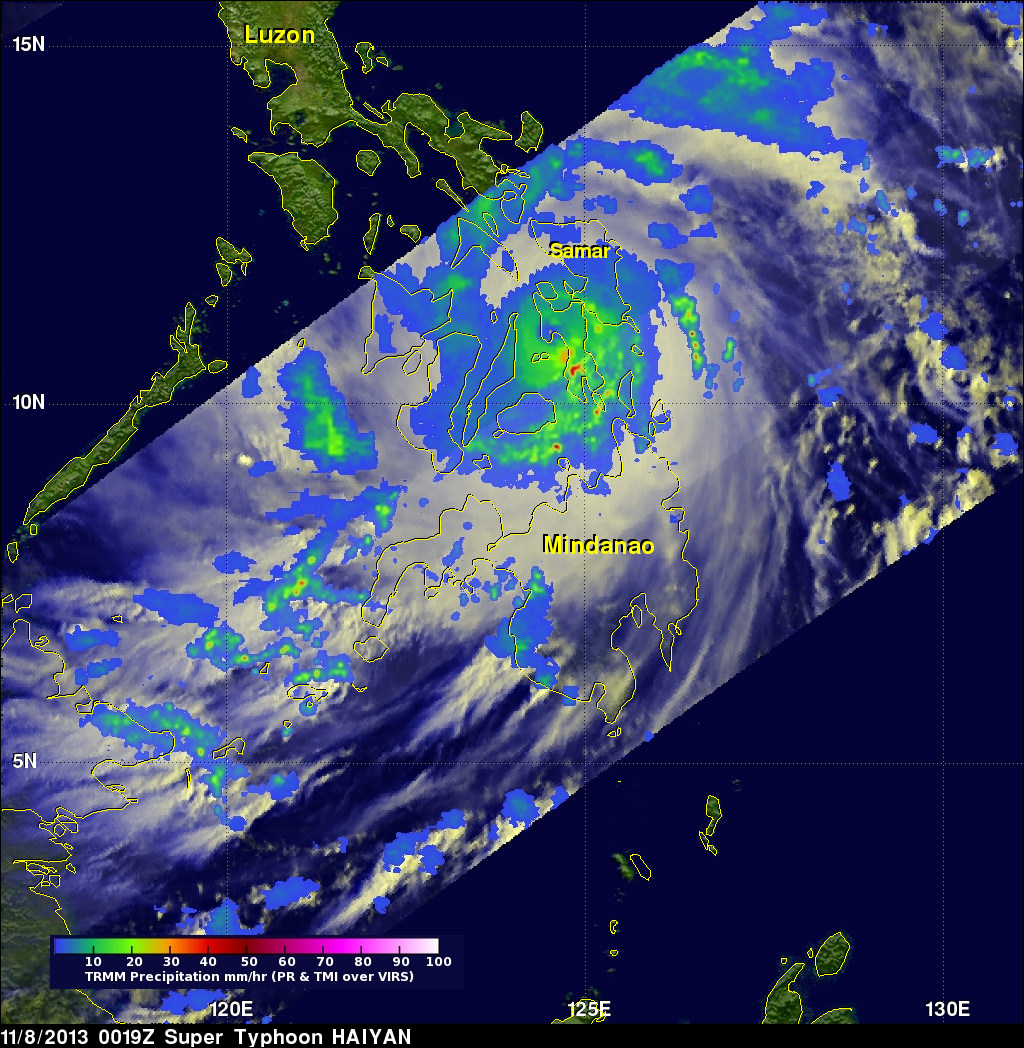
NASA’s Tropical Rainfall Measuring Mission (TRMM) satellite captured visible, microwave and infrared data on the storm just as it was crossing the island of Leyte in the central Philippines, reports NASA – see image below.
NASA’s TRMM satellite data on Nov. 8 at 00:19 UTC showed Haiyan had a well-defined eye surrounded by a symmetric area of moderate rain (green ring with a blue center) with several rainbands wrapping in from the south (green arcs) while crossing the island of Leyte in the central Philippines. Credit: NASA/SSAI, Hal Pierce
TRMM data from rain rates are measured by the TRMM Precipitation Radar (PR) and TRMM Microwave Imager (TMI) and combined with infrared (IR) data from the TRMM Visible Infrared Scanner (VIRS) by science teams working at NASA’s Goddard Space Flight Center in Greenbelt, Md.
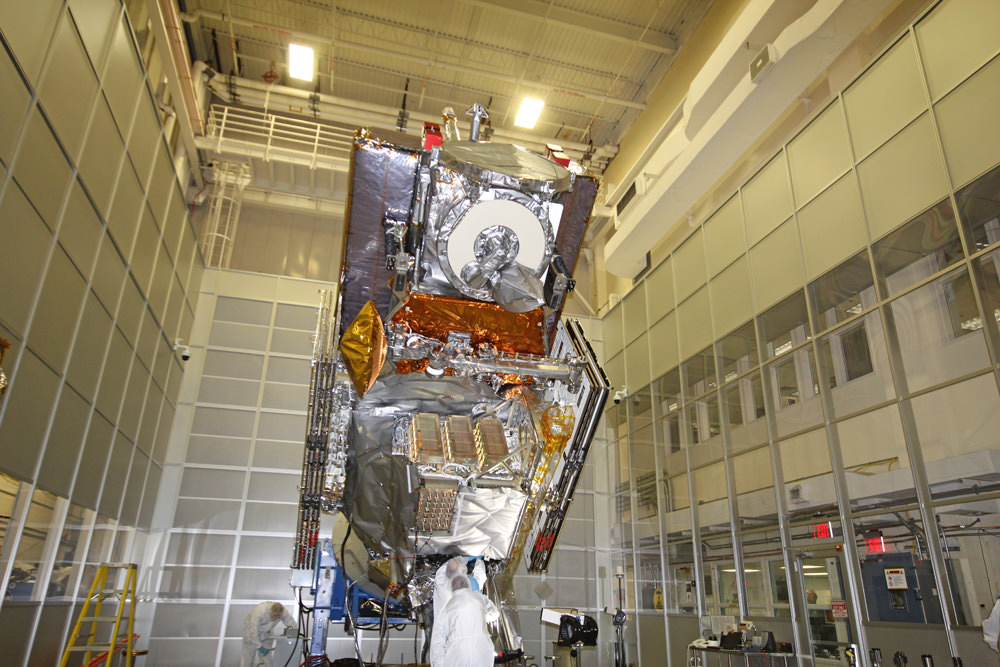
Coincidentally NASA Goddard has just completed assembly of the next generation weather satellite Global Precipitation Measurement (GPM) observatory that replaces TRMM – and where I inspected the GPM satellite inside the Goddard clean room on Friday.
“GPM is a direct follow-up to NASA’s currently orbiting TRMM satellite,” Art Azarbarzin, GPM project manager, told Universe Today during my exclusive clean room inspection of the huge GPM satellite.
NASA’s next generation Global Precipitation Measurement (GPM) observatory inside the clean room at NASA Goddard Space Flight Center. GPM is slated to launch In February 2014 and will provide global measurements of rain and snow every 3 hours – as a direct follow-up to NASA’s currently orbiting TRMM satellite; reaching the end of its usable lifetime.
Credit: Ken Kremer/kenkremer.com
“TRMM is reaching the end of its usable lifetime. GPM launches in February 2014 and we hope it has some overlap with observations from TRMM.”
“The Global Precipitation Measurement (GPM) observatory will provide high resolution global measurements of rain and snow every 3 hours,” Dalia Kirschbaum, GPM research scientist, told me at Goddard.
GPM is equipped with advanced, higher resolution radar instruments. It is vital to continuing the TRMM measurements and will help provide improved forecasts and advance warning of extreme super storms like Hurricane Sandy and Super Typhoon Haiyan, Azarbarzin and Kirschbaum explained.
Video Caption: Super Typhoon Haiyan imaged on Nov 6 – 8, 2013 by the Russian Elektro-L satellite operating in geostationary orbit. Credit: Roscosmos via Vitaliy Egorov
The full magnitude of Haiyan’s destruction is just starting to be assessed as rescue teams reach the devastated areas where winds wantonly ripped apart homes, farms, factories, buildings and structures of every imaginable type vital to everyday human existence.
Typhoon Haiyan is moving westward and is expected to forcefully strike central Vietnam in a day or two. Mass evacuations are underway at this time
Super Typhoon Haiyan imaged by the Russian Elektro-L satellite operating in geostationary orbit. Credit: Roscosmos via Vitaliy Egorov
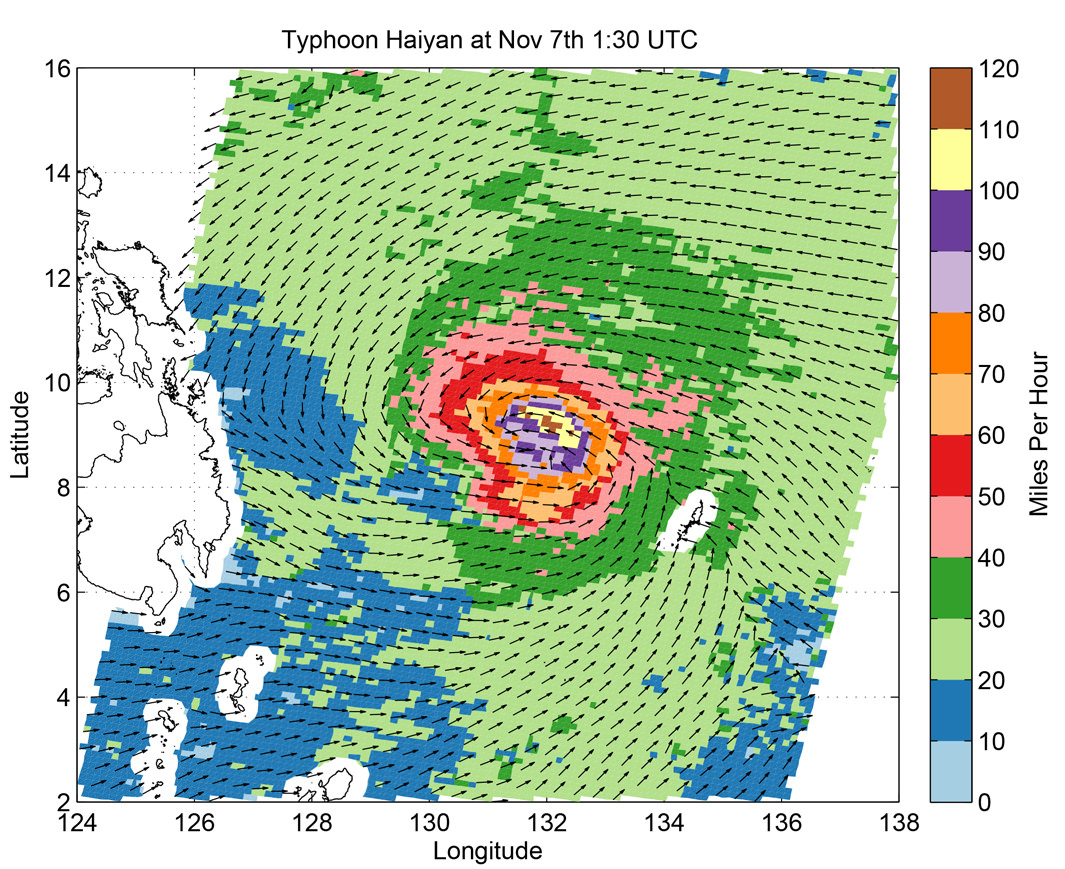
Super Typhoon Haiyan’s ocean surface winds were measured by the OSCAT radar scatterometer on the Indian Space Research Organization’s (ISRO) OceanSAT-2 satellite at 5:30 p.m. PST on Nov. 6. The colors indicate wind speed and arrows indicate wind direction. Credit: ISRO/NASA/JPL-Caltech
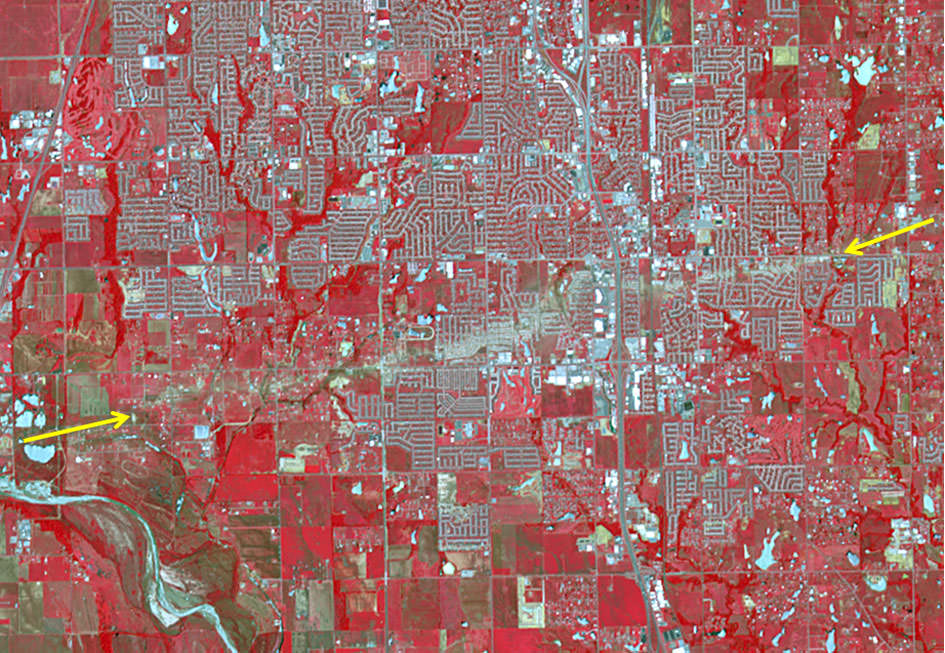
The track of the tornado that struck Moore, Oklahoma on May 20, 2013 is visible from space in this false color image taken on June 2, 2013 by the Advanced Spaceborne Thermal Emission and Reflection Radiometer (ASTER) on NASA’s Terra satellite.
The tornado that devastated the region around Moore and Newcastle, Oklahoma on May 20, 2013 has been determined to be an EF-5 tornado, the most severe on the enhanced Fujita scale, and has been called one of the most powerful and destructive tornadoes ever recorded. In this new image taken by the Advanced Spaceborne Thermal Emission and Reflection Radiometer (ASTER) on NASA’s Terra satellite, the scar of destruction on the Oklahoma landscape is clearly visible from space. In this false-color infrared image, red highlights vegetation, and the tornado track appears as a beige strip running west to east across this image; the color reveals the lack of vegetation in the wake of the storm.
According to the National Weather Service, the tornado was on the ground for 39 minutes, ripping across 17 miles (27 kilometers) from 4.4 miles west of Newcastle to 4.8 miles east of Moore. At its peak, the funnel cloud was 1.3 miles (2.1 kilometers) wide and wind speeds reached 210 miles (340 km) per hour. The storm killed at least 24 people, injured 377, and affected nearly 33,000 in some way.
In this image, infrared, red, and green wavelengths of light have been combined to better distinguish between water, vegetation, bare ground, and human developments. Water is blue. Buildings and paved surfaces are blue-gray.
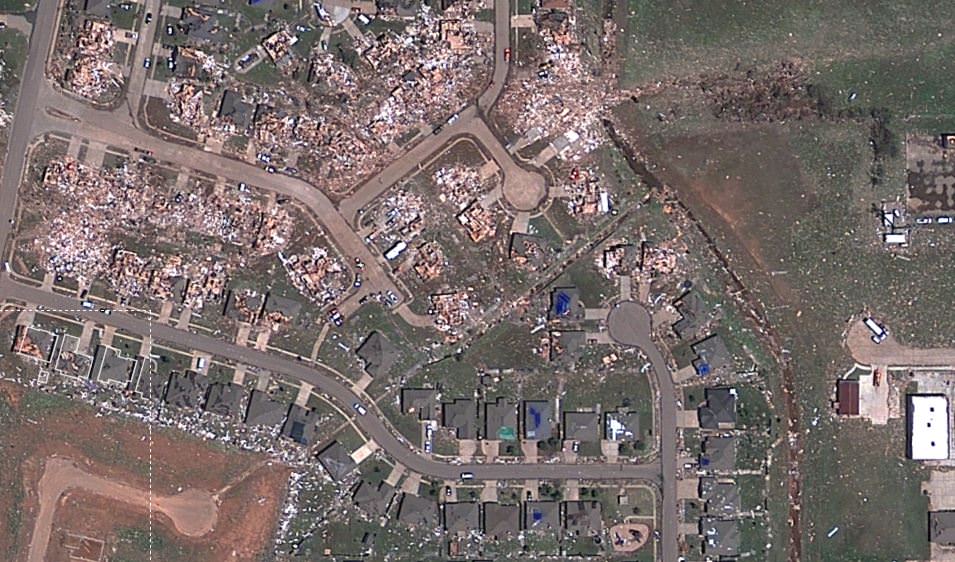
You can also see an interactive satellite map from Google and Digital Globe, showing detail of every building that was damaged or destroyed. Satellite data like this are helping to assist in the recovery and rebuilding of the area. Satellite imagery can provide a systematic approach to aiding, monitoring and evaluating the process.
Sceenshot of a satellite view from Google/Digital Globe of the destruction in Moore, Oklahoma after the May 20, 2013 tornado. Click image to have access to an interactive, zoomable version via NPR.
A new satellite map from Google and Digital Globe shows just-released satellite imagery of the damage from the tornado that struck the area of Moore, Oklahoma on May 20, 2013. It’s been called one of the most powerful and destructive tornadoes ever recorded — determined to be an EF5 tornado, the strongest rating for a tornado — and the destruction is heartbreaking. In the screenshot above, you can see how some houses were left undamaged, while others were completely destroyed.
Click on the image above to have access to an interactive map that shows hi-resolution views of the damage, providing details of where the buildings and houses once were. NPR put this map together, using satellite data from Digital Globe, along with property data from City of Oklahoma City, City of Moore, and Cleveland County. Satellite data like this are helping to assist the recovery and rescue teams on the ground.
In the immediate aftermath of a natural catastrophe such as this tornado, the priority is searching for survivors and saving lives.
But longer term recovery — including the rebuilding of infrastructure and amenities such as schools and hospitals — can take decades, and satellite imagery can provide a systematic approach to aiding, monitoring and evaluating this process.
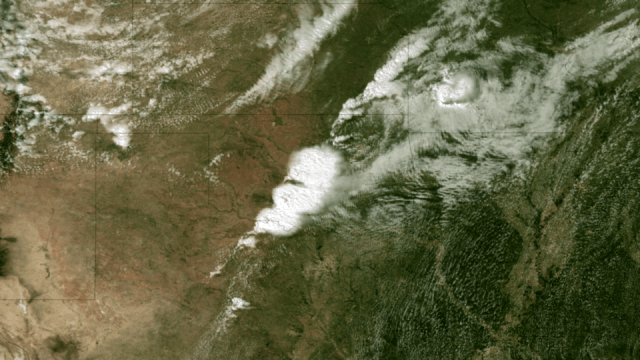
Satellite view of the destructive tornado that passed just south of Oklahoma City. The Moderate Resolution Imaging Spectroradiometer (MODIS) on NASA’s Aqua satellite acquired this image of the storm at 2:40 p.m. local time (19:40 UTC) on May 20, 2013. Credit: NASA image courtesy Jeff Schmaltz, LANCE/EOSDIS MODIS Rapid Response Team at NASA GSFC.
The Take Part website has a list of organizations that are providing support for the recovery and care of the people affected, if you would like to contribute.
Satellite Image of Oklahoma Tornado. Acquired at 2:55 CT on May 20, 2013, this image from the NOAA GOES-13 satellite shows the storms developing directly over central Oklahoma. One minute later an incredibly destructive tornado touched down in Moore, OK. Credit: NOAA.
The massive tornado that tore through parts of Oklahoma on My 20, 2013 left a 32 km (20-mile) swath of destruction and death, with winds approaching 320 km/hr (200 mph). The US National Weather Service said the 3 km (2-mile)-wide tornado spent 40 minutes on the ground in the area of Moore, Oklahoma, outside of Oklahoma City, destroying schools, a hospital and hundreds of homes, killing dozens of people. Satellite images and video show how the storm developed.
Below is a video showing satellite imagery from the GOES 13 satellite from May 19-20, 2013. It shows the tornado outbreak and supercell thunderstorms that developed across portions of the Great Plains:
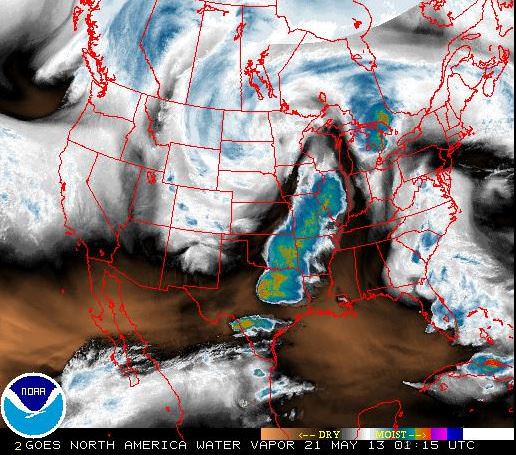
Weather satellites help scientists to observe weather patterns from the unique vantage point of space. This provides the ability to see a larger area of the Earth rather than with conventional radar which does not reveal a true overview of cloud structure and wind patterns.
These satellites can measure many different things, such as in the image below, which looks at water vapor content of the clouds. The satellites operated by NASA and NOAA and are equipped to send back images in infrared and other wavelengths, providing snapshots of things like the water vapor measurements, temperatures, wind patterns, cloud coverage, storm movement and many other readings. This information also helps with the prediction of storms, allowing for warnings for people to seek shelter from potentially destructive weather events.
This screenshot shows a false color view of the water vapor content in the clouds during the tornado outbreak in Oklahoma on May 20, 2013, as seen from NOAA geostationary (GOES) satellites. Click on image to go to current NOAA imagery.
The news from Oklahoma is ongoing, and we encourage you to keep current on the latest information from other news sites. But as Phil Plait pointed out, if you are interested in helping the people involved in this tragedy, the Take Part website has a list of organizations that are in the area providing support.
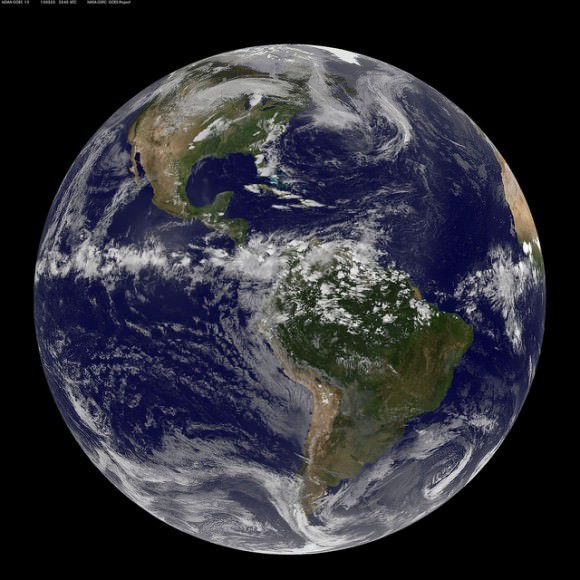
This full-disk view of Earth shows the formation of the Oklahoma tornado, from the Aqua satellite. Credit: NASA Goddard Space Flight Center.
Here’s a complete animation of Hurricane Sandy from October 23-31, as seen by GOES-13, a geosynchronous satellite that is in orbit nearly 36,000 km (23,000 miles) above Earth. This huge storm was costly in terms of death and destruction. The death toll currently stands at 160 (88 in the U.S., 54 in Haiti, 11 in Cuba), with damage estimates ranging from $10 – $55 billion.
Below is a timelapse animation which shows the full hemisphere view from GOES-13, showing the development of Hurricane Sandy as it begins over Central America and begins its path up through the Caribbean and the east coast of the U.S.
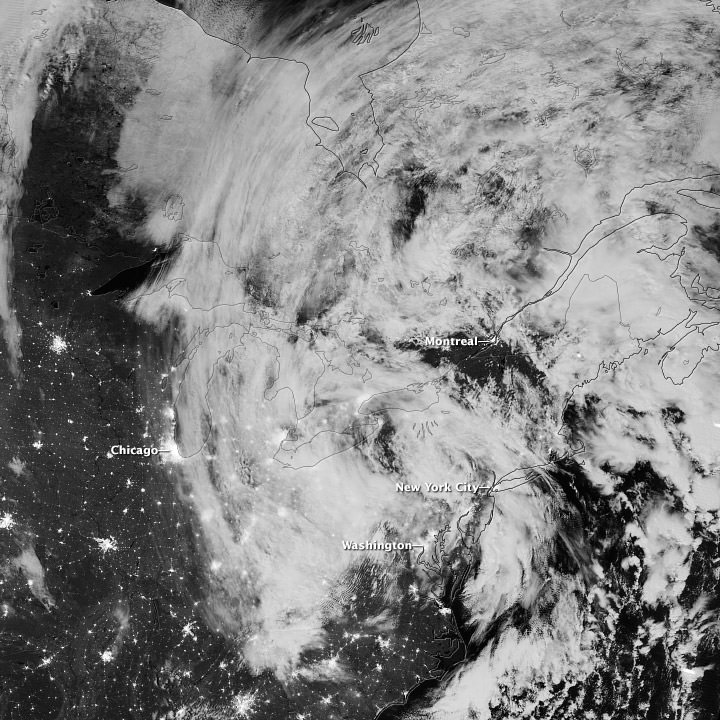
The Visible Infrared Imaging Radiometer Suite (VIIRS) on the Suomi NPP satellite acquired this image of the storm around 3:13 a.m. Eastern Daylight Time (7:13 Universal Time) on October 31. Credit: NASA/NOAA
This image from the Suomi NPP satellite shows remnants of Hurricane Sandy as it moved inland in the early morning hours of October 31, 2012. As the center of the system passed Pennsylvania, its maximum sustained winds were 40 miles (64 kilometers) per hour. This image is from the “day-night band” on VIIRS, which detects light wavelengths from green to near-infrared. The Moon lit the tops of the clouds.
Sandy’s clouds stretched from Hudson Bay to Chicago and Washington. Clusters of lights gave away the locations of some cities throughout the region; but along the East Coast, clouds mostly obscured the lights, many of which were blacked out due to the storm. On October 31, the Wall Street Journal reported that several million customers in multiple states were without electricity.
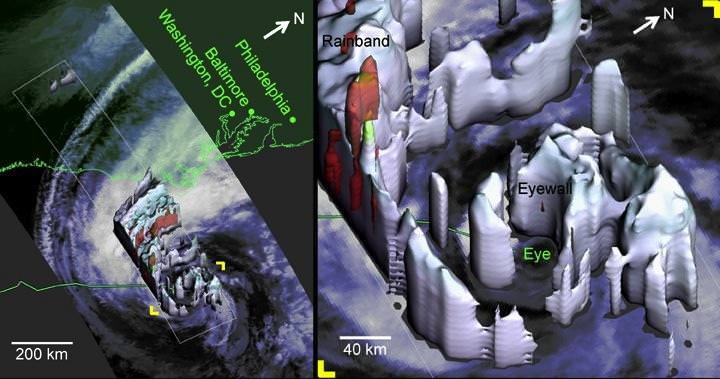
Hurricane Sandy as viewed by the TRMM Precipitation Radar at 2:20 EDT on Oct. 28, 2012. Credit: NASA
Satellite imagery and data has been invaluable in predicting the path and intensity of storms like Hurricane Sandy. Satellites like NASA’s Tropical Rainfall Measuring Mission (TRMM) can measure rainfall rates and cloud heights in tropical cyclones, and was used to create a 3-D image, above, to allow forecasters to look inside the hurricane, and predict fairly spot-on what locations would be affected the worst. There’s even a 3-D video view from the CloudSat satellite, and much more, including a stunning wind map, and this round-up from JPL of various satellite views of the storm. You can also see a slideshow of NASA satellite images and videos on the NASA Goddard Flickr site.
This exemplifies just one reason why space exploration is important, and why people are maybe now starting to realize how our failure to plan ahead and invest in weather satellites may become a problem. Without those eyes in the sky we are blind to the minute-to-minute and hour-to-hour development of storms and weather, not to mention overall study of the climate.
Below is a stunning high-speed satellite view from the GOES-14 satellite:
Focusing just on the area of the storm, the GOES-14 Super Rapid Scan Operation (SRSO) captures infrared and visible data every minute and relays that information to forecasters on the ground. This animation shows the GOES-14 SRSO for October 29, 2012 as Hurricane Sandy approached the U.S. coastline.