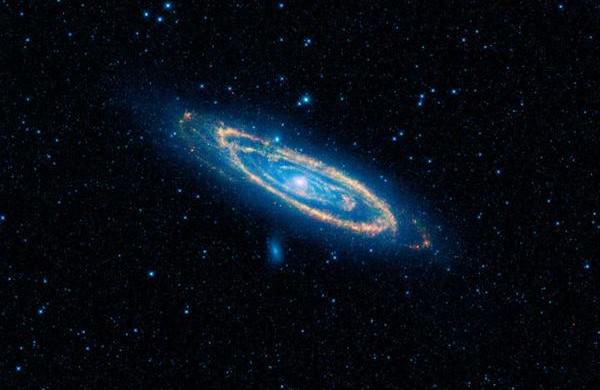
This is a false-color image of the mid-infrared emission from the Great Galaxy in Andromeda, as seen by Nasa's WISE space telescope. The orange color represents emission from the heat of stars forming in the galaxy's spiral arms. The G-HAT team used images such as these to search 100,000 nearby galaxies for unusually large amounts of this mid-infrared emission that might arise from alien civilizations.
Credit: NASA/JPL-Caltech/WISE Team
Beam us up, Scotty. There’s no signs of intelligent life out there. At least, no obvious signs, according to a recent survey performed by researchers at Penn State University. After reviewing data taken by the NASA Wide-field Infrared Survey Explorer (WISE) space telescope of over 100,000 galaxies, there appears to be little evidence that advanced, spacefaring civilizations exist in any of them.
First deployed in 2009, the WISE mission has been able to identify thousands of asteroids in our solar system and previously undiscovered star clusters in our galaxy. However, Jason T. Wright, an assistant professor of astronomy and astrophysics at the Center for Exoplanets and Habitable Worlds at Penn State University, conceived of and initiated a new field of research – using the infrared data to assist in the search for signs of extra-terrestrial civilizations.
And while their first look did not yield much in the way of results, it is an exciting new area of research and provides some very useful information on one of the greatest questions ever asked: are we alone in the universe?
“The idea behind our research is that, if an entire galaxy had been colonized by an advanced spacefaring civilization, the energy produced by that civilization’s technologies would be detectable in mid-infrared wavelengths,” said Wright, “exactly the radiation that the WISE satellite was designed to detect for other astronomical purposes.”
This logic is in keeping with the theories of Russian astronomer Nikolai Kardashev and theoretical physicist Freeman Dyson. In 1964, Kardashev proposed that a civilization’s level of technological advancement could be measured based on the amount of energy that civilization is able to utilize.
Freemon Dyson theorized that eventually, a civilization would be able to enclose its star with a megastructure that would to capture and utilize its energy. Credit: sentientdevelopments.com
To characterize the level of extra-terrestrial development, Kardashev developed a three category system – Type I, II, and III civilizations – known as the “Kardashev Scale”. A Type I civilization uses all available resources on its home planet, while a Type II is able to harness all the energy of its star. Type III civilizations are those that are advanced enough to harness the energy of their entire galaxy.
Similarly, Dyson proposed in 1960 that advanced alien civilizations beyond Earth could be detected by the telltale evidence of their mid-infrared emissions. Believing that a sufficiently advanced civilization would be able to enclose their parent star, he believed it would be possible to search for extraterrestrials by looking for large objects radiating in the infrared range of the electromagnetic spectrum.
These thoughts were expressed in a short paper submitted to the journal Science, entitled “Search for Artificial Stellar Sources of Infrared Radiation“. In it, Dyson proposed that an advanced species would use artificial structures – now referred to as “Dyson Spheres” (though he used the term “shell” in his paper) – to intercept electromagnetic radiation with wavelengths from visible light downwards and radiating waste heat outwards as infrared radiation.
“Whether an advanced spacefaring civilization uses the large amounts of energy from its galaxy’s stars to power computers, space flight, communication, or something we can’t yet imagine, fundamental thermodynamics tells us that this energy must be radiated away as heat in the mid-infrared wavelengths,” said Wright. “This same basic physics causes your computer to radiate heat while it is turned on.”
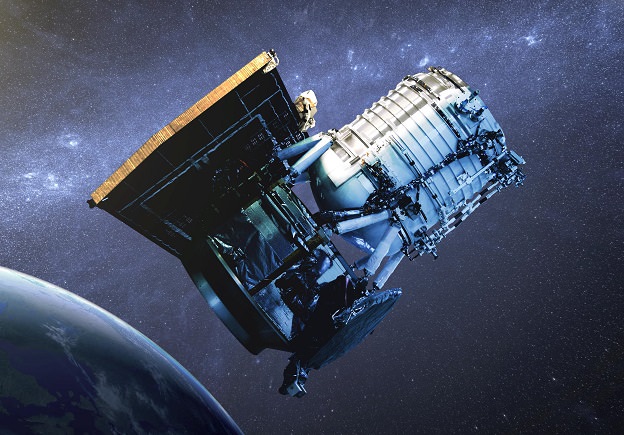
The Wide-field Infrared Survey Explorer (WISE) scans the entire sky in infrared light, picking up the glow of hundreds of millions of objects and producing millions of images. Credit: NASA/JPL-Caltech
However, it was not until space-based telescopes like WISE were deployed that it became possible to make sensitive measurements of this radiation. WISE is one of three infrared missions currently in space, the other two being NASA’s Spitzer Space Telescope and the Herschel Space Observatory – a European Space Agency mission with important NASA participation.
WISE is different from these missions in that it surveys the entire sky and is designed to cast a net wide enough to catch all sorts of previously unseen cosmic interests. And there are few things more interesting than the prospect of advanced alien civilizations!
To search for them, Roger Griffith – a postbaccalaureate researcher at Penn State and the lead author of the paper – and colleagues scoured the entries in the WISE satellites database looking for evidence of a galaxy that was emitting too much mid-infrared radiation. He and his team then individually examined and categorized 100,000 of the most promising galaxy images.
And while they didn’t find any obvious signs of a Type II civilization or Dyson Spheres in any of them, they did find around 50 candidates that showed unusually high levels of mid-infrared radiation. The next step will be to confirm whether or not these signs are due to natural astronomical processes, or could be an indication of a highly advanced civilization tapping their parent star for energy.
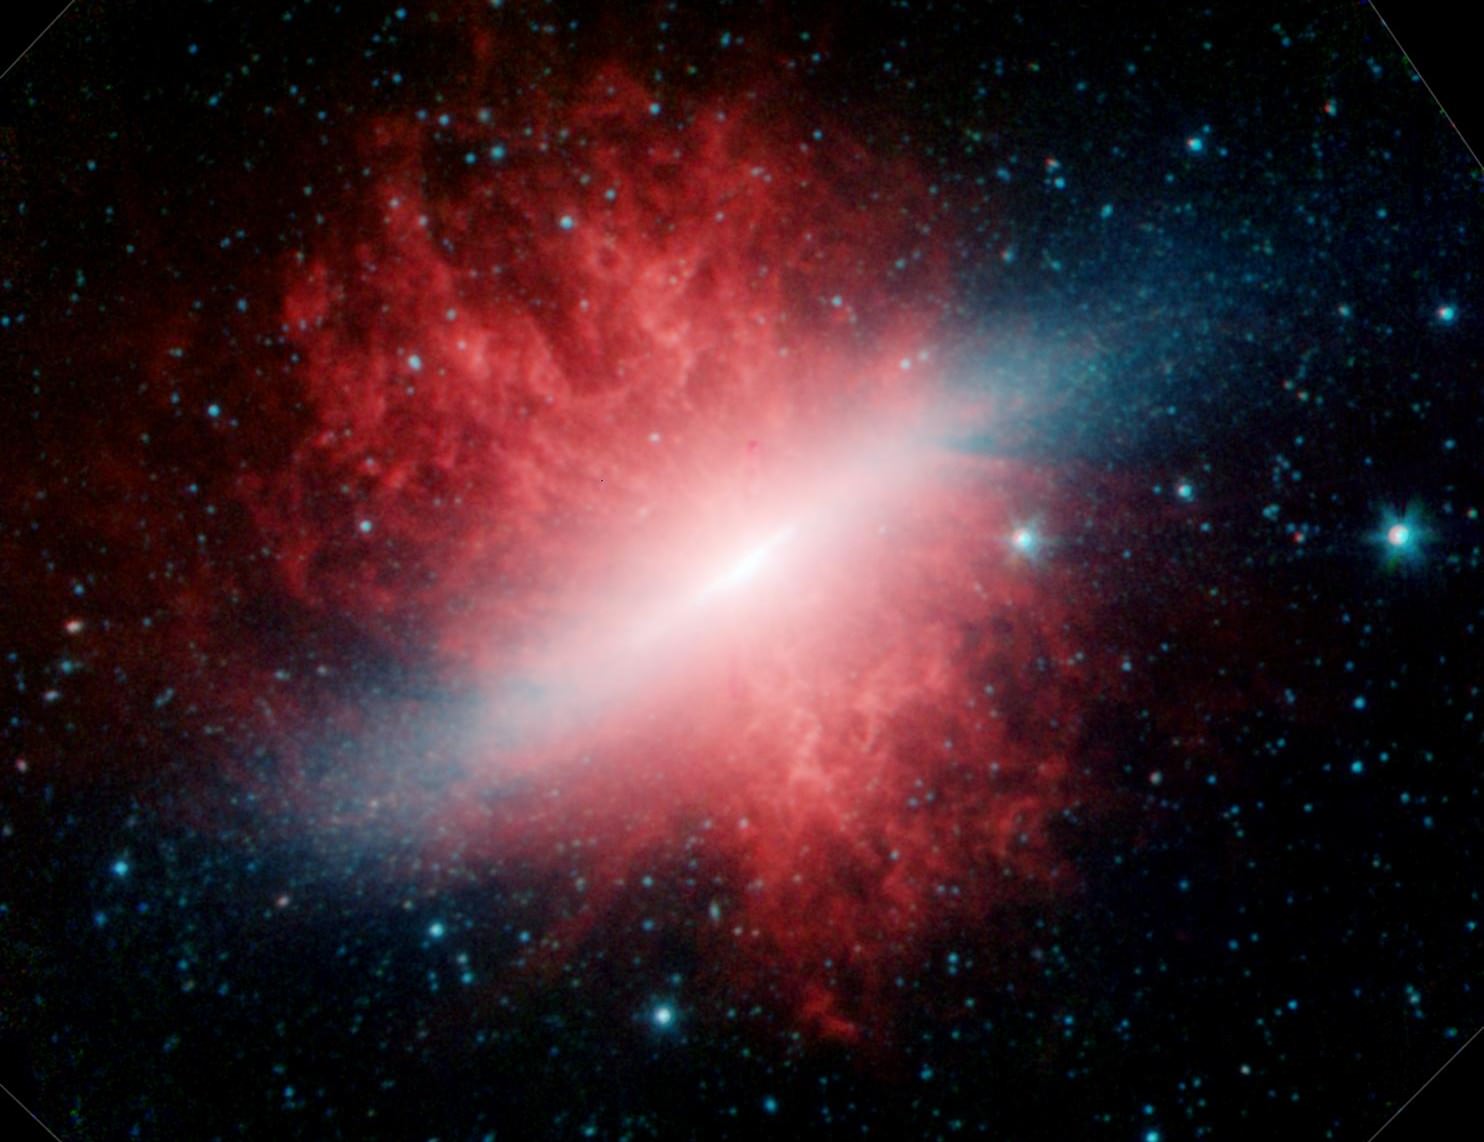
WISE will take images of the most luminous galaxies in the universe, such as the “Cigar” galaxy shown here – taken by NASA’s Spitzer Space Telescope. Credit: NASA/JPL-Caltech/Steward Observatory
In any case, the team’s findings were quite interesting and broke new ground in what is sure to be an ongoing area of research. The only previous study, according to the G-HAT team, surveyed only about 100 galaxies, and was unable to examine them in the infrared to see how much heat they emitted. What’s more, the research may help shed some light on the burning questions about the very existence of intelligent, extra-terrestrial life in our universe.
“Our results mean that, out of the 100,000 galaxies that WISE could see in sufficient detail, none of them is widely populated by an alien civilization using most of the starlight in its galaxy for its own purposes,” said Wright. “That’s interesting because these galaxies are billions of years old, which should have been plenty of time for them to have been filled with alien civilizations, if they exist. Either they don’t exist, or they don’t yet use enough energy for us to recognize them.”
Alas, it seems we are no closer to resolving the Fermi Paradox. But for the first time, it seems that investigations into the matter are moving beyond theoretical arguments. And given time, and further refinements in our detection methods, who knows what we might find lurking out there? The universe is very, very big place, after all.
The research team’s first research paper about their Glimpsing Heat from Alien Technologies Survey (G-HAT) survey appeared in the Astrophysical Journal Supplement Series on April 15, 2015.
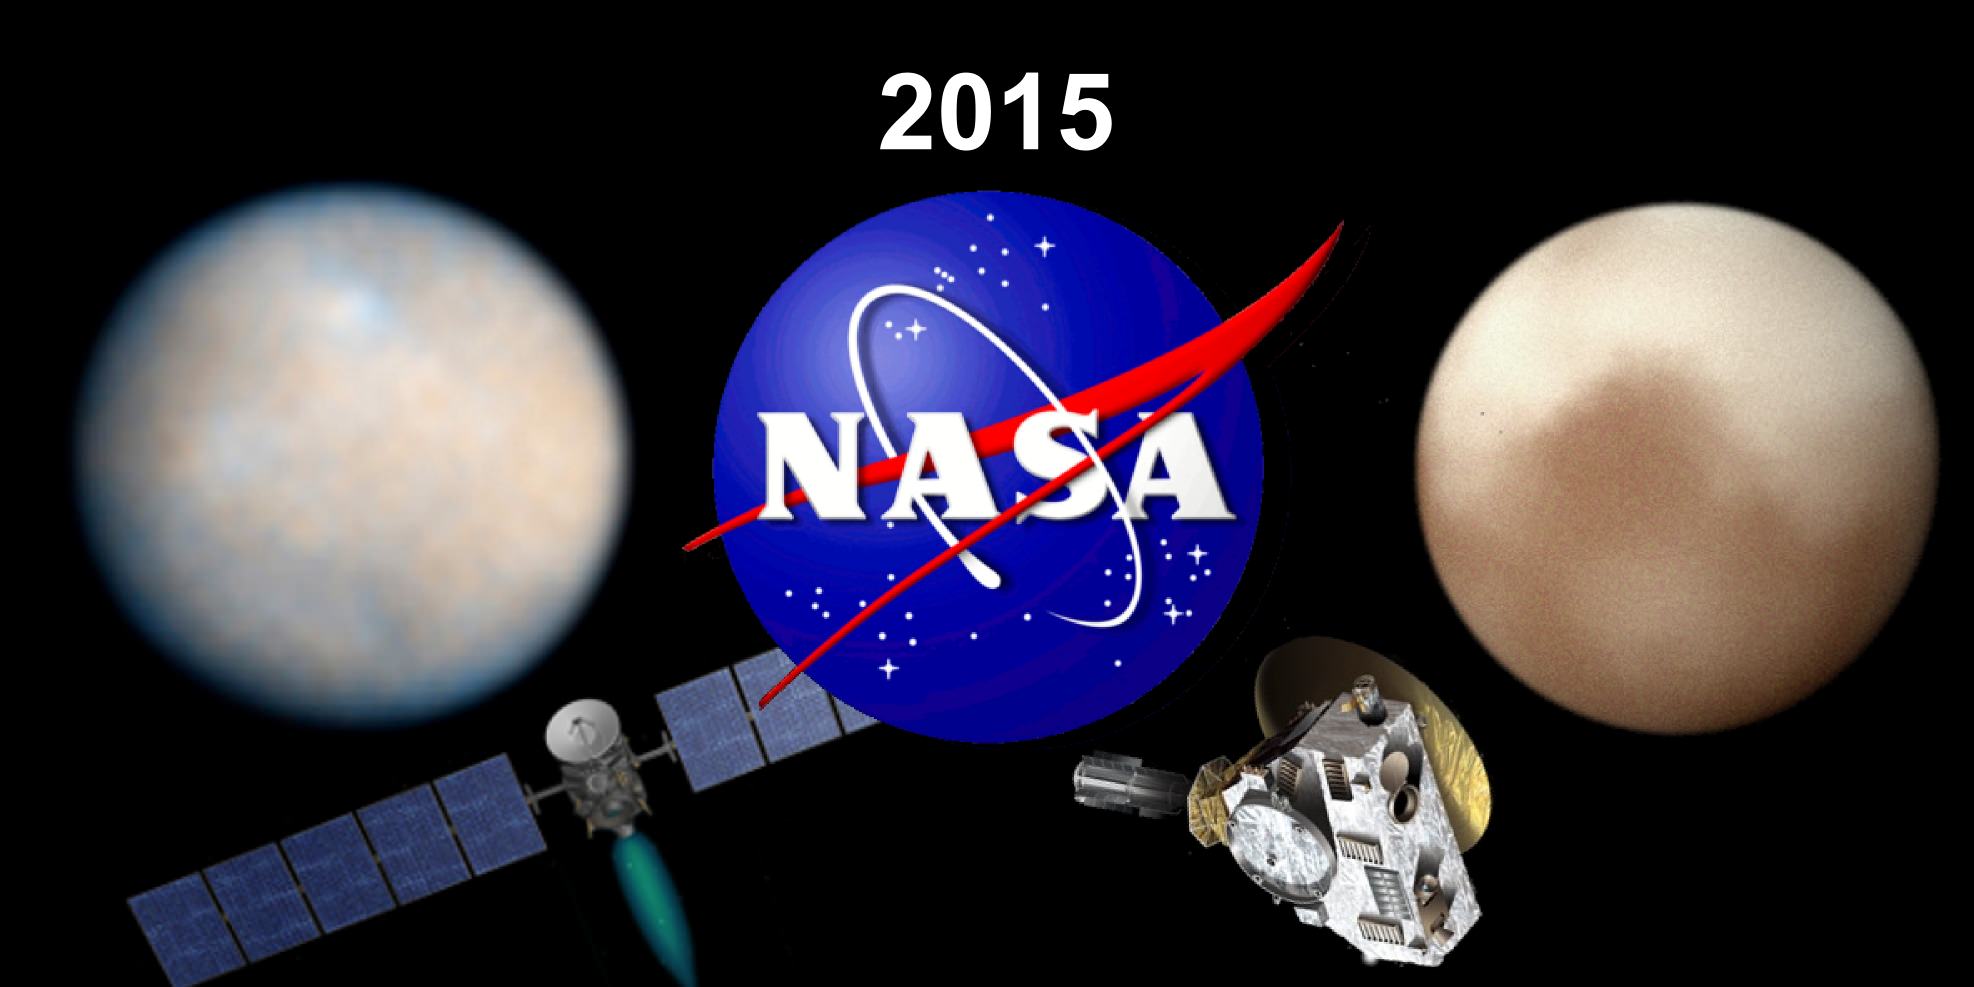
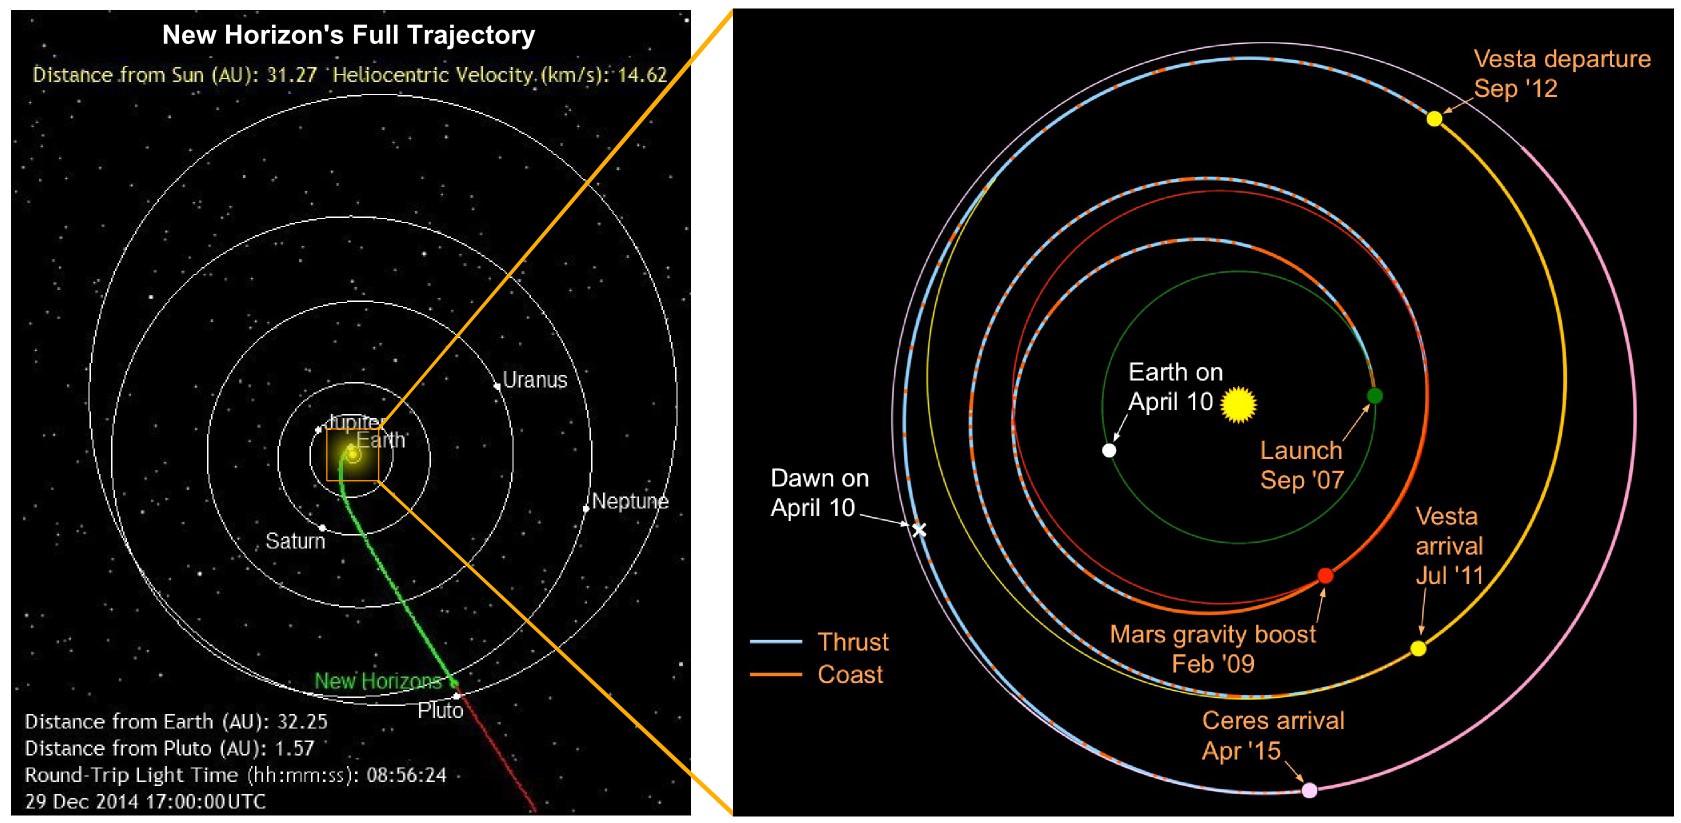
Two spacecraft, Dawn and New Horizon will reach their final objectives in 2015 - Dwarf Planets - Ceres and Pluto. (Credit: NASA, Illustration - T.Reyes)
Together, the space probes Dawn and New Horizons have been in flight for a collective 17 years. One remained close to home and the other departed to parts of the Solar System of which little is known. They now share a common destination in the same year: dwarf planets.
At the time of these NASA probes’ departures, Ceres had just lost its designation as the largest asteroid in our Solar System. Pluto was the ninth planet. Both probes now stand to deliver measures of new data and insight that could spearhead yet another revision of the definition of planet.
A comparison of the trajectories of New Horizons (left) and the Dawn missions (right). (Credit: NASA/JPL, SWRI, Composite- T.Reyes)
Certainly, NASA’s Year of the Dwarf Planet is an unofficial designation and NASA representatives would be quick to emphasize another dozen or more missions that are of importance during the year 2015. However, these two missions could determine the fate of billions or more small bodies just within our galaxy, the Milky Way.
If Ceres and Pluto are studied up close – mission success is never a sure thing – then what is observed could lead to a new, more certain and accepted definition of planet, dwarf planet, and possibly other new definitions.
The New Horizons mission became the first mission of NASA’s New Frontiers program, beginning development in 2001. The probe was launched on January 19, 2006, atop an Atlas V 551 (5 solid rocket boosters plus a third stage). Utilizing more compact and lightweight electronics than its predecessors to the outer planets – Pioneer 10 & 11, and Voyager 1 & 2 – the combination of reduced weight, a powerful launch vehicle, plus a gravity assist from Jupiter has lead to a nine year journey. On December 6, 2014, New Horizons was taken out of hibernation for the last time and now remains powered on until the Pluto encounter.
This “movie” of Pluto and its largest moon, Charon, by NASA’s New Horizons spacecraft taken in July 2014 clearly shows that the barycenter – the center of mass of the two bodies – resides outside (between) both bodies. The 12 images that make up the movie were taken by the spacecraft’s best telescopic camera – the Long Range Reconnaissance Imager (LORRI) – at distances ranging from about 267 million to 262 million miles (429 million to 422 million kilometers). Charon is orbiting approximately 11,200 miles (about 18,000 kilometers) above Pluto’s surface. (Credit: NASA/Johns Hopkins University Applied Physics Laboratory/Southwest Research Institute)
The arrival date of New Horizon is July 14, 2015. A telescope called the Long Range Reconnaissance Imager (LORRI) has permitted the commencement of observations while still over 240 million kilometers (150 million miles) from Pluto. The first stellar-like images were taken while still in the Asteroid belt in 2006.
Pluto was once the ninth planet of the Solar System. From its discovery in 1930 by Clyde Tombaugh until 2006, it maintained this status. In that latter year, the International Astronomical Union undertook a debate and then a membership vote that redefined what a planet is. The change occurred 8 months after New Horizons’ launch. There were some upset mission scientists, foremost of which was the principal investigator, Dr. Alan Stern, from the Southwest Research Institute in San Antonio, Texas. In a sense, the rug had been pulled from under them.
A gentleman’s battle ensued between opposing protagonists Dr. Stern and Dr. Michael Brown from Caltech. In 2001, Dr. Brown’s research team began to discover Kuiper belt objects (Trans-Neptunian objects) that rivaled the size of Pluto. Pluto suddenly appeared to be one of many small bodies that could likely number in the trillions within just one galaxy – ours. According to Dr. Brown, there could be as many as 200 objects in our Solar System similar to Pluto that, under the old definition, could be defined as planets. Dr. Brown’s work was the straw that broke the camel’s back – that is, it led to the redefinition of planet, and the native of Huntsville, Alabama, went on to write a popular book, How I Killed Pluto and Why It Had It Coming.
Dr. Stern’s story involving Pluto and planetary research is a longer and more circuitous one. Stern was the Executive Director of the Southwest Research Institute’s Space Science and Engineering Division and then accepted the position of Associate Administrator of NASA’s Science Mission Directorate in 2007. Clearly, after a nine year journey, Stern is now fully committed to New Horizons’ close encounter. More descriptions of the two protagonists of the Pluto debate will be included in a follow on story.
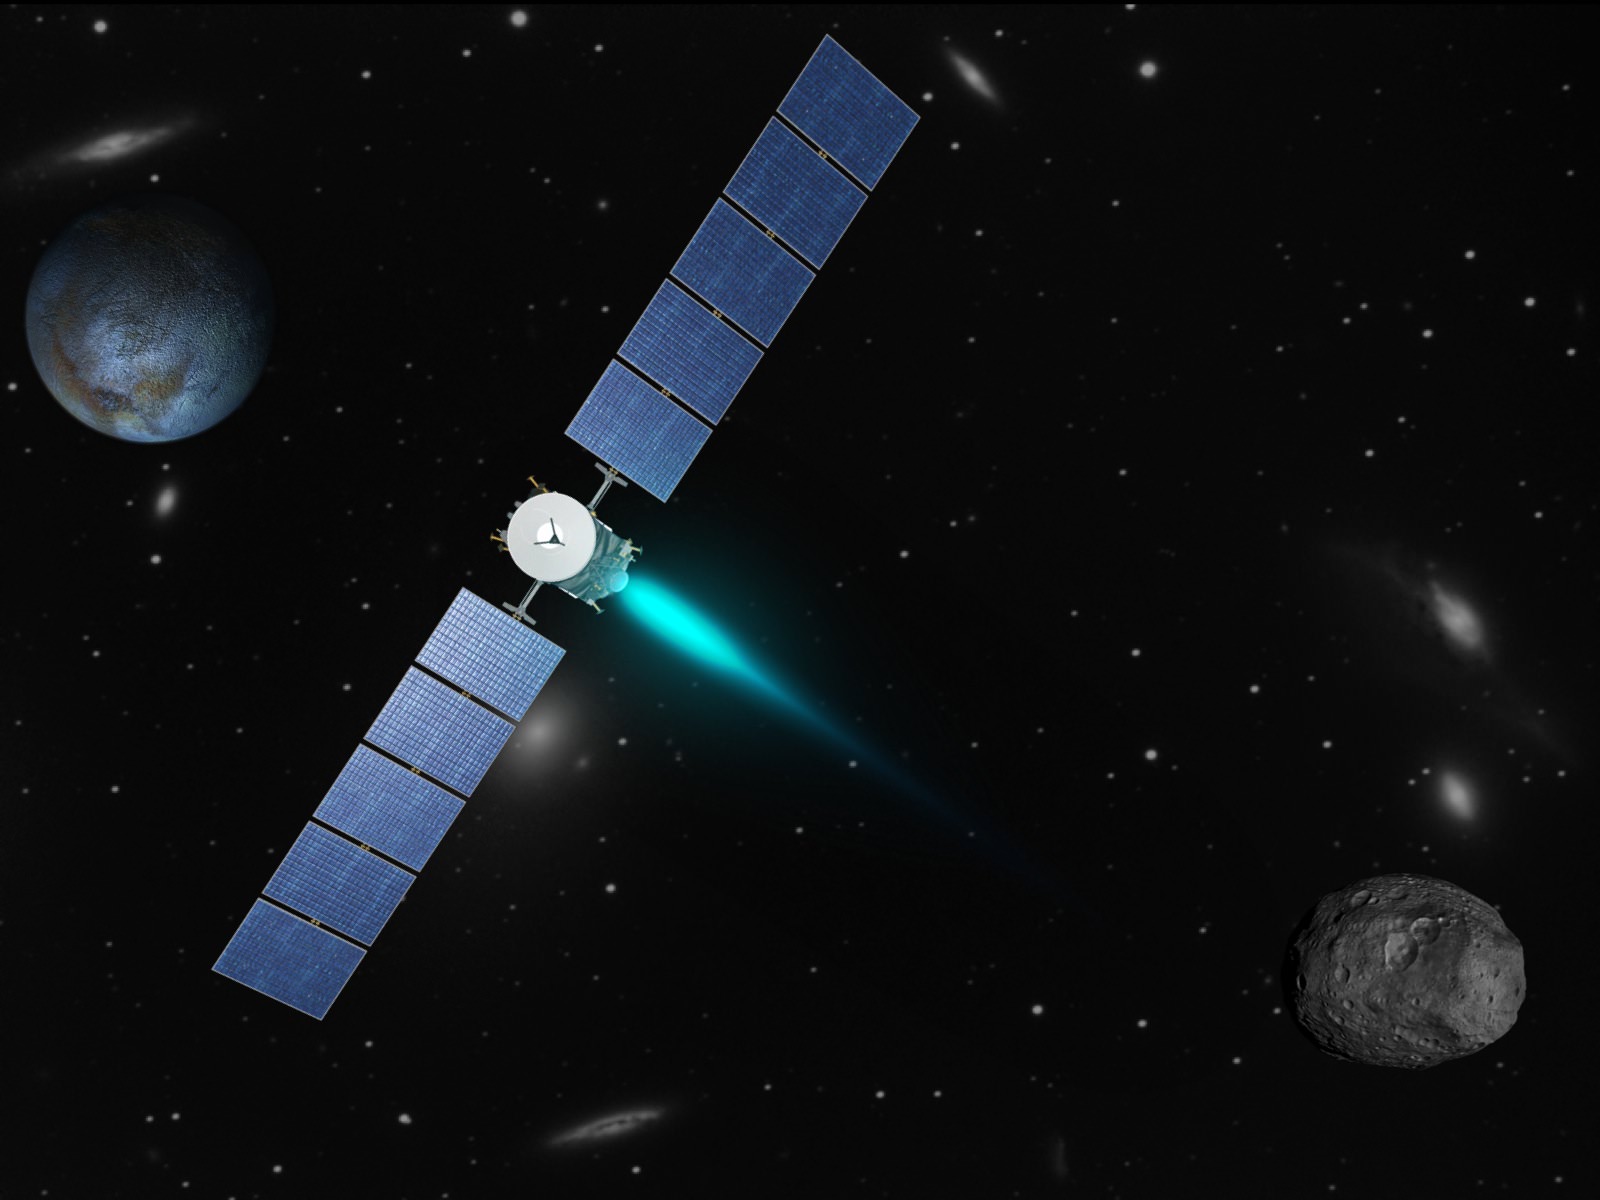
Artist’s concept depicting the Dawn spacecraft thrusting with its ion propulsion system as it travels from Vesta (lower right) to Ceres (upper left). The galaxies in the background are part of the Virgo supercluster. Dawn, Vesta, and Ceres are currently in the constellation Virgo from the perspective of viewers on Earth. (Image credit: NASA/JPL)
The JPL and Orbital Science Corporation developed Dawn space probe began its journey to the main asteroid belt on September 27, 2007. It has used gravity assists and flew by the planet Mars. Dawn spent 14 months surveying Vesta, the 4th largest asteroid of the main belt (assuming Ceres is still considered the largest). While New Horizons has traveled over 30 Astronomical Units (A.U.) – 30 times the distance from the Earth to the Sun – Dawn has remained closer and required reaching a little over 2 A.U. to reach Vesta and now 3 A.U. to reach Ceres.
The Dawn mission had the clear objective of rendezvous and achieving orbit with two asteroids in the main belt between Mars and Jupiter. Dawn was also sent packing the next generation of Ion Propulsion. It has proven its effectiveness very well, having used ion propulsion for the first time to achieve an orbit. Pretty simple, right? Not so fast.
As Dawn was passing critical design reviews during development, the redefinition of planet lofted its second objective – the asteroid 1 Ceres – to a new status. While Pluto was demoted, Ceres was promoted from its scrappy status of biggest of the asteroids – the debris, the leftovers of our solar system’s development – to dwarf planet. Even 4 Vesta is now designated a proto-planet.
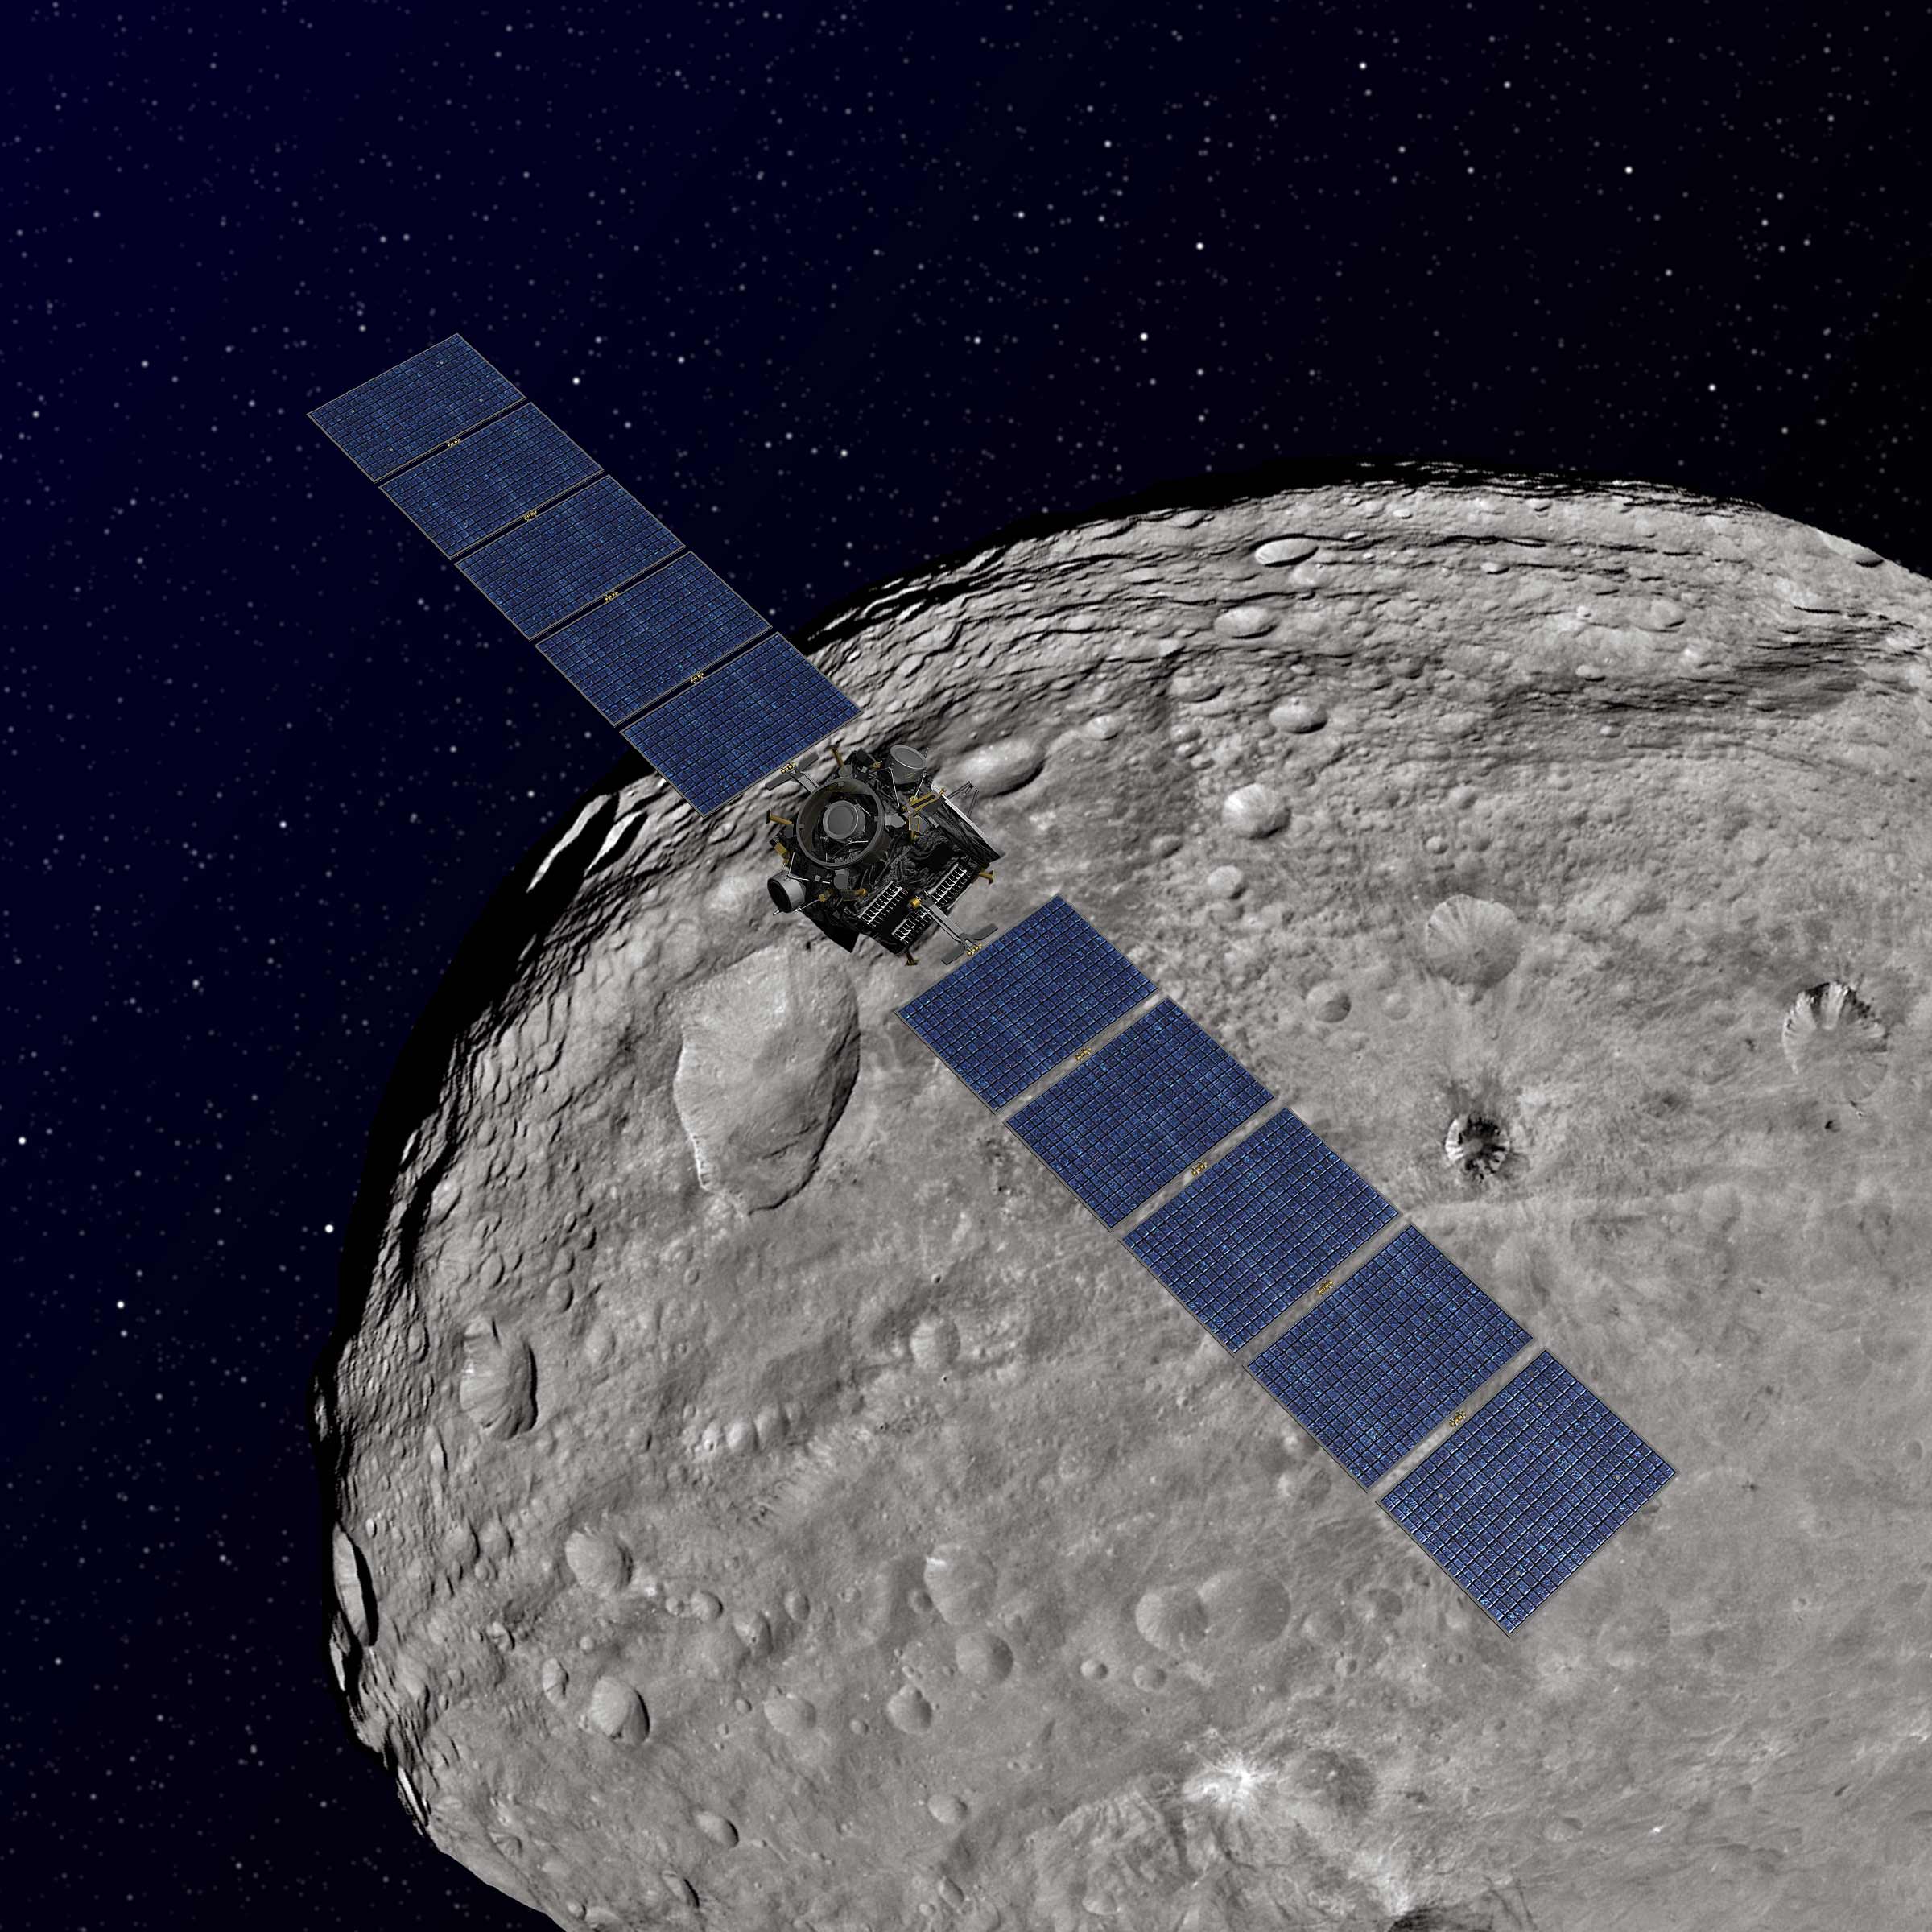
Artist rendition of Dawn spacecraft orbiting Vesta. (Credit: NASA/JPL-Caltech)
So now the stage is set. Dawn will arrive first at a dwarf planet – Ceres – in April. With a small, low gravity body and ion propulsion, the arrival is slow and cautious. If the two missions fair well and achieve their goals, 2015 is likely to become a pivotal year in the debate over the classification of non-stellar objects throughout the universe.
Just days ago, at the American Geophysical Union Conference in San Francisco, Dr. Stern and team described the status and more details of the goals of New Horizons. Since arriving, more moons of Pluto have been discovered. There is the potential that faint rings exist and Pluto may even harbor an interior ocean due to the tidal forces from its largest moon, Charon. And Dawn mission scientists have seen the prospects for Ceres’ change. Not just the status, the latest Hubble images of Ceres is showing bright spots which could be water ice deposits and could also harbor an internal ocean.
The Solar System is becoming a more crowded place. This picture shows the sizes of dwarf planets Pluto, Ceres, Eris, and Makemake as compared to Earth and Earth’s Moon, here called “Luna.” None of the distances between objects are to scale. (Credit: NASA)
So other NASA missions notwithstanding, this is the year of the dwarf planet. NASA will provide Humanity with its first close encounters with the most numerous of small round – by their self-gravity – bodies in the Universe. They are now called dwarf planets but ask Dr. Stern and company, the public, and many other planetary scientists and you will discover that the jury is still out.
After a 20 month trek across Mars and careful analysis of data, NASA scientists have announced two separate detection of organics - in the surface and the air of Mars. (Photo Credit: NASA/JPL, Illustration - T. Reyes)
On Tuesday, December 16, 2014, NASA scientists attending the American Geophysical Union Fall Meeting in San Francisco announced the detection of organic compounds on Mars. The announcement represents the discovery of the missing “ingredient” that is necessary for the existence – past or present – of life on Mars.
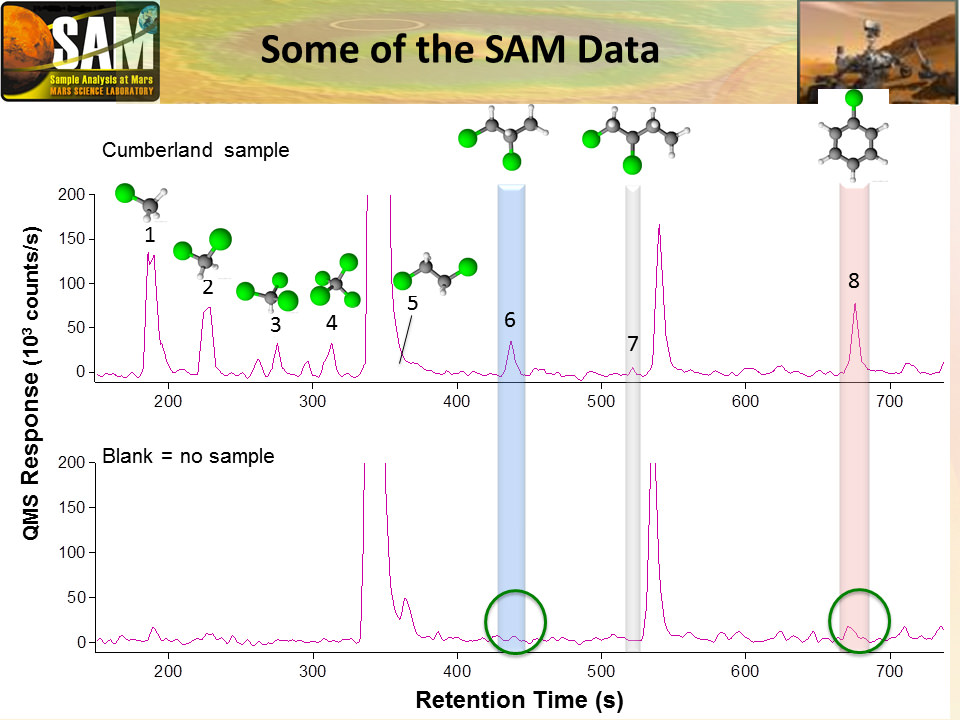
Indeed, the extraordinary claim required extraordinary evidence – the famous assertion of Dr. Carl Sagan. The scientists, members of the Mars Science Lab – Curiosity Rover – mission, worked over a period of 20 months to sample and analyze Martian atmospheric and surface samples to arrive at their conclusions. The announcement stems from two separate detections of organics: 1) ten-fold spikes in atmospheric Methane levels, and 2) drill samples from a rock called Cumberland which included complex organic compounds.
The Tunable Laser Spectrometer, one of the tools within the Sample Analysis at Mars (SAM) laboratory on NASA’s Curiosity Mars rover. By measuring absorption of light at specific wavelengths, it measures concentrations of methane, carbon dioxide and water vapor in Mars’ atmosphere. (Image Credit: NASA/JPL-Caltech)
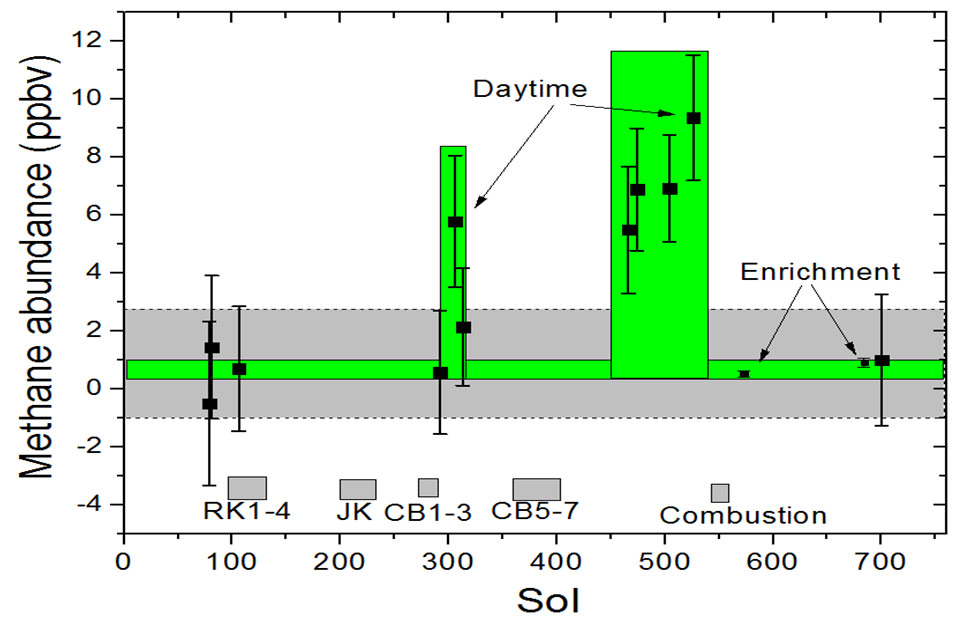
Methane, of the simplest organic compounds, was detected using the Sample Analysis at Mars instrument (SAM). This is one of two compact laboratory instruments embedded inside the compact car-sized rover, Curiosity. Very soon after landing on Mars, the scientists began to use SAM to periodically measure the chemical content of the Martian atmosphere. Over many samples, the level of Methane was very low, ~0.9 parts per billion. However, that suddenly changed and, as scientists stated in the press conference, it was a “wow” moment that took them aback. Brief daily spikes in Methane levels averaging 7 parts per billion were detected.
The detection of methane at Mars has been claimed for decades, but more recently, in 2003 and 2004, independent research teams using sensitive spectrometers on Earth detected methane in the atmosphere of Mars. One group led by Vladimir Krasnopolsky of Catholic University, and another led by Dr. Michael Mumma from NASA Goddard Space Flight Center, detected broad regional and temporal levels of Methane as high as 30 parts per billion. Those announcements met with considerable skepticism from the scientific community. And the first atmospheric measurements by Curiosity were negative. However, neither group backed down from their claims.
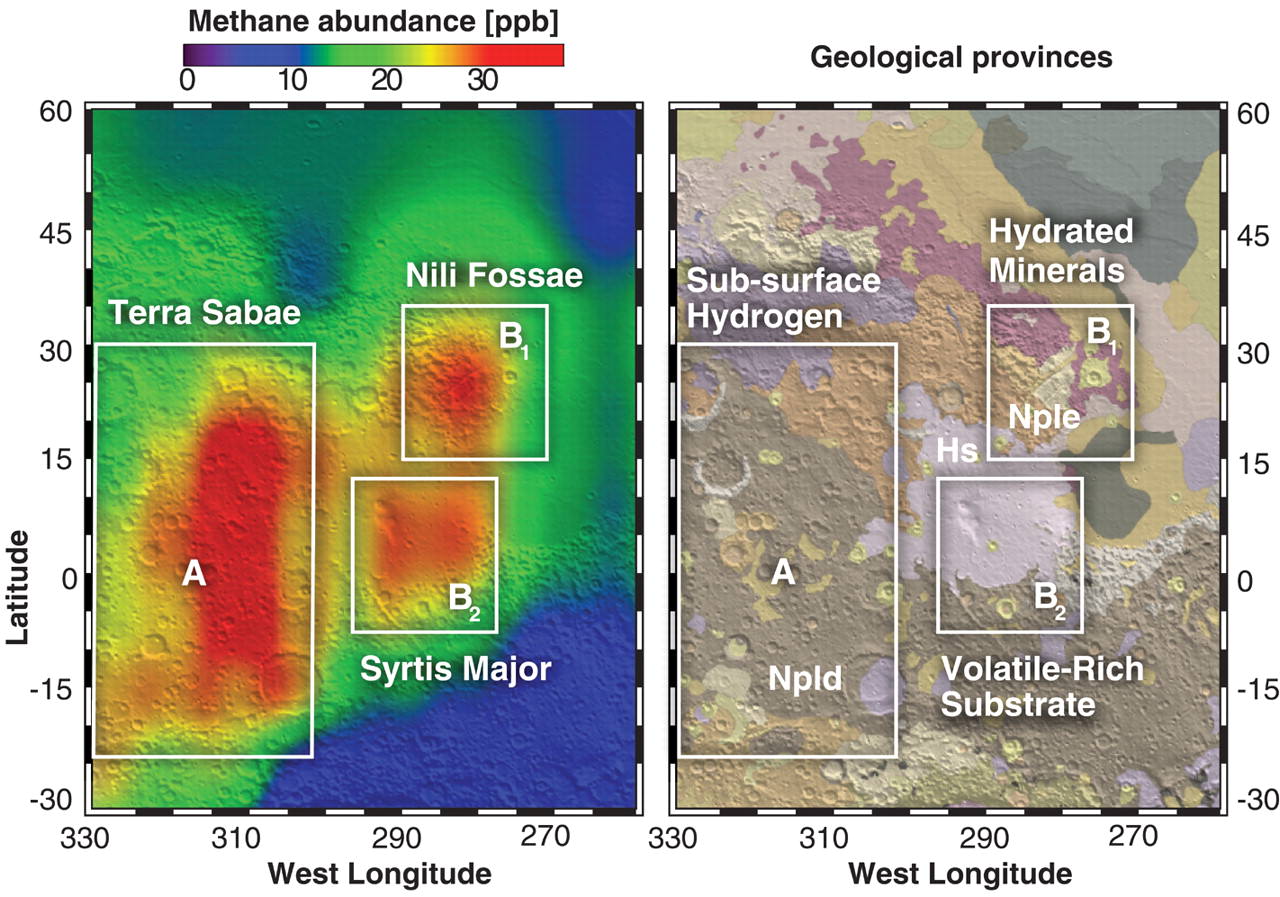
Regions where methane appears notably localized in Northern Summer (A, B1, B2), and their relationship to mineralogical and geo-morphological domains. (A.) Observations of methane near the Syrtis Major volcanic district. (B.) Geologic map of Greeley and Guest (41) superimposed on the topographic shaded-relief from MOLA (42). The most ancient terrain (Npld, Nple) is Noachian in age (~3.6 – 4.5 billion years old, when Mars was wet), and is overlain by volcanic deposits from Syrtis Major of Hesperian (Hs) age (~3.1 – 3.6 billion yrs old). (Credit: Mumma, et al., 2009, Figure 3)
The sudden detection of ten-fold spikes in methane levels in Gale crater is not inconsistent with the earlier remote measurements from Earth. The high seasonal concentrations were in regions that do not include Gale Crater, and it remains possible that the Curiosity measurements are of a similar nature but due to some less active process than exists at the regions identified by Dr. Mumma’s team.
This graphic shows tenfold spiking in the abundance of methane in the Martian atmosphere surrounding NASA’s Curiosity Mars rover, as detected by a series of measurements made with the Tunable Laser Spectrometer instrument in the rover’s Sample Analysis at Mars laboratory suite. (Image Credit: NASA/JPL-Caltech)
The NASA scientists at AGU led by MSL project scientist Dr. John Grotzinger emphasized that they do not yet know how the methane is being generated. The process could be biological or not. There are abiotic chemical processes that could produce methane. However, the MSL SAM detections were daily spikes and represent an active real on-going process on the red planet. This alone is a very exciting aspect of the detection.
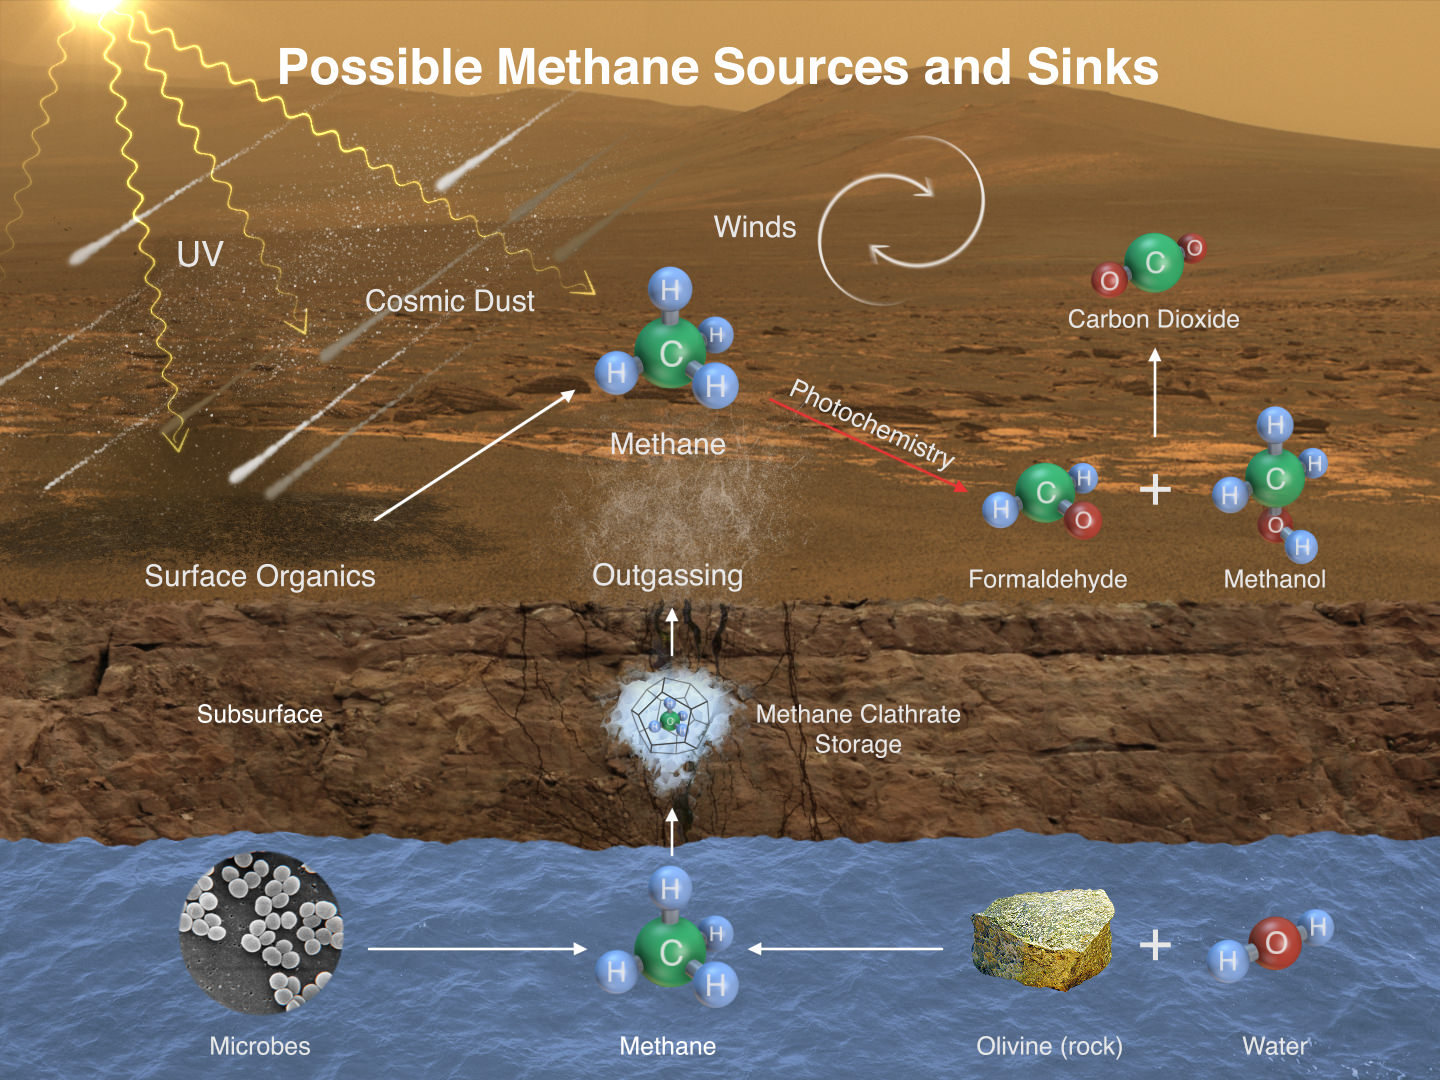
The team presented slides to describe how methane could be generated. With the known low background levels of methane at ~ 1 part per billion, an external cosmic source, for example micro-meteoroids entering the atmosphere and releasing organics which is then reduced by sunlight to methane, could be ruled out. The methane source must be of local origin.
This image illustrates possible ways methane might be added to Mars’ atmosphere (sources) and removed from the atmosphere (sinks). NASA’s Curiosity Mars rover has detected fluctuations in methane concentration in the atmosphere, implying both types of activity occur on modern Mars. A longer caption discusses which are sources and which are sinks. (Image Credit: NASA/JPL-Caltech/SAM-GSFC/Univ. of Michigan)
The scientists illustrated two means of production. In both instances, there is some daily – or at least periodic – activity that is releasing methane from the subsurface of Mars. The source could be biological which is accumulated in subsurface rocks then suddenly released. Or an abiotic chemistry, such as a reaction between the mineral olivine and water, could be the generator.
The subsurface storage mechanism of methane proposed and illustrated is called clathrate storage. Clathrate storage involves lattice compounds that can trap molecules such as methane which can subsequently be released by physical changes in the clathrate, such as solar heating or mechanical stresses. Through press Q&A, the NASA scientists stated that such clathrates could be preserved for millions and billions of years underground.
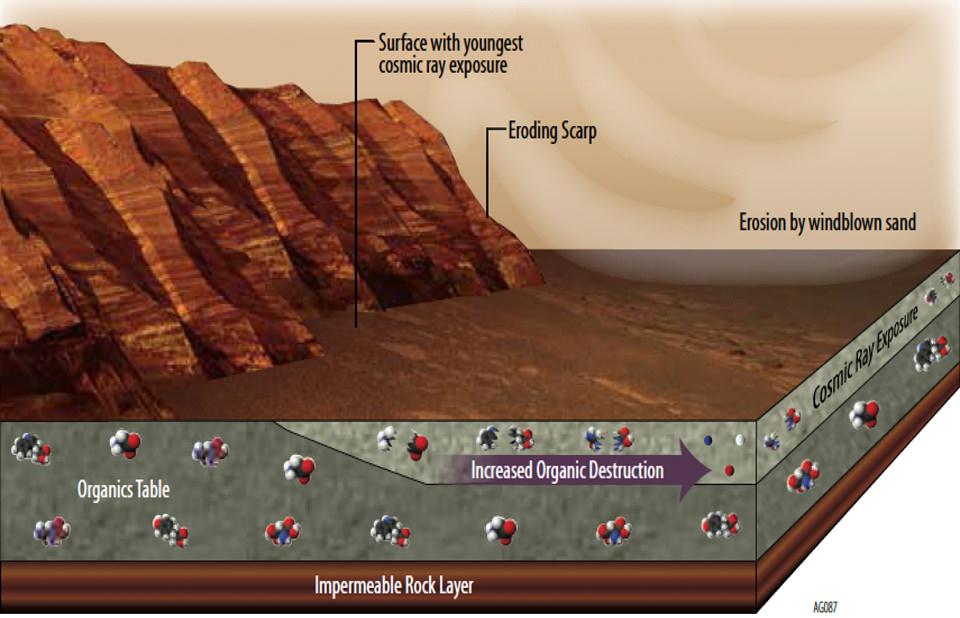
The second discovery of organics involved more complex compounds in surface materials. Also since arriving at Mars, Curiosity has utilized a drilling tool to probe the interiors of rocks. Grotzinger emphasized how material immediately at the surface of Mars has experienced the effects of radiation and the ubiquitous soil compound perchlorate reducing and destroying organics both now and over millions of years. The detection of no organics in loose and exposed surface material had not diminished NASA scientists’ hopes of detecting organics in the rocks of Mars.
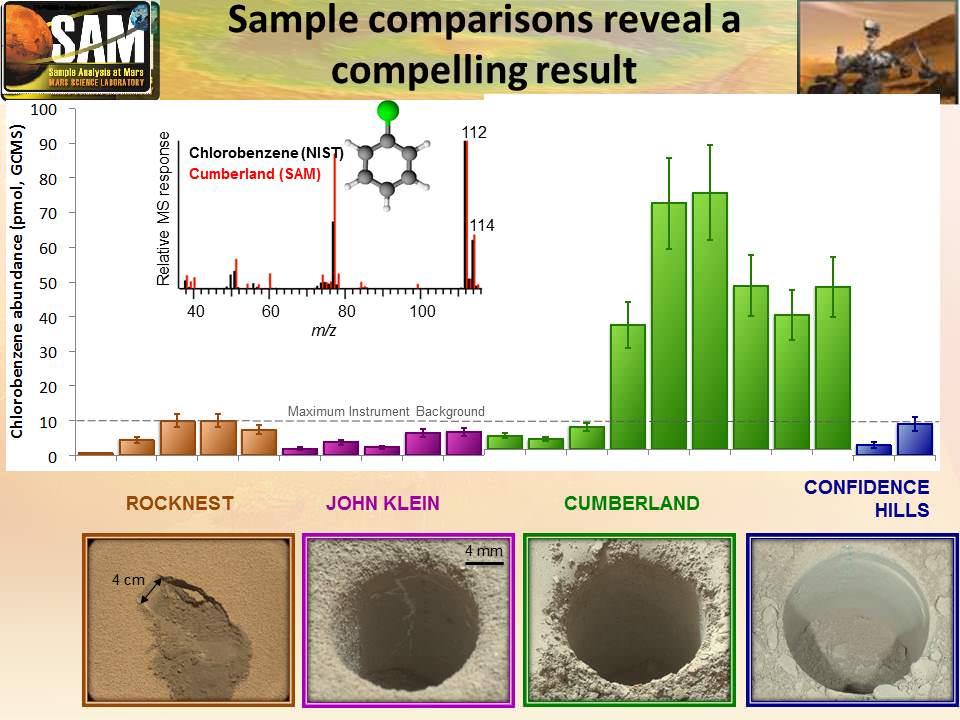
Comparisons between the amount of an organic chemical named chlorobenzene detected in the “Cumberland” rock sample and amounts of it in samples from three other Martian surface targets analyzed by NASA’s Curiosity Mars rover. (Image Credit: NASA/JPL-Caltech)
Drilling was performed on several selected rocks and it was finally a mud rock called Cumberland that revealed the presence of organic compounds more complex than simple methane. The scientists did emphasize that what exactly these organic compounds are remains a mystery because of the confounding presence of the active chemical perchlorate which can quickly breakdown organics to simpler forms.
Examples from the Sample Analysis at Mars (SAM) laboratory’s detection of Martian organics in a sample of powder that the drill on NASA’s Curiosity Mars rover collected from a rock target called “Cumberland.” (Image Credit: NASA/JPL-Caltech)
The detection of organics in the mud rock Cumberland required the drilling tool and also the scoop on the multifaceted robotic arm to deliver the sample into the SAM laboratory for analysis. To detect methane, SAM has an intake valve to receive atmospheric samples.
Dr. Grotzinger described how Cumberland was chosen as a sample source. The rock is called a mud stone which has undergone a process called digenesis – the metamorphosis of sediment to rock. Grotzinger emphasized that fluids will move through such rock during digenesis and perchlorate can destroy organics in the process. Such might be the case for many metamorphic rocks on the Martian surface. The panel of scientists showed a comparison between rock samples measured by SAM. Two in particular – from the rock “John Klein” and the Cumberland rock — were compared. The former showed no organics as well as other rocks that were sampled; but Cumberland’s drill sample from its interior did reveal organics.
Illustration of some of the reasons why finding organic chemicals on Mars is challenging. Whatever organic chemicals may be produced on Mars or delivered to Mars face several possible modes of being transformed or destroyed. (Image Credit: NASA/JPL-Caltech)
The analysis of the work was painstaking – harking back to the Sagan statement. The importance of discovering organics on Mars could not be understated by the panel of scientists and Grotzinger called these two discoveries as the lasting legacy of the Mars Curiosity Rover. Furthermore, he stated that the discovery and analysis methods will go far to guide the choice of instruments and their use during the Mars 2020 rover mission.
The discovery of organics completes the necessary set of “ingredients” for past or present life on Mars: 1) an energy source, 2) water, and 3) organics. These are the basic requirements for the existence of life as we know it. The search for life on Mars is still just beginning and the new discoveries of organics is still not a clear sign that life existed or is present today. Nevertheless, Dr. Jim Green, introducing the panel of scientists, and Dr. Grotzinger both emphasized the magnitude of these discoveries and how they are tied into the objectives of the NASA Mars program — particularly now with the emphasis on sending humans to Mars. For the Mars Curiosity rover, the journey up the slopes of Mount Sharp continues and now with greater earnestness and a continued search for rocks similar to Cumberland.
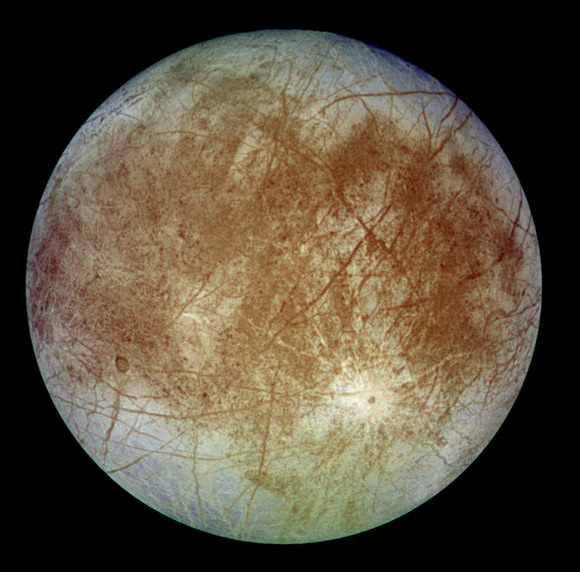
Europa. CThe cracked, icy surface of Europa. The smoothness of the surface has led many scientists to conclude that oceans exist beneath it. Credit: NASA/JPLredit: NASA
Europa, Jupiter’s sixth-closest moon, has long been a source of fascination and wonder for astronomers. Not only is it unique amongst its Jovian peers for having a smooth, ice-covered surface, but it is believed that warm, ocean waters exist beneath that crust – which also makes it a strong candidate for extra-terrestrial life.
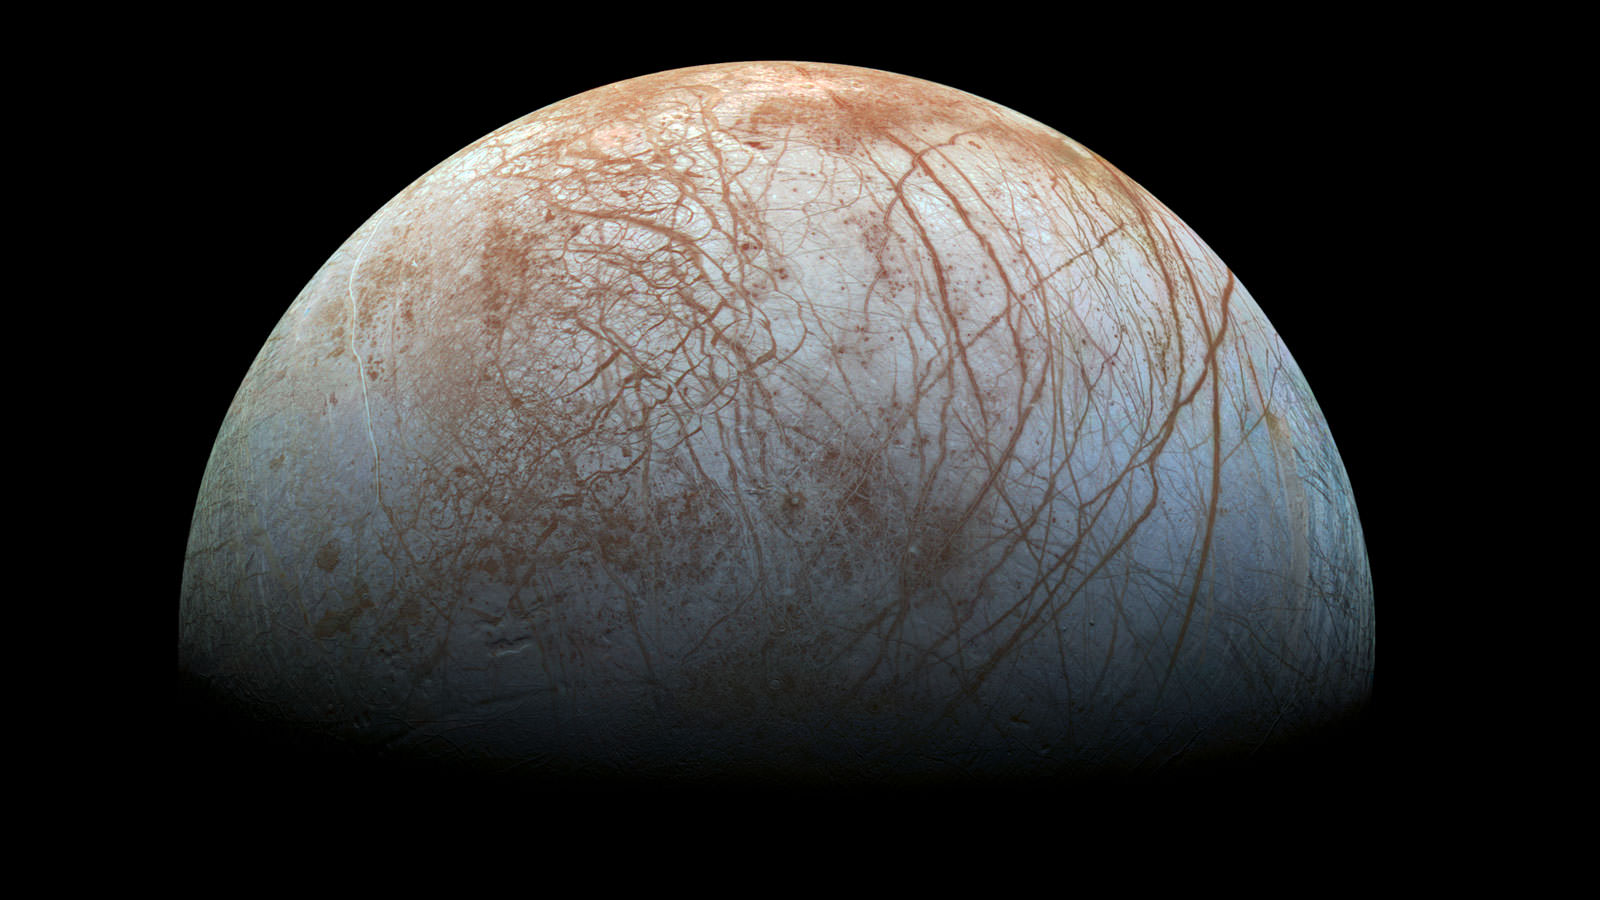
And now, combining a mosaic of color images with modern image processing techniques, NASA has produced a new version of what is perhaps the best view of Europa yet. And it is quite simply the closest approximation to what the human eye would see, and the next best thing to seeing it up close.
The high-resolution color image, which shows the largest portion of the moon’s surface, was made from images taken by NASA’s Galileo probe. Using the Solid-State Imaging (SSI) experiment, the craft captured these images during it’s first and fourteenth orbit through the Jupiter system, in 1995 and 1998 respectively.
The view was previously released as a mosaic with lower resolution and strongly enhanced color (as seen on the JPL’s website). To create this new version, the images were assembled into a realistic color view of the surface that approximates how Europa would appear to the human eye.
This newly-reprocessed color view of Europa was made from images taken by NASA’s Galileo spacecraft in the late 1990s. Image credit: NASA/JPL-Caltech/SETI Institute
As shown above, the new image shows the stunning diversity of Europa’s surface geology. Long, linear cracks and ridges crisscross the surface, interrupted by regions of disrupted terrain where the surface ice crust has been broken up and re-frozen into new patterns.
Images taken through near-infrared, green, and violet filters have been combined to produce this view. The images have been corrected for light scattered outside of the image to provide a color correction that is calibrated by wavelength. Gaps in the images have been filled with simulated color based on the color of nearby surface areas with similar terrain types.
These color variations across the surface are associated with differences in geologic feature type and location. For example, areas that appear blue or white contain relatively pure water ice, while reddish and brownish areas include non-ice components in higher concentrations.
The polar regions, visible at the left and right of this view, are noticeably bluer than the more equatorial latitudes, which look more white. This color variation is thought to be due to differences in ice grain size in the two locations.
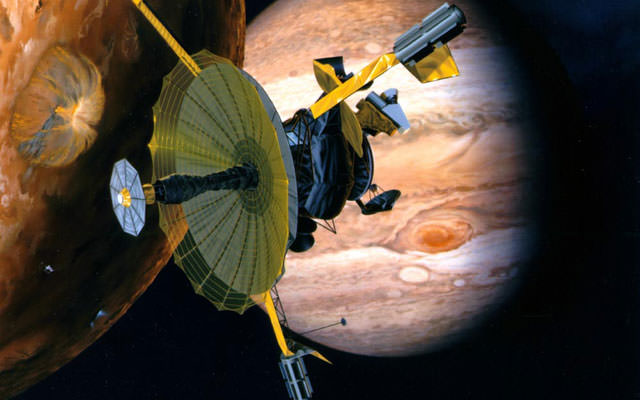
Artist’s concept of the Galileo space probe passing through the Jupiter system. Credit: NASA
This view of Europa stands out as the color view that shows the largest portion of the moon’s surface at the highest resolution. An earlier, lower-resolution version of the view, published in 2001, featured colors that had been strongly enhanced. Space imaging enthusiasts have produced their own versions of the view using the publicly available data, but NASA has not previously issued its own rendition using near-natural color.
The image also features many long, curving, and linear fractures in the moon’s bright ice shell. Scientists are eager to learn if the reddish-brown fractures, and other markings spattered across the surface, contain clues about the geological history of Europa and the chemistry of the global ocean that is thought to exist beneath the ice.
This is of particular interest to scientists since this supposed ocean is the most promising place in our Solar System, beyond Earth, to look for present-day environments that are suitable for life. The Galileo mission found strong evidence that a subsurface ocean of salty water is in contact with a rocky seafloor. The cycling of material between the ocean and ice shell could potentially provide sources of chemical energy that could sustain simple life forms.
Future missions to Europa, which could involve anything from landers to space penetrators, may finally answer the question of whether or not life exists beyond our small, blue planet. Picturing this world in all of its icy glory is another small step along that path.
In addition to the newly processed image, JPL has released a new video that explains why this likely ocean world is a high priority for future exploration:
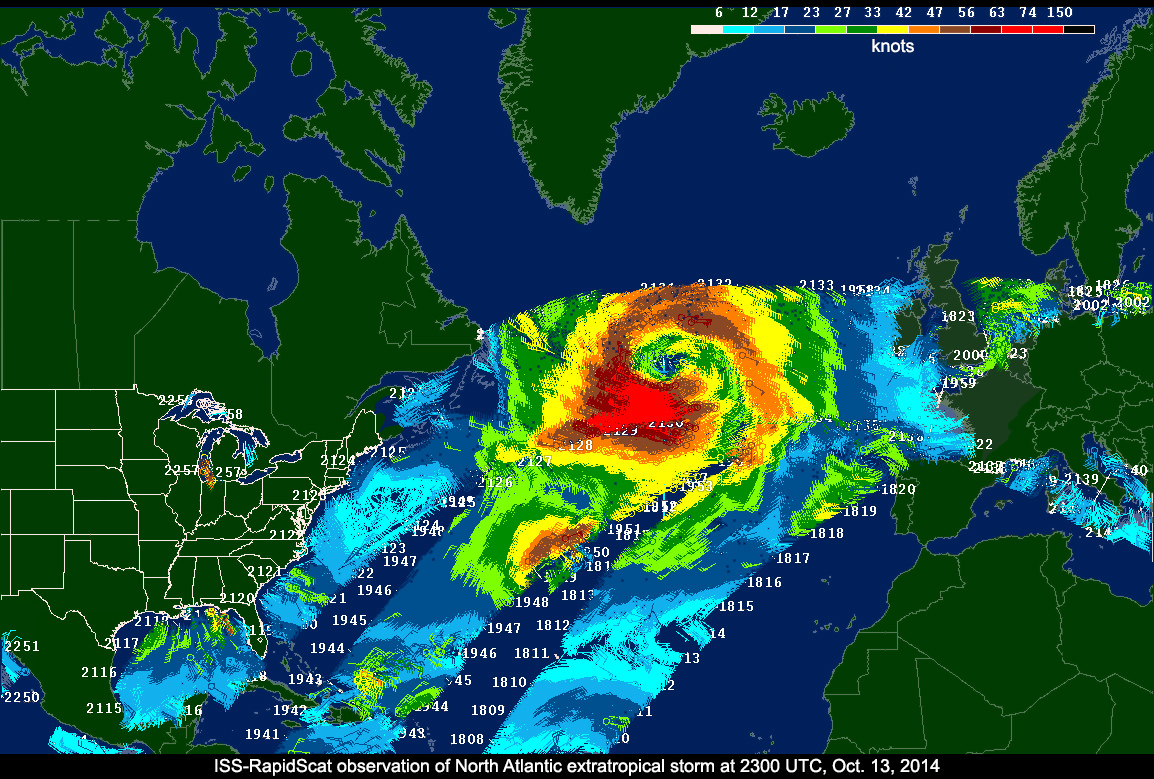
ISS-RapidScat data on a North Atlantic extratropical cyclone, as seen by the National Centers for Environmental Prediction Advanced Weather Interactive Processing System used by weather forecasters at the National Oceanic and Atmospheric Administration's Ocean Prediction Center.
Image Credit:
NASA/JPL-Caltech/NOAA
Barely two months after being launched to the International Space Station (ISS), NASA’s first science payload aimed at conducting Earth science from the station’s exterior has started its ocean wind monitoring operations two months ahead of schedule.
Data from the ISS Rapid Scatterometer, or ISS-RapidScat, payload is now available to the world’s weather and marine forecasting agencies following the successful completion of check out and calibration activities by the mission team.
Indeed it was already producing high quality, usable data following its power-on and activation at the station in late September and has monitored recent tropical cyclones in the Atlantic and Pacific Oceans prior to the end of the current hurricane season.
RapidScat is designed to monitor ocean winds for climate research, weather predictions, and hurricane monitoring for a minimum mission duration of two years.
“RapidScat is a short mission by NASA standards,” said RapidScat Project Scientist Ernesto Rodriguez of JPL.
“Its data will be ready to help support U.S. weather forecasting needs during the tail end of the 2014 hurricane season. The dissemination of these data to the international operational weather and marine forecasting communities ensures that RapidScat’s benefits will be felt throughout the world.”
ISS-RapidScat instrument, shown in this artist’s rendering, was launched to the International Space Station aboard the SpaceX CRS-4 mission on Sept. 21, 2014, and attached at ESA’s Columbus module. It will measure ocean surface wind speed and direction and help improve weather forecasts, including hurricane monitoring. Credit: NASA/JPL-Caltech/Johnson Space Center.
The 1280 pound (580kilogram) experimental instrument was developed by NASA’s Jet Propulsion Laboratory. It’s a cost-effective replacement to NASA’s former QuikScat satellite.
The $26 million remote sensing instrument uses radar pulses reflected from the ocean’s surface at different angles to calculate the speed and direction of winds over the ocean for the improvement of weather and marine forecasting and hurricane monitoring.
The RapidScat, payload was hauled up to the station as part of the science cargo launched aboard the commercial SpaceX Dragon CRS-4 cargo resupply mission that thundered to space on the company’s Falcon 9 rocket from Space Launch Complex-40 at Cape Canaveral Air Force Station in Florida on Sept. 21.
ISS-RapidScat is NASA’s first research payload aimed at conducting near global Earth science from the station’s exterior and will be augmented with others in coming years.
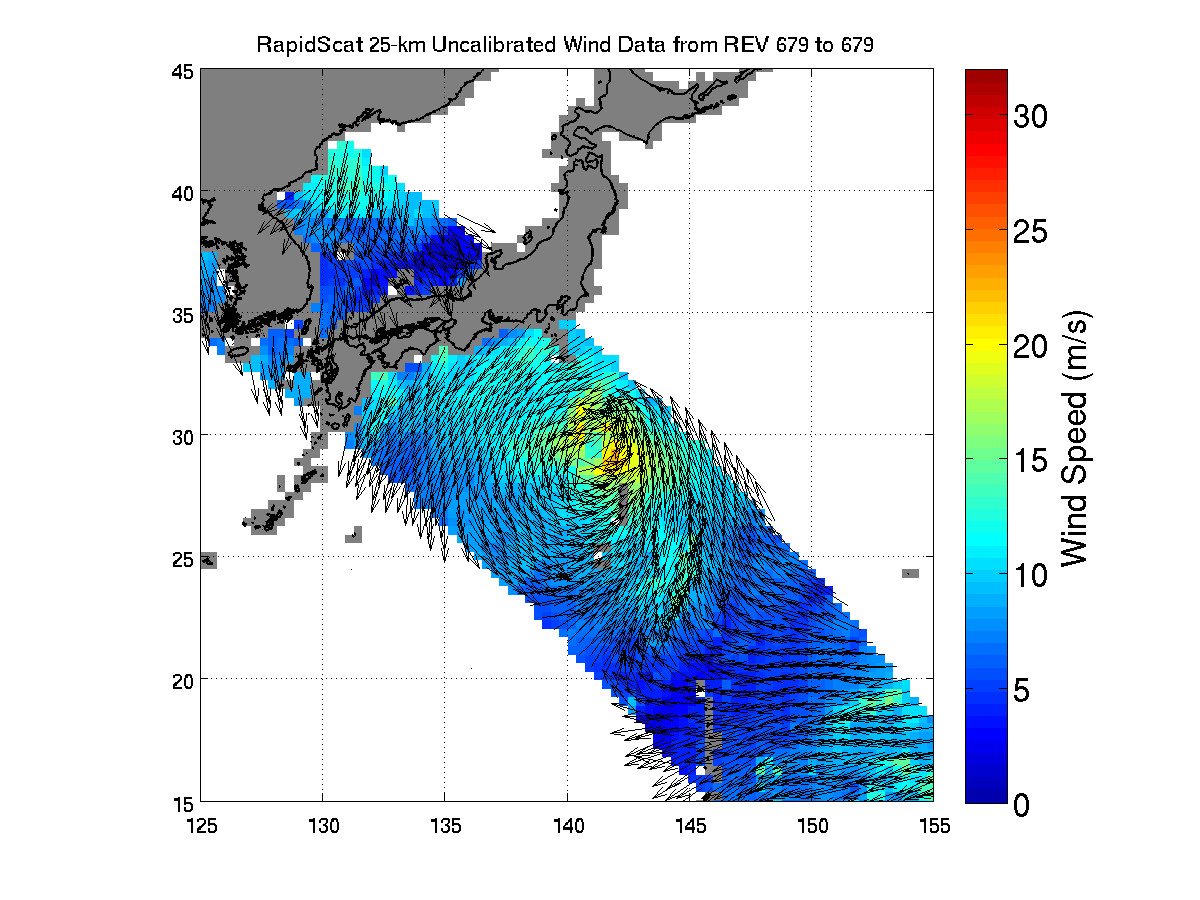
ISS-RapidScat viewed the winds within post-tropical cyclone Nuri as it moved parallel to Japan on Nov. 6, 2014, 05:30 UTC. Image Credit: NASA/JPL-Caltech
It was robotically assembled and attached to the exterior of the station’s Columbus module using the station’s robotic arm and DEXTRE manipulator over a two day period on Sept 29 and 30.
Ground controllers at Johnson Space Center intricately maneuvered DEXTRE to pluck RapidScat and its nadir adapter from the unpressurized trunk section of the Dragon cargo ship and attached it to a vacant external mounting platform on the Columbus module holding mechanical and electrical connections.
The nadir adapter orients the instrument to point its antennae at Earth.
The couch sized instrument and adapter together measure about 49 x 46 x 83 inches (124 x 117 x 211 centimeters).
“The initial quality of the RapidScat wind data and the timely availability of products so soon after launch are remarkable,” said Paul Chang, ocean vector winds science team lead at NOAA’s National Environmental Satellite, Data and Information Service (NESDIS)/Center for Satellite Applications and Research (STAR), Silver Spring, Maryland.
“NOAA is looking forward to using RapidScat data to help support marine wind and wave forecasting and warning, and to exploring the unique sampling of the ocean wind fields provided by the space station’s orbit.”
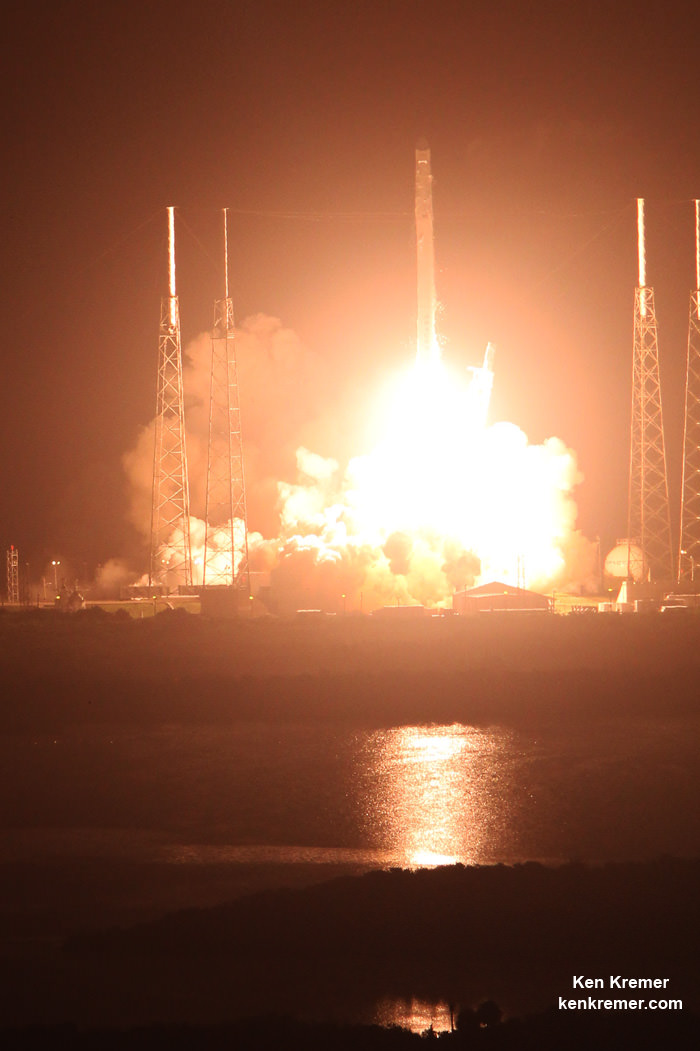
A SpaceX Falcon 9 rocket carrying a Dragon cargo capsule packed with science experiments and station supplies blasts off from Space Launch Complex 40 at Cape Canaveral Air Force Station, Florida, at 1:52 a.m. EDT on Sept. 21, 2014, bound for the ISS. Credit: Ken Kremer/kenkremer.com
This has been a banner year for NASA’s Earth science missions. At least five missions will be launched to space within a 12 month period, the most new Earth-observing mission launches in one year in more than a decade.
ISS-RapidScat is the third of five NASA Earth science missions scheduled to launch over a year.
NASA has already launched the of the Global Precipitation Measurement (GPM) Core Observatory, a joint mission with the Japan Aerospace Exploration Agency, in February and the Orbiting Carbon Observatory-2 (OCO-2) carbon observatory in July 2014.
Stay tuned here for Ken’s continuing Earth and Planetary science and human spaceflight news.
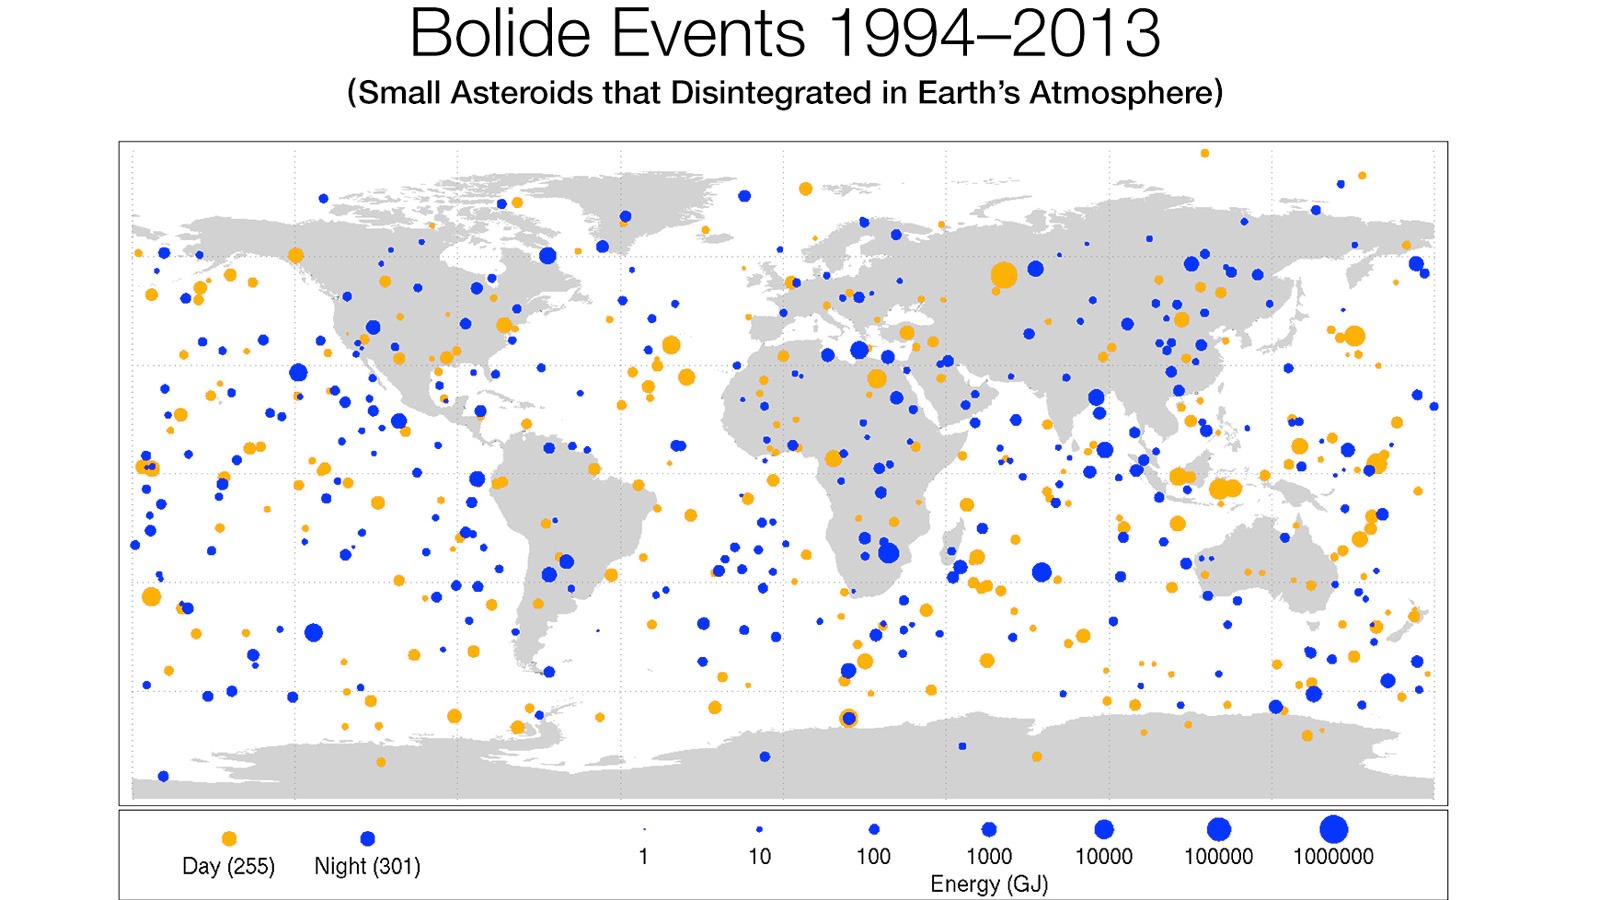
This diagram maps data gathered from 1994-2013 on small asteroids impacting Earth's atmosphere to create very bright meteors (bolides). The location of impacts from objects ranging from 1 meter (3 feet) to nearly 20 meters (60 feet) in size such as Chelyabinsk asteroid are shown globally. (Credit: Planetary Science, NASA)
How hazardous are the thousands and millions of asteroids that surround the third rock from the Sun – Earth? Since an asteroid impact represents a real risk to life and property, this is a question that has been begging for answers for decades. But now, scientists at NASA’s Jet Propulsion Laboratory have received data from a variety of US Department of Defense assets and plotted a startling set of data spanning 20 years.
This latest compilation of data underscores how frequent some of these larger fireballs are, with the largest being the Chelyabinsk event on February 15, 2013 which injured thousands in Russia. The new data will improve our understanding of the frequency and presence of small and large asteroids that are hazards to populated areas anywhere on Earth.
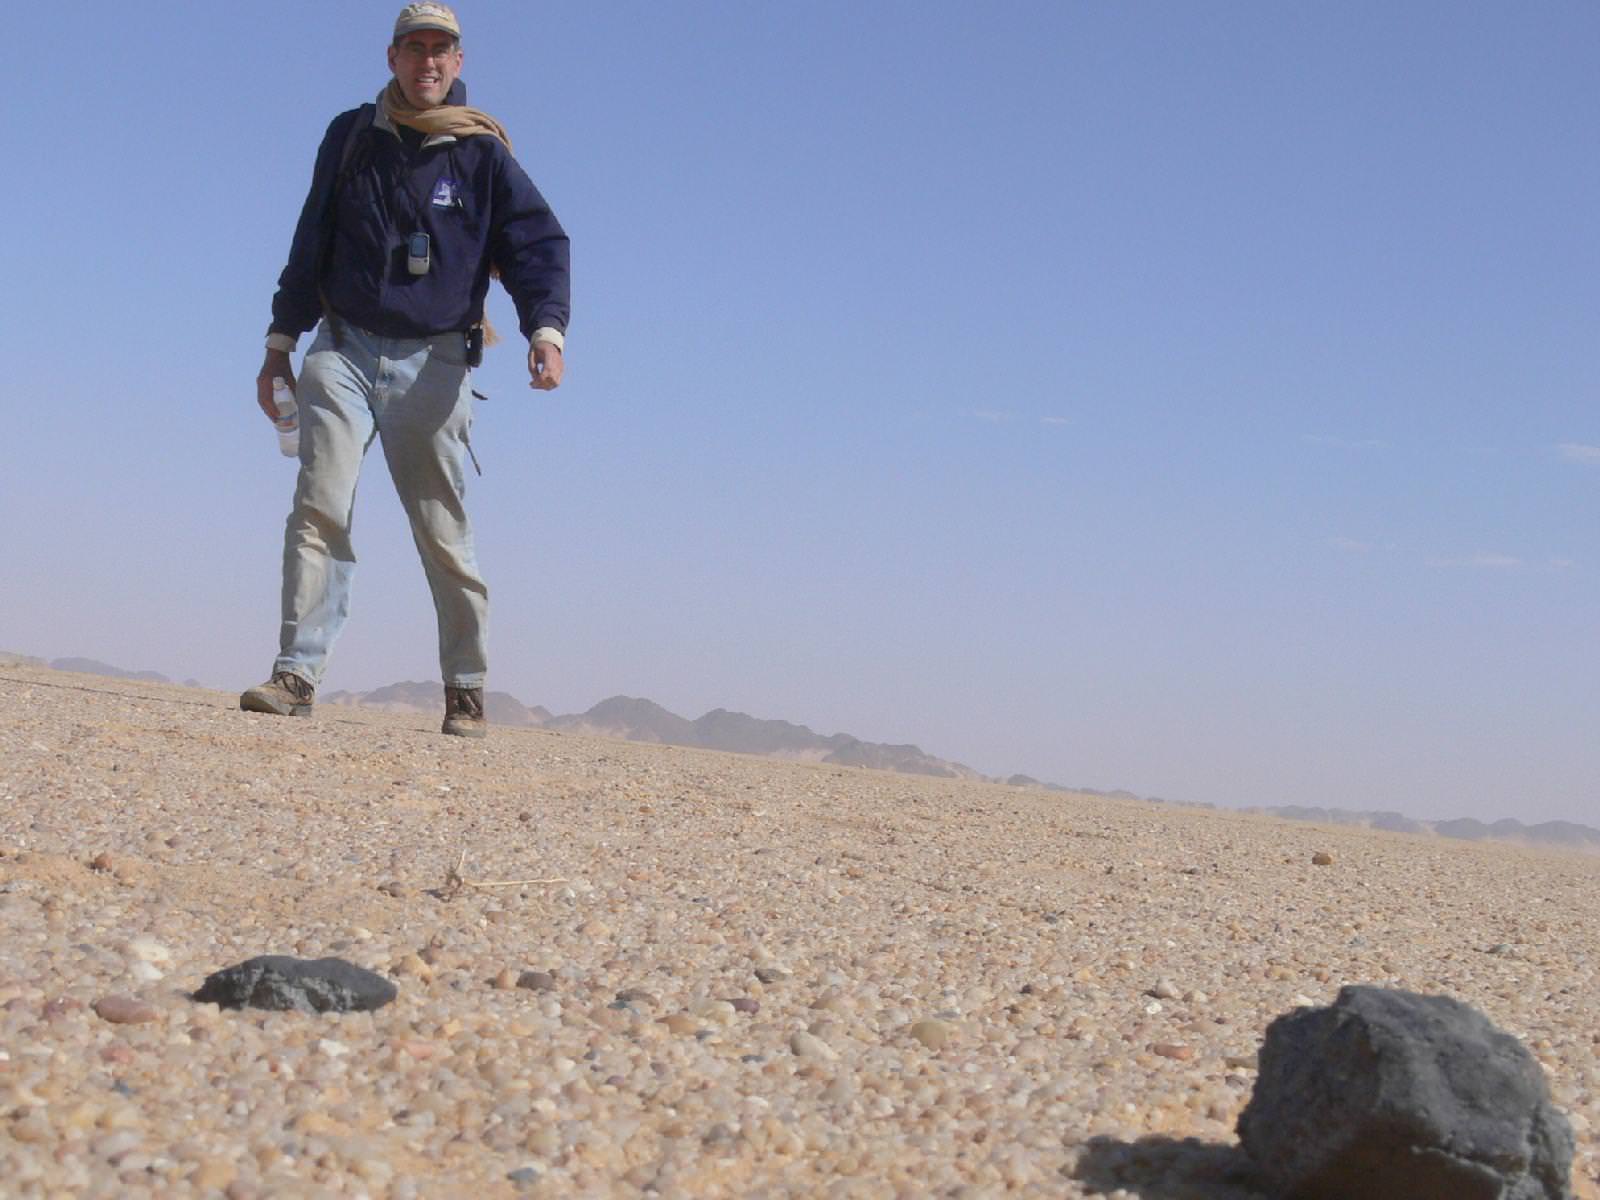
On Feb. 28, 2009, Peter Jenniskens (SETI/NASA), finds his first 2008TC3 meteorite after an 18-mile long journey. “It was an incredible feeling,” Jenniskens said. The meteorite which impacted in the Nubian Desert of Africa on Oct 7, 2008 was the first asteroid whose impact with Earth was predicted while still in space approaching Earth. Meteorite 2008TC3 and Chelyabinsk’s are part of the released data set. (Credit: NASA/SETI/P.Jenniskens)
The data from “government sensors” – meaning “early warning” satellites to monitor missile launches (from potential enemies) as well as infrasound ground monitors – shows the distribution of bolide (fireball) events. The data first shows how uniformly distributed the events are around the world. This data is now released to the public and researchers for more detailed analysis.
The newest data released by the US government shows both how frequent bolides are and also how effectively the Earth’s atmosphere protects the surface. A subset of this data had been analyzed and reported by Dr. Peter Brown from the University of Western Ontario, Canada and his team in 2013 but included only 58 events. This new data set holds 556 events.
The newly released data also shows how the Earth’s atmosphere is a superior barrier that prevents small asteroids’ penetration and impact onto the Earth’s surface. Even the 20 meter (65 ft) Chelyabinsk asteroid exploded mid-air, dissipating the power of a nuclear blast 29.7 km (18.4 miles, 97,400 feet) above the surface. Otherwise, this asteroid could have obliterated much of a modern city; Chelyabinsk was also saved due to sheer luck – the asteroid entered at a shallow angle leading to its demise; more steeply, and it would have exploded much closer to the surface. While many do explode in the upper atmosphere, a broad strewn field of small fragments often occurs. In historical times, towns and villages have reported being pelted by such sprays of stones from the sky.
NASA and JPL emphasized that investment in early detection of asteroids has increased 10 fold in the last 5 years. Researchers such as Dr. Jenniskens at the SETI Institute has developed a network of all-sky cameras that have determined the orbits of over 175,000 meteors that burned up in the atmosphere. And the B612 Foundation has been the strongest advocate of discovering of all hazardous asteroids. B612, led by former astronauts Ed Lu and Rusty Schweikert has designed a space telescope called Sentinel which would find hazardous asteroids and help safeguard Earth for centuries into the future.
Speed is everything. While Chelyabinsk had just 1/10th the mass of Nimitz-class super carrier, it traveled 1000 times faster. Its kinetic energy on account of its speed was 20 to 30 times that released by the nuclear weapons used to end the war against Japan – about 320 to 480 kilotons of TNT. Briefly, asteroids are considered to be any space rock larger than 1 meter and those smaller are called meteoroids.
Two earlier surveys can be compared to this new data. One by Eugene Shoemaker in the 1960s and another by Dr. Brown. The initial work by Shoemaker using lunar crater counts and the more recent work of Dr. Brown’s group, utilizing sensors of the Department of Defense, determined estimates of the frequency of asteroid impacts (bolide) rates versus the size of the small bodies. Those two surveys differ by a factor of ten, that is, where Shoemaker’s shows frequencies on the order of 10s or 100s years, Brown’s is on the order of 100s and 1000s of years. The most recent data, which has adjusted Brown’s earlier work is now raising the frequency of hazardous events to that of the work of Shoemaker.
The work of Dr. Brown and co-investigators led to the following graph showing the frequency of collisions with the Earth of asteroids of various sizes. This plot from a Letter to Nature by P. Brown et al. used 58 bolides from data accumulated from 1994 to 2014 from government sensors. Brown and others will improve their analysis with this more detailed dataset. The plot shows that a Chelyabinsk type event can be expected approximately every 30 years though the uncertainty is high. The new data may reduce this uncertainty. Tungunska events which could destroy a metropolitan area the size of Washington DC occur less frequently – about once a century.
The estimated cumulative flux of impactors at the Earth. The bolide impactor flux at Earth (Bolide flux 1994-2013 – black circles) based on ~20 years of global observations from US Government sensors and infrasound airwave data. Global coverage averages 80% among a total of 58 observed bolides with E > 1 kt and includes the Chelyabinsk Chelyabinsk bolide (far right black circle). This coverage correction is approximate and the bolide flux curve is likely a lower limit. The full caption is at bottom. (Credit: P. Brown, Letter to Nature, 2013, Figure 3)
Asteroids come in all sizes. Smaller asteroids are much more common, larger ones less so. A common distribution seen in nature is represented by a bell curve or “normal” distribution. Fortunately the bigger asteroids number in the hundreds while the small “city busters” count in the 100s of thousands, if not millions. And fortunately, the Earth is small in proportion to the volume of space even just the space occupied by our Solar System. Additionally, 69% of the Earth’s surface is covered by Oceans. Humans huddle on only about 10% of the surface area of the Earth. This reduces the chances of any asteroid impact effecting a populated area by a factor of ten.
Altogether the risk from asteroids is very real as the Chelyabinsk event underscored. Since the time of Tugunska impact in Siberia in 1908, the human population has quadrupled. The number of cities of over 1 million has increased from 12 to 400. Realizing how many and how frequent these asteroid impacts occur plus the growth of the human population in the last one hundred years raises the urgency for a near-Earth asteroid discovery telescope such as B612’s Sentinel which could find all hazardous objects in less than 10 years whereas ground-based observations will take 100 years or more.
The estimated cumulative flux of impactors at the Earth. The bolide impactor flux at Earth (Bolide flux 1994-2013 – black circles) based on ~20 years of global observations from US Government sensors and infrasound airwave data. Global coverage averages 80% among a total of 58 observed bolides with E > 1 kt and includes the Chelyabinsk Chelyabinsk bolide (far right black circle). This coverage correction is approximate and the bolide flux curve is likely a lower limit. The brown-coloured line represents an earlier powerlaw fit from a smaller dataset for bolides between 1 – 8 m in diameter15. Error bars represent counting statistics only. For comparison, we plot de-biased estimates of the near-Earth asteroid impact frequency based on all asteroid survey telescopic search data through mid- 2012 (green squares)8 and other earlier independently analysed telescopic datasets including NEAT discoveries (pink squares) and finally from the Spacewatch (blue squares) survey, where diameters are determined assuming an albedo of 0.1. Energy for telescopic data is computed assuming a mean bulk density of 3000 kgm-3 and average impact velocity of 20.3 kms-1. The intrinsic impact frequency for these telescopic data was found using an average probability of impact for NEAs as 2×10⁻⁹ per year for the entire population. Lunar crater counts converted to equivalent impactor flux and assuming a geometric albedo of 0.25 (grey solid line) are shown for comparison9, though we note that contamination by secondary craters and modern estimates of the NEA population which suggest lower albedos will tend to shift this curve to the right and down. Finally, we show estimated influx from global airwave measurements conducted from 1960-1974 which detected larger (5-20m) bolide impactors (upward red triangles) using an improved method for energy estimation compared to earlier interpretations of these same data.
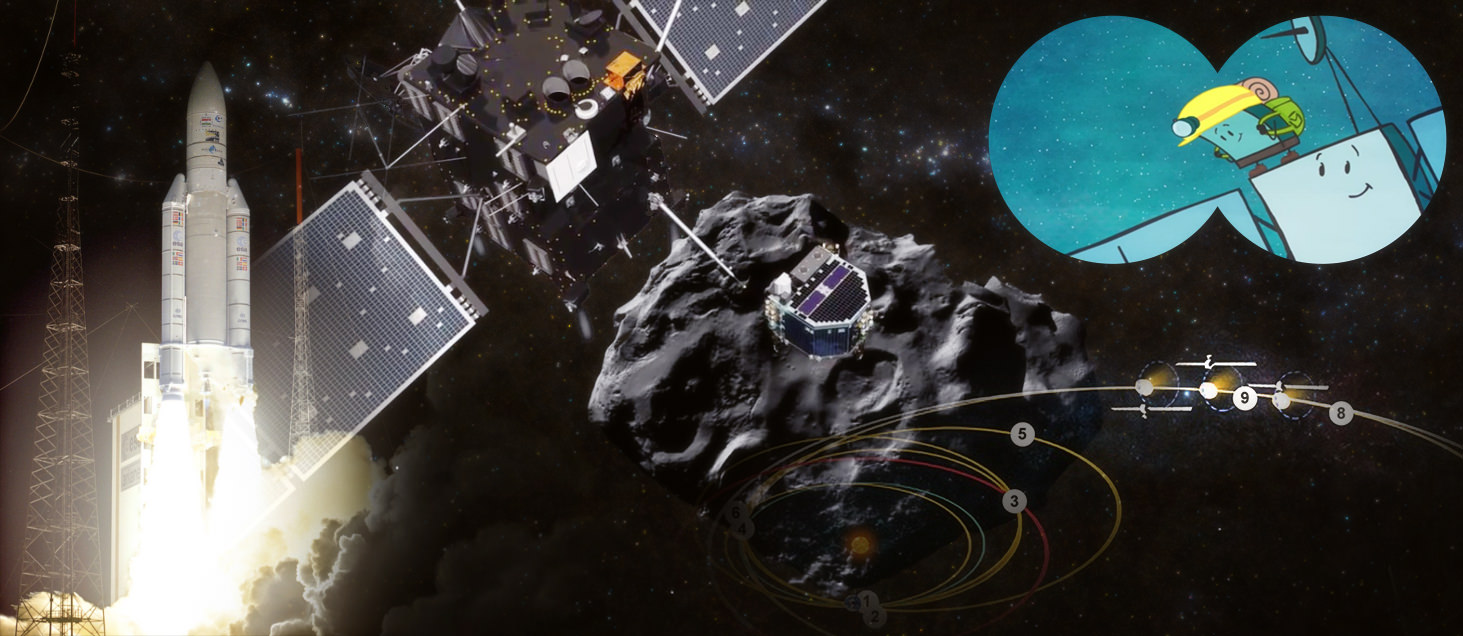
After a ten year journey that began with the launch from the jungles of French Guyana, landing Philae is not the end of mission, it is the beginning of a new phase. A successful landing is not guaranteed but the ESA Rosetta team is now ready to release Philae on its one way journey. (Photo Credits: ESA/NASA, Illustration: J.Schmidt)
We are now in the final hours before Rosetta’s Philae lander is released to attempt a first-ever landing on a comet. At 9:03 GMT (1:03 AM PST) on Wednesday, November 12, 2014, Philae will be released and directed towards the surface of comet 67P/Churyumov–Gerasimenko. 7 hours later, the lander will touch down.
Below you’ll find a timeline of events, info on how to watch the landing, and an overview of how the landing will (hopefully) work.
In human affairs, we build contingencies for missteps, failures. With spacecraft, engineers try to eliminate all single point failures and likewise have contingency plans. The landing of a spacecraft, be it on Mars, Earth, or the Moon, always involves unavoidable single point failures and points of no return, and with comet 67P/Churyumov–Gerasimenko, Rosetta’s Philae lander is no exception.
Rosetta’s and Philae’s software and hardware must work near flawlessly to give Philae the best chance possible of landing safely. And even with flawless execution, it all depends on Philae’s intercepting a good landing spot on the surface. Philae’s trajectory is ballistic on this one way trip to a comet’s surface. It’s like a 1 mile per hour bullet. Once fired, it’s on its own, and for Philae, its trajectory could lead to a pristine flat step or it could be crevasse, ledge, or sharp rock.
The accuracy of the landing is critical but it has left a 1 square kilometer of uncertainty. For this reason, engineers and scientists had to survey the whole surface for the most mild features. Comet 67P has few areas that are not extreme in one way or another. Site J, now called Agilkia, is one such site.
When first announced in late September, the time of release was 08:35 GMT (12:35 AM PST). Now the time is 9:03 GMT. The engineers and computer scientists have had six weeks to further refine their trajectory. It’s a complicated calculation that has required running the computer simulation of the descent backwards. Backwards because they can set a landing time then run Philae backwards to the moment of release. The solution is not just one but many, thousands or millions if you want to look in such detail. With each release point, the engineers had to determine how, or if, Rosetta could be navigated to that coordinate point in space and time.
Arrival time of the radio signal with landing status: 16:30 GMT
Rosetta/Philae at 500 million km [320 million miles], 28.5 minutes light time
Arrival of First Images: 06:00 GMT, November 13, 2014
The gravity field of the comet is so weak, it is primarily the initial velocity from Rosetta that delivers Philae to the surface. But the gravity is there and because of the chaotic shape and unknown (as yet) mass distribution inside, the gravity will make Philae move like a major league knuckleball wobbling to the plate and a batter. Furthermore, the comet during the seven hour trip will make half a rotation. The landing site will not be in site when Philae is released.
And as Philae is on final approach, it will use a small rocket not to slow down but rather thrust it at the comet, landing harpoons will be fired, foot screws will try to burrow into the comet, and everyone on Earth will wait several minutes for a message to be relayed from Philae to Rosetta to the Deep Space Network (DSN) antennas on Earth. Philae will be on its own as soon as it leaves Rosetta and its fate is a few hours away.
Why travel to a comet? Comets represent primordial material leftover from the formation of the solar system. Because cometary bodies were formed and remained at a distance from the heat of the sun, the materials have remained nearly unchanged since formation, ~4.5 billion years ago. By looking at Rosetta’s comet, 67P/Churyumov–Gerasimenko, scientists will gain the best yet measurements of a comet’s chemical makeup, its internal structure created during formation, and the dynamics of the comet as it approaches the warmth of the Sun. Theories propose that comets impacting on Earth delivered most of the water of our oceans. If correct, then we are not just made of star-stuff, as Carl Sagan proclaimed, we are made of comet stuff, too. Comets may also have delivered the raw organic materials needed to start the formation of life on Earth.
Besides the ESA live feeds, one can take a peek at NASA’s Deep Space Network (DSN) at work to see which telescopes are communicating with Rosetta. JPL’s webcast can watched below:
ISS-RapidScat instrument, shown in this artist's rendering, was launched to the International Space Station aboard the SpaceX CRS-4 mission on Sept. 21, 2014 and attached at ESA’s Columbus module. It will measure ocean surface wind speed and direction and help improve weather forecasts, including hurricane monitoring. Credit: NASA/JPL-Caltech/Johnson Space Center.
NASA inaugurated a new era of research for the International Space Station (ISS) as an Earth observation platform following the successful installation and activation of the ISS-RapidScat science instrument on the outposts exterior at Europe’s Columbus module.
The ISS Rapid Scatterometer, or ISS-RapidScat, is NASA’s first research payload aimed at conducting near global Earth science from the station’s exterior and will be augmented with others in coming years.
RapidScat is designed to monitor ocean winds for climate research, weather predictions, and hurricane monitoring.
The 1280 pound (580 kilogram) experimental instrument is already collecting its first science data following its recent power-on and activation at the station.
“Its antenna began spinning and it started transmitting and receiving its first winds data on Oct.1,” according to a NASA statement.
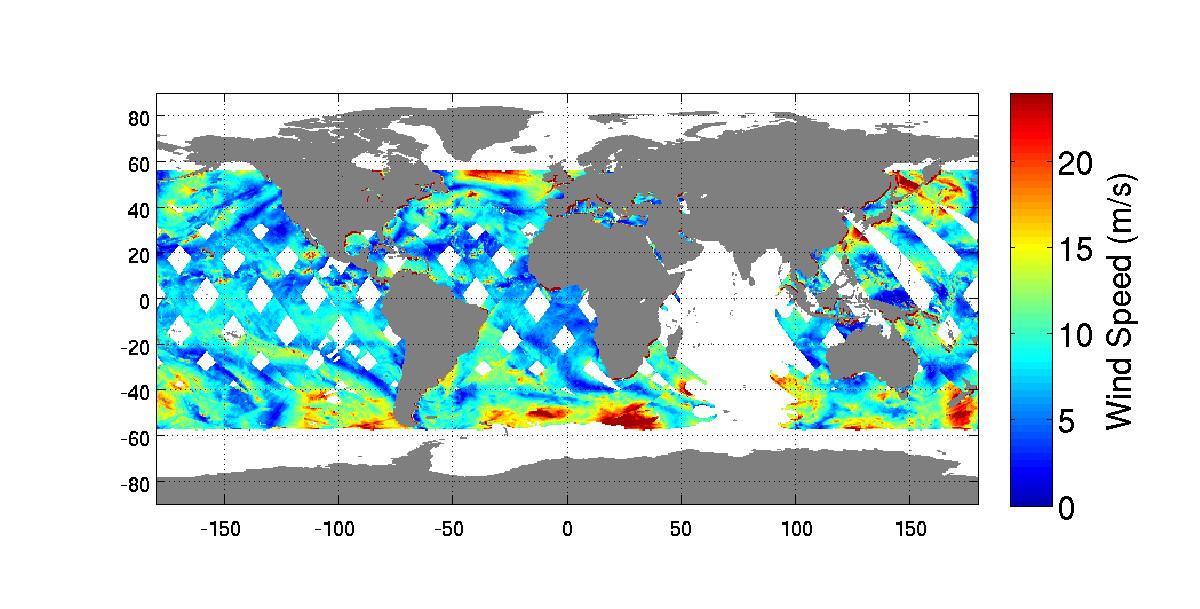
The first image from RapidScat was released by NASA on Oct. 6, shown below, and depicts preliminary measurements of global ocean near-surface wind speeds and directions.
Launched Sept. 21, 2014, to the International Space Station, NASA’s newest Earth-observing mission, the International Space Station-RapidScat scatterometer to measure global ocean near-surface wind speeds and directions, has returned its first preliminary images. Credit: NASA-JPL/Caltech
The $26 million remote sensing instrument uses radar pulses to observe the speed and direction of winds over the ocean for the improvement of weather forecasting.
“Most satellite missions require weeks or even months to produce data of the quality that we seem to be getting from the first few days of RapidScat,” said RapidScat Project Scientist Ernesto Rodriguez of NASA’s Jet Propulsion Laboratory, Pasadena, California, which built and manages the mission.
“We have been very lucky that within the first days of operations we have already been able to observe a developing tropical cyclone.
“The quality of these data reflect the level of testing and preparation that the team has put in prior to launch,” Rodriguez said in a NASA statement. “It also reflects the quality of the spare QuikScat hardware from which RapidScat was partially assembled.”
RapidScat, payload was hauled up to the station as part of the science cargo launched aboard the commercial SpaceX Dragon CRS-4 cargo resupply mission that thundered to space on the company’s Falcon 9 rocket from Space Launch Complex-40 at Cape Canaveral Air Force Station in Florida on Sept. 21.
Dragon was successfully berthed at the Earth-facing port on the station’s Harmony module on Sept 23, as detailed here.
It was robotically assembled and attached to the exterior of the station’s Columbus module using the station’s robotic arm and DEXTRE manipulator over a two day period on Sept 29 and 30.
Ground controllers at Johnson Space Center intricately maneuvered DEXTRE to pluck RapidScat and its nadir adapter from the unpressurized trunk section of the Dragon cargo ship and attached it to a vacant external mounting platform on the Columbus module holding mechanical and electrical connections.
Fascinating: #Canadarm & Dextre installed the #RapidScat Experiment on Columbus! @ISS_Research @NASAJPL @csa_asc. Credit: ESA/NASA/Alexander Gerst
The nadir adapter orients the instrument to point at Earth.
The couch sized instrument and adapter together measure about 49 x 46 x 83 inches (124 x 117 x 211 centimeters).
Engineers are in the midst of a two week check out process that is proceeding normally so far. Another two weeks of calibration work will follow.
Thereafter RapidScat will begin a mission expected to last at least two years, said Steve Volz, associate director for flight programs in the Earth Science Division, NASA Headquarters, Washington, at a prelaunch media briefing at the Kennedy Space Center.
RapidScat is the forerunner of at least five more Earth science observing instruments that will be added to the station by the end of the decade, Volz explained.
The second Earth science instrument, dubbed CATS, could be added by year’s end.
The Cloud-Aerosol Transport System (CATS) is a laser instrument that will measure clouds and the location and distribution of pollution, dust, smoke, and other particulates in the atmosphere.
CATS is slated to launch on the next SpaceX resupply mission, CRS-5, currently targeted to launch from Cape Canaveral, FL, on Dec. 9.
A SpaceX Falcon 9 rocket carrying a Dragon cargo capsule packed with science experiments and station supplies blasts off from Space Launch Complex 40 at Cape Canaveral Air Force Station, Florida, at 1:52 a.m. EDT on Sept. 21, 2014, bound for the ISS. Credit: Ken Kremer/kenkremer.com
This has been a banner year for NASA’s Earth science missions. At least five missions will be launched to space within a 12 month period, the most new Earth-observing mission launches in one year in more than a decade.
ISS-RapidScat is the third of five NASA Earth science missions scheduled to launch over a year.
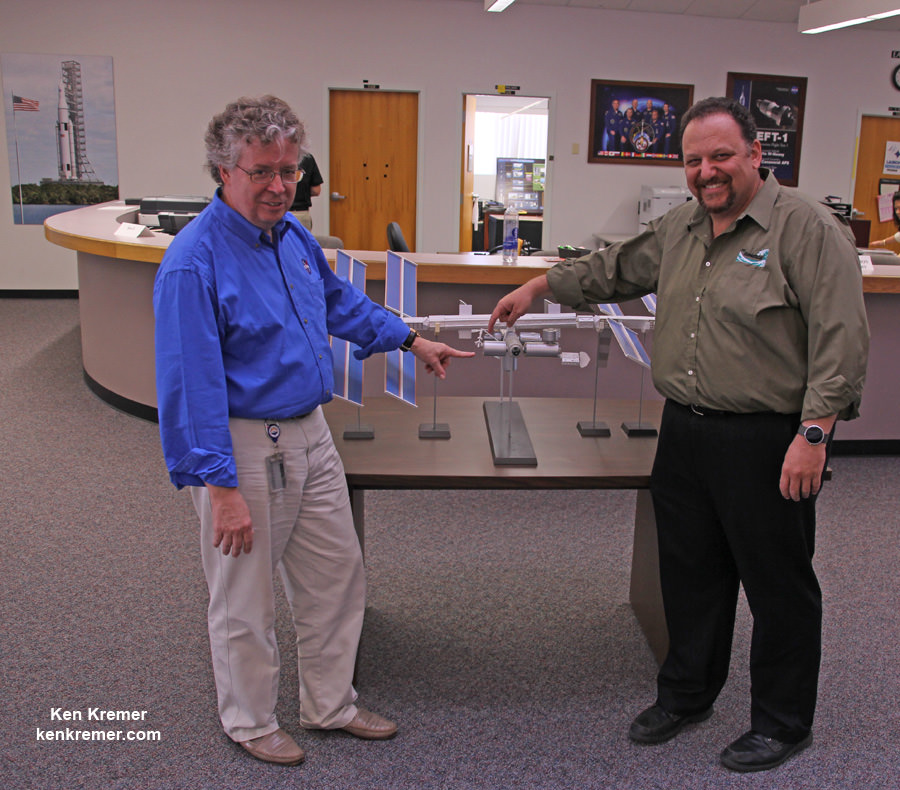
NASA managers show installed location of ISS-RapidScat instrument on the ESA Columbus module on an ISS scale model at the Kennedy Space Center press site during launch period for the SpaceX CRS-4 Dragon cargo mission. Posing are Steve Volz, associate director for flight programs in the Earth Science Division, NASA Headquarters, Washington, and Howard Eisen, RapidScat Project Manager. Credit: Ken Kremer – kenkremer.com
Stay tuned here for Ken’s continuing Earth and Planetary science and human spaceflight news.
Learn more about Commercial Space Taxis, Orion and NASA Human and Robotic Spaceflight at Ken’s upcoming presentations:
Oct 14: “What’s the Future of America’s Human Spaceflight Program with Orion and Commercial Astronaut Taxis” & “Antares/Cygnus ISS Rocket Launches from Virginia”; Princeton University, Amateur Astronomers Assoc of Princeton (AAAP), Princeton, NJ, 7:30 PM
Oct 23/24: “Antares/Cygnus ISS Rocket Launch from Virginia”; Rodeway Inn, Chincoteague, VA