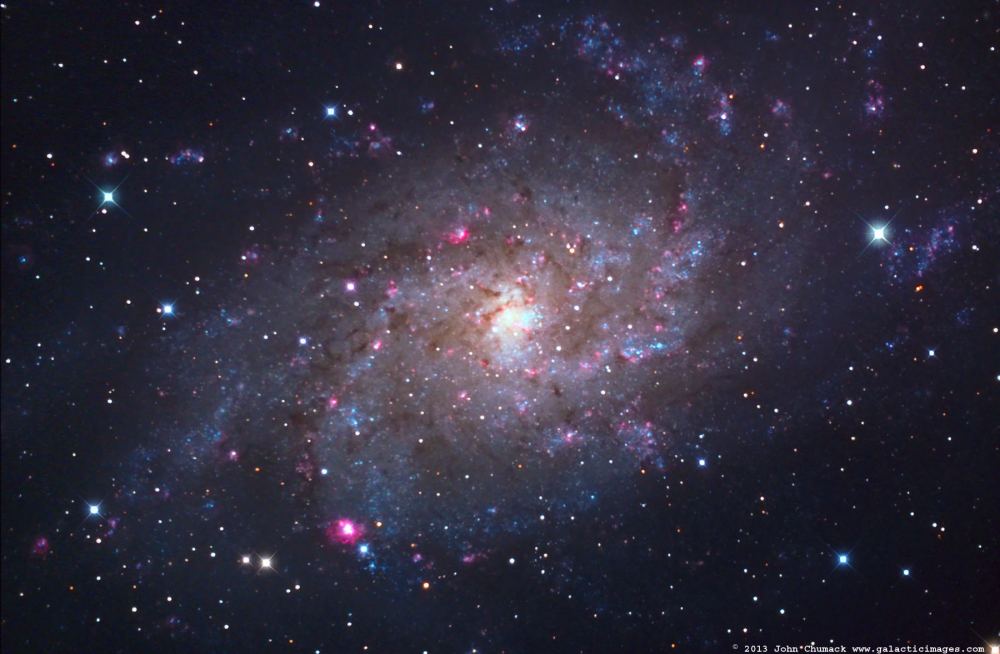
M33, the Triangulum Spiral Galaxy, seen here in a 4.3 hour exposure image. Astronomers used JWST to examine a section of its south spiral arm to search out and find nearly 800 newly forming stars. Credit and copyright: John Chumack.
We keep saying this: the universe is more complex than it appears. Conventional thinking in galaxy research postulates that spiral galaxies have star-forming areas, while ellipticals do not due to a lack of gas. While this thinking has been debunked, there’s now emerging research showing a “green valley” of galaxies somewhat in between these two types.
Basically, the research (which includes participation from citizen scientists in the Galaxy Zoo project) is showing that there are two different populations of “green” galaxies, between ellipticals and spirals. Further, what happens to star formation based upon gas in the area.
“In this paper, we take a look at the most crucial event in the life of a galaxy: the end of star formation. We often call this process ‘quenching’ and many astrophysicists have slightly different definitions of quenching. Galaxies are the place where cosmic gas condenses and, if it gets cold and dense enough, turns into stars. The resulting stars are what we really see as traditional optical astronomers,” wrote Kevin Schawinski, a Ph.D. student at the University of Oxford who is on the Galaxy Zoo team, in a blog post.
“Not all stars shine the same way though: stars much more massive than our sun are very bright and shine in a blue light as they are very hot. They’re also very short-lived. Lower mass stars take a more leisurely pace and don’t shine as bright (they’re not as hot). This is why star-forming galaxies are blue, and quiescent galaxies (or ‘quenched’ galaxies) are red: once star formation stops, the bluest stars die first and aren’t replaced with new ones, so they leave behind only the longer-lived red stars for us to observe as the galaxy passively evolves.”
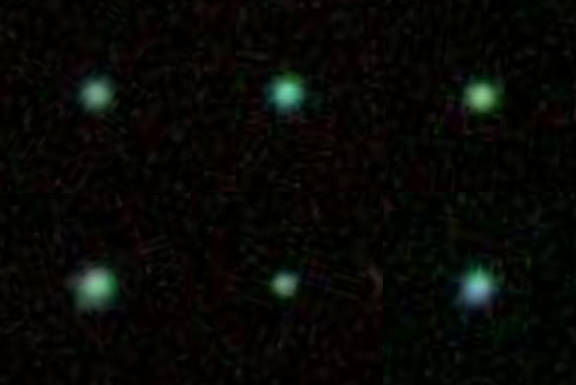
A montage of the six Green Pea galaxies that University of Michigan astronomy researchers studied. Image credit: Anne Jaskot
Today, we see an unobstructed view of the cosmos in all directions. But, a time existed near the Big Bang when the space between galaxies was an opaque fog where nothing could be seen. And according to two University of Michigan researchers, rare Green Pea galaxies, discovered in 2007, could offer clues into a pivotal step, called reionization, in the Universe’s evolution when space became transparent.
Reionization occurred just a few million years after the Big Bang. During this time, the first stars were beginning to blaze forth and galaxies. Astronomers believe these massive stars blasted the early universe with high-energy ultraviolet light. The UV light interacted with the neutral hydrogen gas it met, scraping off electrons and leaving behind a plasma of negatively charged electrons and positively charged hydrogen ions.
“We think this is what happened but when we looked at galaxies nearby, the high-energy radiation doesn’t appear to make it out. There’s been a push to find some galaxies that show signs of radiation escaping,” Anne Jaskot, a doctoral student in astronomy, says in a press release.
In findings released in the current edition of the Astrophysical Journal, Jaskot and Sally Oey, an associate professor of astronomy, the astronomers focused on six of the most intensely star-forming Green Pea galaxies between one billion and five billion light-years from Earth. The galaxies are compact and closely resemble early galaxies. The objects are thought to be a type of Luminous Blue Compact Galaxy, a type of starburst galaxy where stars are forming at prodigious rates. They were discovered in 2007 by volunteers with the citizen science project Galaxy Zoo. Named “peas” because of their fuzzy green appearance, the galaxies are very small. Scientists estimate that they are no larger than about 16,000 light-years across making them about the size of the Large Magellanic Cloud, a irregular galaxy near our Milky Way Galaxy.
Using data from the Sloan Digital Sky Survey, Jaskot and Oey studied the emission lines from the galaxies to determine how much light was absorbed. Emission lines tell astronomers not only what elements are present in the stars but also much about the intervening space. By studying this interaction, the researchers determined that the galaxies produced more radiation than observed, meaning some must have escaped.
“An analogy might be if you have a tablecloth and you spill something on it. If you see the cloth has been stained all the way to the edges, there’s a good chance it also spilled onto the floor,” Jaskot said. “We’re looking at the gas like the tablecloth and seeing how much light it has absorbed. It has absorbed a lot of light. We’re seeing that the galaxy is saturated with it and there’s probably some extra that spilled off the edges.”
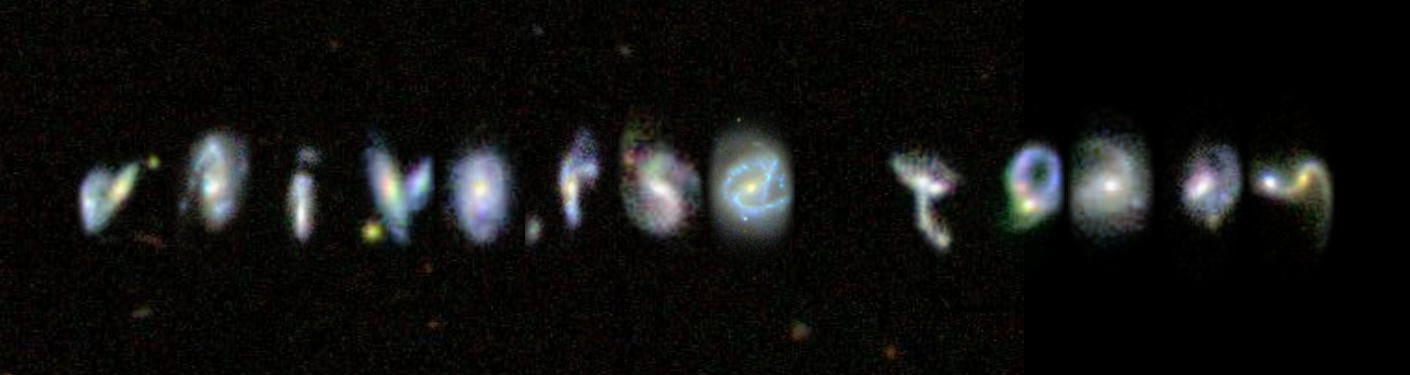
If you’re going to put your name in lights, you might as well go big; REALLY big. And with millions of galaxies forming all sorts of shapes including letters, numbers and punctuation, GalaxyZoo has created a way for you to do just that.
More than 250,000 people, sorting through about a million images, have taken part in the Galaxy Zoo project since its launch in 2007. “Their findings have ranged from the scientifically exciting to the weird and wonderful,” says the Galaxy Zoo team. And among the weird, the Zooites – that’s what project volunteers call themselves – have found an alphabet of galaxies.
The new “font,” available for anyone to use, is a way to thank all the Zooites for their hard work. But now a new challenge awaits.
Starting today, the Galaxy Zoo now has more than 250,000 new images of galaxies, most of which have never been seen by humans…. and the GZ team really wants them to be seen by humans!
But first, the reward:
Galaxy Zoo team member Dr. Steven Bamford, of the University of Nottingham, created the website at http://www.mygalaxies.co.uk allowing users to create a message in stars.
“We’d like to thank all those that have taken part in Galaxy Zoo in the past five years. Humans are better than computers at pattern recognition tasks like this, and we couldn’t have got so far without everyone’s help,” says Galaxy Zoo principal investigator Dr. Chris Lintott from the University of Oxford, in a press release. “Now we’ve got a new challenge, and we’d like to encourage volunteers old and new to get involved. You don’t have to be an expert — in fact we’ve found not being an expert tends to make you better at this task. There are too many images for us to inspect ourselves, but by asking hundreds of thousands of people to help us we can find out what’s lurking in the data.”
“The two sources of data work together perfectly: the new images from Sloan give us our most detailed view of the local universe, while the CANDELS survey from the Hubble telescope allows us to look deeper into the universe’s past than ever before,” says Astronomer and Galaxy Zoo team member Kevin Schawinski from ETH Zurich in Switzerland.
Team members are quick to point out, however, that the quirky nature of the galactic alphabet is not the focus of Galaxy Zoo. Finding unusual galaxies that resemble animals and letters help scientists learn about galaxy interactions as well as the formation and evolution of the biggest structures in the Universe.
About the author:John Williams is owner of TerraZoom, a Colorado-based web development shop specializing in web mapping and online image zooms. He also writes the award-winning blog, StarryCritters, an interactive site devoted to looking at images from NASA’s Great Observatories and other sources in a different way. A former contributing editor for Final Frontier, his work has appeared in the Planetary Society Blog, Air & Space Smithsonian, Astronomy, Earth, MX Developer’s Journal, The Kansas City Star and many other newspapers and magazines.
Galaxy Zoo was a project set up in July 2007 by astronomers Chris Lintott and Kevin Schawinski asking members of the public to help classify a million galaxy images produced by the Sloan Digital Sky Survey. Five years on and Galaxy Zoo has grown into an entire Zooniverse of projects allowing members to contribute to real science across a range of disciplines. Join us to celebrate the giant of citizen science, mark its achievements and look forward to the future.
Modern science can produce huge amounts of data and making sense of it all can take years and often needs a human eye to pick out the fine details. The Zooniverse unleashes an army of willing volunteers to pore over images and data sets. Galaxy Zoo members have now classified over 250 million galaxies. At the time of writing there are currently 656,773 people taking part in Zooniverse projects across the globe. Galaxy Zoo participants alone have contributed to more than 30 published scientific papers. One of the Zooniverse’s great strengths is the ability to throw up some unexpected discoveries like the now famous Hanny’s Voorwerp, named after Dutch school teacher Hanny van Arkel, the Galaxy Zoo volunteer who spotted it. Such a serendipitous discovery is possible when data is exposed to large numbers of users who are encouraged to flag up anything they think looks out of the ordinary.
To mark Galaxy Zoo’s 5th birthday there will be a relaunch of the project which will compare images using a new dataset from Hubble’s CANDELS survey of distant, early galaxies to what we see today.
The range of projects now available to members is extensive. Users of the Solar Stormwatch project analyse interactive diagrams produced by NASA’s Solar Terrestrial Relations Observatory (STEREO). Planet Hunters use data from Kepler to search for transiting exoplanets. The Milky Way Project users have access to image data from the Spitzer Space Telescope to identify infrared bubbles in the interstellar medium to help us understand how stars form. SETI Live searches for interesting signals coming from the Kepler Field. Moon Zoo participants use data from NASA’s Lunar Reconnaissance Orbiter (LRO) to catalogue features on the Moon down to the size of a wastepaper basket.
Away from space there are also projects involved in climate, nature and humanities. Old Weather is a project that models Earth’s climate using wartime shipping logs and Whale FM members listen to, and catagorize, the songs of Orcas to help understand what the whales are saying, while Ancient Lives gives participants the chance to decipher and study the Oxyrhynchus collection of papyri. The NEEMO project analyzes images of marine life and features taken from the underwater base at the National Marine Sanctuary in Key Largo, Florida. What’s the Score asks people to help describe over four thousand digitised musical scores made available by the Bodleian Libraries. With a global posse of citizen scientists eager to study real data at their disposal, the range of projects will likely grow over the coming years. So happy 5th Birthday Zooniverse and here’s to many more!
To find out more and how you can get involved visit the Zooniverse website
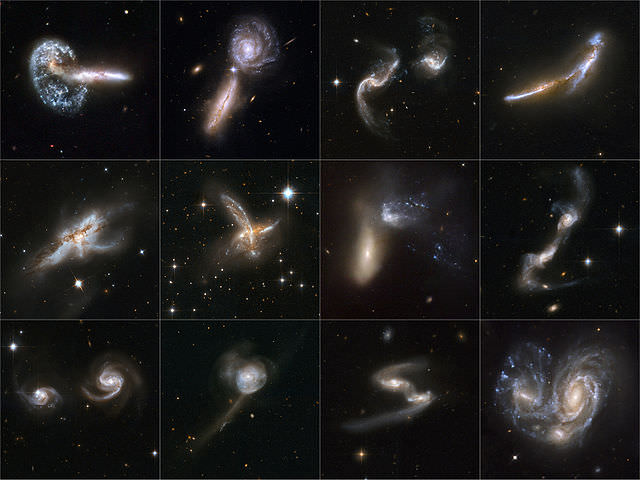
Lead image caption: Galaxies gone wild. Source NASA, ESA, the Hubble Heritage (STScI/AURA) ESA/Hubble Collaboration, and A. Evans (University of Virginia, Charlottesville/NRAO/Stony Brook University)
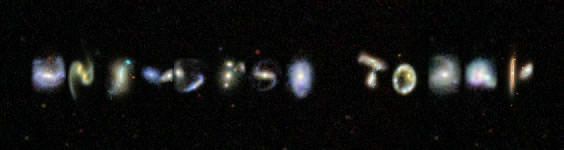
The name of everyone's favorite space news blog written in starlight!
[/caption]
Ever wanted to see your name in lights? How about star lights? Well there’s a fun little website that will let you assemble your name — or anything you want to say — using real galaxies as the letters… very cool!
Created by UK astronomer Steven Bamford, My Galaxies uses actual images of galaxies acquired through the Sloan Digital Sky Survey and Galaxy Zoo projects to create your message, which you can then share on Facebook, Twitter or email. You can even download a high-res version of the resulting PNG image (although I did find that I had to open the file in Photoshop and add a layer filled with black behind the galaxified letters, in order to clear out some background noise. Perhaps this can be fixed in the future.)
It’s a nice bit of coding, and makes for a cool banner or message for your favorite starry-eyed individual. Check it out!
“Really? There are galaxies that look like letters? OK, S and Z I can believe, but M? H? R? Capitals or little letters? What about punctuation, or numbers? Well, there aren’t many, but when you’ve got pictures of millions of galaxies and an energetic group of Zooites there isn’t much that can stay hidden!”
– Steven Bamford
Make your own My Galaxy message and read more about how it’s done here.
(Tip of the star-studded hat to Jennifer Oullette for the heads-up!)
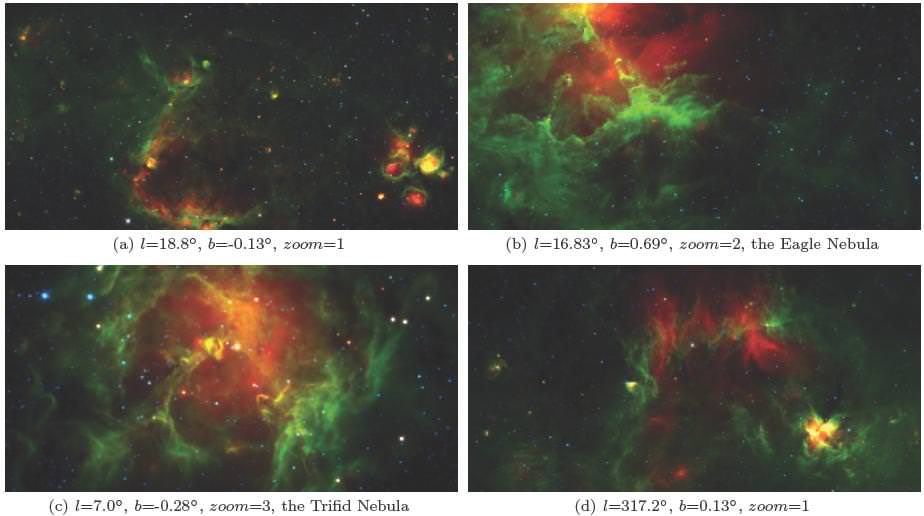
Ten Milky Way Project images most-favourited by volunteers, in no particular order. Coordinates are image centres, image sizes are indicated by the zoom level (zoom).
[/caption]
Score another one for citizen science! In a study released just days ago, a new catalog containing over five thousand infrared bubble entries was added through the “Milky Way Project” website. The work was done independently by at least five participants who measured parameters for position, radius, thickness, eccentricity and position angle. Not only did their work focus on these areas, but the non-professionals were responsible for recovering the locations of at least 86% of additional bubble and HII catalogs. Cool stuff? You bet. Almost one third of the Milky Way Project’s studied bubbles are located at the edge of an even larger bubble – or have more lodged inside. This opens the door to further understanding the dynamics of triggered star formation!
Just what is the Milky Way Project? Thanks to the Galaxy Zoo and Zooniverse, scientists have been able to enlist the help of an extensive community of volunteers able to tackle and analyze huge amounts of data – data that contains information which computer algorithms might miss. In this case it’s visually searching through the Galactic plane for whole or broken ring-shaped structures in images done by Spitzer’s Galactic Legacy Infrared Survey Extraordinaire (GLIMPSE) project. Here the bubbles overlap and the structures are so complex that only humans can sort them out for now.
Screenshot of the Milky Way Project user interface.“The MWP is the ninth online citizen science project created using the Zooniverse Application Programming Interface
(API) tool set. The Zooniverse API is the core software supporting the activities of all Zooniverse citizen science projects.” says R. J. Simpson (et al). “Built originally for Galaxy Zoo 2, the software is now being used by 11 different projects. The Zooniverse API is designed primarily as a tool for serving up a large collection of `assets’ (for example, images or video) to an interface, and collecting back user-generated interactions with these assets.”
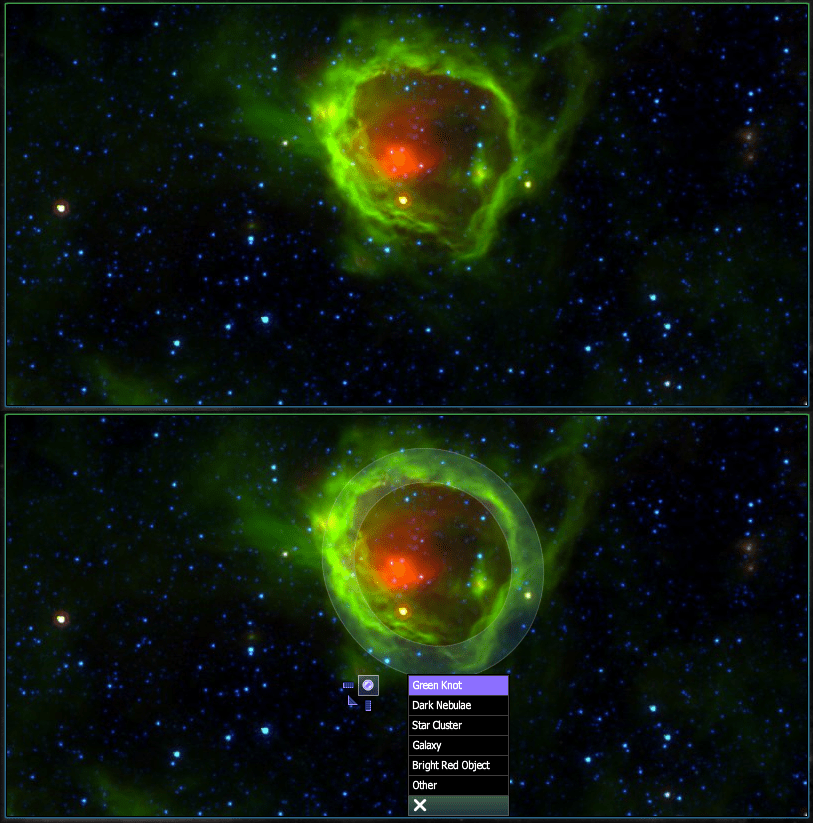
Through the interface, users mark the location of bubbles and other areas of significance such as small bubbles, green knots, dark nebulae, star clusters, galaxies, fuzzy red objects or simply unknowns. During this phase, the citizen scientist can make as many annotations as he or she wants before they submit their findings and receive a new assignment. Each annotated image is then stored in a database as a classification and the user can access their image again in an area of the website known as “My Galaxy”. However, images may only be classified once.
Example of raw user drawings and reduced, cleaned result using a sample MWP image. A GLIMPSE-only colour sam- ple is included to illustrate the dierences in the appearance of images inspected by CP06 and the MWP users.When identifying galactic bubbles, the user creates a circle around the area which can be scaled to size and stretched into an elliptical configuration. Initially as the object is identified and marked, the user can control the position and size of the bubble. Once annotated the parameters can be edited, such as the ellipticity, annular thickness and rotation. The program even allows for regions where no obvious emission is present, such as a broken or partial bubble. This allows the user to match the bubbles they find in individual images to achieve an accurate representation You can even mark a favorite or interesting configuration as well!
“In order to assist in the data-reduction process, users are given scores according to how experienced they are at drawing bubbles. We treat the first 10 bubbles a user draws as practice drawings and these are not included in the final reduction. Users begin with a score of 0 and are given scores according to the number of precision bubbles they have drawn.” explains the team. “Precision bubbles are those drawn using the full tool set, meaning they have to have adjusted the ellipticity, the thickness and the rotation. This is done to ensure that users’ scores reflect their ability to draw bubbles well. While only precision bubbles are used to score volunteers, all bubbles drawn as included in the data reduction. The scores are used as weights when averaging the bubble drawings to produce the catalogue.”
Now it’s time to combine all that data. As of October of last year, the program has created a database of 520,120 user-drawn bubbles. The information is then sorted out and processed – with many inclusions left for further investigation. However, not all bubbles make the cut. When it comes to this project, only bubbles that have been identified fifty times or more are included into the catalog. What remains is a “clean bubble” – one that has been verified by at least five users and picked out at least 10% of the time by the volunteers when displayed.
“It is not known how many bubbles exist in the Galaxy, hence it is impossible to quantify the completeness of the MWP catalogue. There will be bubbles that are either not visible in the data used on the MWP, or that are not seen as bubbles.” says the team. “Distant bubbles may be obscured by foreground extinction. Faint bubbles may be masked by bright Galactic background emission or confused with brighter nebular structures. Fragmented or highly distorted bubbles present at high inclination angles may not appear as bubbles to the observer.”
Error measurements for MWP bubble MWP1G309059+01661. This bubble has a hit rate of 0.437, and a dispersion of 1.61'. Top gures show reduced and raw bubble drawings. Bottom figures show dispersions in measurements of position and size.But don’t let it burst your bubble. This citizen science approach is an excellent idea from the the standpoint of observer objectivity and the final, reduced catalogue contains 5,106 visually identified bubbles. Of these, they are divided into a catalogue of 3,744 large bubbles identified by users as ellipses, and a catalogue of 1,362 small bubbles annotated by users at the highest zoom level images in the MWP.
And that’s not all… “In addition to the reduced bubble catalogue, a crowd sourced `heat map’ of bubble drawings has also been produced. The MWP `heat maps’ allow the bubble drawings to be explored without them needing to be reduced to elliptical annuli. Rather, the `heat maps’ allow contours of overlapping classifications to be drawn over regions of the Galactic plane reflecting levels of agreement between independent classifiers. In most cases the structures outlined in these maps are photo-dissociation regions traced by 8 um emission, but more fundamentally they are regions that multiple volunteers agree reflect the rims of bubbles.”
Yep. They are bubbles alright. Bubble produced around huge stars when an HII region is hollowed out by thermal overpressure, stellar winds, radiation pressure or a combination of them all. This impacts the surrounding, cold interstellar medium and creates a visible shell – or bubble. These regions serve as perfect observation points “to test theories of sequential, massive star formation triggered by massive star winds and radiation pressure” and to keep us forever fascinated…
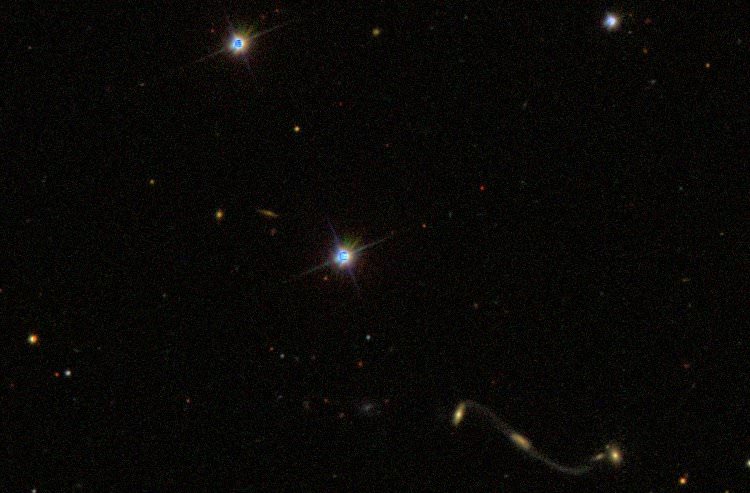
Shown at lower right is the "Violin Clef" galaxy merger. Click for larger image. Credit SDSS
[/caption]
About a month ago, a Galaxy Zoo contributor named Bruno discovered a very unique galaxy merger in the Sloan Digital Sky Survey data. The merger appeared to be a triple, or possibly quadruple system, which are indeed quite rare, and it includes curiously thin and long tidal tails. The Galaxy Zoo team has been informally referring to this merger as the “Violin Clef” or the “Integral” based on the unique shape as shown above.
What about this merger make it so interesting to scientists? What can they learn from these type of galaxy mergers?
Galaxy Zoo contributor Bruno had some insights on what makes the merger so interesting, stating: “These are some really beautiful tidal tails – They are extremely long and thin and appear curiously poor in terms of star formation, which is odd since mergers do tend to trigger star formation.” Bruno also added at the time of discovery: “There is no spectrum so we do not know the redshift of the object. It is also not clear if the objects at either end are associated or just a projection.”
(Note: Redshift is a term used to measure distance to distant objects. The higher the number, the older and more distant the object)
Based on Bruno’s curious discovery, the Galaxy Zoo team put in significant efforts to learn more about this merger. Galaxy Zoo team member Kyle Willett provided an update this week, highlighting several new insights, along with more information on this merger’s significance.
Close-Up view of Violin Clef galaxy merger. Image Credit: Sloan Digital Sky Survey ( http://www.sdss3.org )
One of the additional reasons the system is of scientific interest is that while merging galaxies are quite common in our universe, the merging process is fairly quick compared to the lifetime of a galaxy. What is not common is to observe a system with long tails and multiple companions, which gives researchers an opportunity to test their models of galaxy interaction against a system “caught in the act”.
Researchers are also interested in the content of galaxies and their tails – specifically the gas and stars. In most mergers, there is a compression of gas by gravity, which leads to a short burst of new star formation in the galaxies and their tails.
The resulting star formation results in young, hot stars which are typically blue. (Note: Younger/hotter stars are bluer, older/cooler stars are redder). What is odd about the Violin Clef merger is that all four galaxies and the tidal tails are red.
Willett stated “If that’s the case, then we want to estimate the current age of the system. Were the galaxies all red ellipticals to begin with, with very little gas that could form new stars?” Willett also added, “Or has the starburst already come and gone – and if so, how long-lived are these tidal tails going to be?”
By using analyzing the light given off by the merging galaxies, researchers can obtain a treasure trove of information. By measuring how much the spectra is redshifted, researchers can determine an accurate distance. In the case of the Violin Clef merger, an accurate redshift would let the team know for certain if all four galaxies genuinely belong to a single interacting group.
Once researchers have a distance estimate, they can study UV and radio flux data and determine an estimate of the total star formation rate. Additionally, if researchers have very accurate data from light received (spectroscopy), it’s possible to measure the relative velocities of each interacting galaxy, and build a sort of “3-D” picture of how the four galaxies are interacting.
Since there wasn’t any existing spectral analysis data of the merger system, Danielle Berg, a graduate student at the University of Minnesota, observed the Violin Clef in September using the 6.5-meter Multiple Mirror Telescope in Arizona and provided the additional data needed to answer some of the questions the Galaxy Zoo team had about the system.
Spectral analysis of the "Violin Clef" galaxy merger. Image Credit: Danielle Berg/University of Minnesota/Multiple Mirror Telescope
After the team analyzed the spectral data, they learned that all four galaxies are at the same redshift (z=0.0956 +- 0.002), and as such, are most likely members of the same group. Further analysis reinforced the lack of evidence for strong star formation, which helps to confirm the red colors see in the Sloan Digital Sky Survey data.
Based on these recent discoveries, the Galaxy Zoo team is putting out a second call for assistance on analyzing the Violin Clef merger. According to the team, the next step in the analysis will be working with simulations like the ones in Merger Zoo. Now that the team has confirmed the Violin Clef is almost certainly a quadruple merger, the number of merger models than need to be ran is greatly reduced.
How can citizen scientists help the Galaxy Zoo team with this step of their research?
You can start by visiting the Galaxy Zoo mergers project page at: http://mergers.galaxyzoo.org/
By participating in the Galaxy Zoo mergers project, you can identify simulations that resemble the Violin Clef. Your participation can also provide the Galaxy Zoo team with additional data which may enable them to have another scientific publication, plus these types of projects can be very fun and exciting to work with!
Learn more about becoming a Galaxy Zoo participant at: http://www.galaxyzoo.org/how_to_take_part
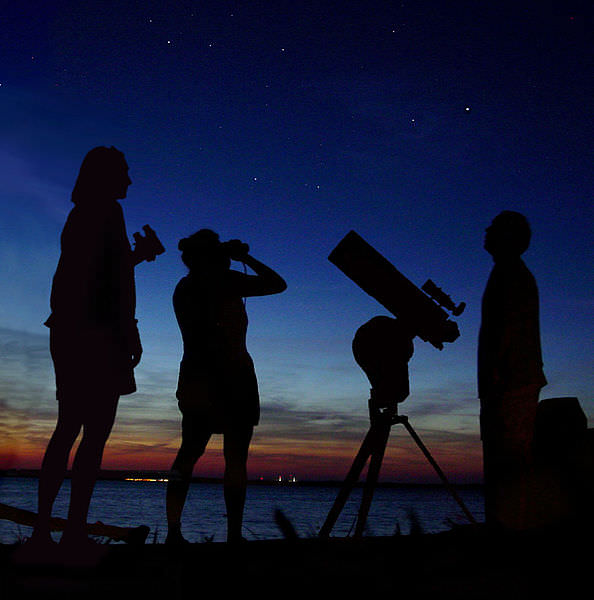
Three people enjoy the summer sky over the Delaware river, NJ, USA in August 2006. Image Credit: Wikimedia
[/caption]
It’s a great time to be an amateur astronomer! Nowadays, “backyard” astronomers armed with affordable CCD imagers, high-quality tracking mounts, inexpensive PC’s and the internet at their fingertips are making real contributions to Astronomy science.
How are people in their backyards contributing to real science these days?
Consider that in 1991, the Hubble Space Telescope launched with a main camera of less than 1 megapixel. (HST’s array was 800×800 pixels – just over half a megapixel). Currently, “off-the-shelf” imaging equipment available for a few hundred dollars or less easily provides 1 megapixel or more. Even with a “modest” investment, amateurs can easily reach the ten megapixel mark. Basically, the more pixels you have in your imaging array, the better resolution your image will have and the more detail you’ll capture (sky conditions notwithstanding).
With access to fairly high resolution cameras and equipment, many amateurs have taken breathtaking images of the night sky. Using similar equipment other hobbyists have imaged comets, supernovae, and sunspots. With easy access to super-precise tracking mounts and high-quality optics, it’s no wonder that amateur astronomers are making greater contributions to science these days.
One spectacular example of amateur discoveries was covered by Universe Todayearlier this year. Kathryn Aurora Gray, a ten year old girl from Canada, discovered a supernova with the assistance of her father and another amateur astronomer, David Lane. The discovery of Supernova 2010lt (located in galaxy UGC 3378 in the constellation of Camelopardalis) was Kathryn’s first, her father’s seventh and Lane’s fourth supernova discovery. You can read the announcement regarding Ms. Gray’s discovery courtesy of The Royal Astronomical Society of Canada at: http://www.rasc.ca/artman/uploads/sn2010lt-pressrelease.pdf
Often times when a supernova is detected, scientists must act quickly to gather data before the supernova fades. In the image below, look for the blinking “dot. The image is a before and after image of the area surrounding Supernova 2010lt.
A before and after animation of Supernova 2010lt. Credit: Dave Lane
Before Kathyrn Gray, astronomer David Levy made headlines with his discovery of comet Shoemaker-Levy 9. In 1994, comet Shoemaker-Levy 9 broke apart and collided with Jupiter’s atmosphere. Levy has gone on to discover over twenty comets and dozens of asteroids. Levy has also published several books and regularly contributes articles to various astronomy publications. If you’d like to learn more about David Levy, check out his internet radio show at http://www.letstalkstars.com/, or visit his site at http://www.jarnac.org/
Hubble image of comet P/Shoemaker-Levy 9, taken on May 17, 1994. Image Credit: H.A. Weaver, T. E. Smith (Space Telescope Science Institute), and NASAThe International Space Station and Space Shuttle Atlantis transiting the sun. Image Credit: Thierry Legault
Rounding out news-worthy astronomers, astrophotographer Thierry Legault has produced many breathtaking images that have been featured here on Universe Today on numerous occasions. Over the past year, Thierry has taken many incredible photos of the International Space Station and numerous images of the last few shuttle flights. Thierry’s astrophotography isn’t limited to just the sun, or objects orbiting Earth. You can read more about the objects Thierry captures images of at: http://www.astrophoto.fr/ You can also read more about Thierry and the equipment he uses at: http://legault.perso.sfr.fr/info.html
Performing science as an amateur isn’t limited to those with telescopes. There are many other research projects that ask for public assistance. Consider the Planet Hunters site at: http://www.planethunters.org/. What Planet Hunters aims to achieve is a more “hands-on” approach to interpreting the light curves from the publicly available data from the Kepler planet finding mission. Planet Hunters is part of the Zooniverse, which is a collection of citizen science projects. You can learn more about the complete collection of Zooniverse projects at: http://www.zooniverse.org
Another citizen science effort recently announced is the Pro-Am White Dwarf Monitoring (PAWM) project. Led by Bruce Gary, the goal of the project is to explore the possibility of using amateur and professional observers to estimate the percentage of white dwarfs exhibiting transits by Earth-size planets in the habitable zone. The results from such a survey are thought to be useful in planning a comprehensive professional search for white dwarf transits. You can read more about the PAWM project at: http://www.brucegary.net/WDE/
Transit simulation. Image Credit: Manuel Mendez/PAWM
One very long standing citizen project is the American Association of Variable Star Observers (AAVSO). Founded in 1911, the AAVSO coordinates, evaluates, compiles, processes, publishes, and disseminates variable star observations to the astronomical community throughout the world. Currently celebrating their 100th year, the AAVSO not only provides raw data, but also publishes The Journal of the AAVSO, a peer-reviewed collection of scientific papers focused on variable stars. In addition to data and peer reviewed journals, the AAVSO is active in education and outreach, with many programs, including their mentor program designed to assist with disseminating information to educators and the public.
If you’d like to learn more about the AAVSO, including membership information, visit their site at: http://www.aavso.org/
For over a decade, space enthusiasts across the internet have been taking part in SETI@Home. The official description of SETI@home is “a scientific experiment that uses Internet-connected computers in the Search for Extraterrestrial Intelligence (SETI)”. By downloading special client software from the SETI@Home website at http://setiathome.berkeley.edu/, volunteers from around the world can help analyze radio signals and assist with SETI’s efforts to find “candidate” radio signals. You can learn more about SETI@Home by visiting http://setiathome.berkeley.edu/sah_about.php
The projects and efforts featured above are just a small sample of the many projects that non-scientists can participate in. There are many other projects involving radio astronomy, galaxy classification, exoplanets, and even projects involving our own solar system. Volunteers of all ages and educational backgrounds can easily find a project to help support.
Ray Sanders is a Sci-Fi geek, astronomer and space/science blogger. Visit his website Dear Astronomer and follow on Twitter (@DearAstronomer) or Google+ for more space musings.
The Milky Way Project allows anyone to help catalog bubbles and other interesting features in images taken from a robotic infrared survey. Image Credit: Spitzer/The Milky Way Project
[/caption]
From the folks that brought you the addictive citizen science projects Galaxy Zoo and Moon Zoo (among others), comes yet another way to explore our Universe and help out scientists at the same time. The Milky Way Project invites members of the public to look at images from infrared surveys of our Milky Way and flag features such as gas bubbles, knots of gas and dust and star clusters.
As with the other Zooniverse projects, the participation of the public is a core feature. Accompanying the Milky Way Project is a way for Zooniverse members – lovingly called “zooites” – to discuss the images they’ve cataloged. Called Milky Way Talk, users can submit images they find curious or just plain beautiful to the talk forum for discussion.
The Milky Way Project uses data from the Galactic Legacy Infrared Mid-Plane Survey Extraordinaire (GLIMPSE) and the Multiband Imaging Photometer for Spitzer Galactic Plane Survey (MIPSGAL). These two surveys have imaged the Milky Way in infrared light at different frequencies. GLIMPSE at 3.6, 4.5, 5.8, and 8 microns, and MIPSGAL at 24 and 70 microns. In the infrared, things that don’t emit much visible light – such as large gas clouds excited by stellar radiation – are apparent in images.
The new project aims at cataloging bubbles, star clusters, knots of gas and dark nebulae. All of these objects are interesting in their own ways.
Bubbles – large structures of gas in the galactic plane – belie areas where young stars are altering the interstellar medium that surrounds them. They heat up the dust and/or ionize the gas that surrounds them, and the flow of particles from the star pushes the diffuse material surrounding out into bubble shapes.
The green knots are where the gas and dust are more dense, and might be regions that contain stellar nurseries. Similarly, dark nebulae – nebulae that appear darker than the surrounding gas – are of interest to astronomers because they may also point to stellar formation of high-mass stars.
Star clusters and galaxies outside of the Milky Way may also be visible in some of the images. Though the cataloging of these objects isn’t the main focus of the project, zooites can flag them in the images for later discussion. Just like in the other Zooniverse projects, which use data from robotic surveys, there is always the chance that you will be the first person ever to look at something in one of the images. You could even be like Galaxy Zoo member Hanny and discover something that astronomers will spend telescope time looking at! This image is full of objects that are interesting to astronomers for study. You can help them pick out which things to study. Image Credit: Spitzer/The Milky Way Project
The GLIMPSE-MIPSGAL surveys were performed by the Spitzer Space Telescope. Over 440,000 images – all taken in the infrared – are in the catalog and need to be sifted through. This is a serious undertaking, one that cannot be accomplished by graduate students in astronomy alone.
In cataloging these bubbles for subsequent analysis, Milky Way Project members can help astronomers understand both the interstellar medium and the stars themselves imaged by the survey. It will also help them to make a map of the Milky Way’s stellar formation regions.
As with the other Zooniverse projects, this newest addition relies on the human brain’s ability to pick out patterns. Diffuse or oddly-shaped bubbles – such as those that appear “popped” or are elliptical – are difficult for a computer to analyze. So, it’s up to willing members of the public to help out the astronomy community. The Zooniverse community boasts over 350,000 members participating in their various projects.
A little cataloging and research of these gas bubbles has already been done by researchers. The Milky Way Project site references work by Churchwell, et. al, who cataloged over 600 of the bubbles and discovered that 75% of the bubbles they looked at were created by type B4-B9 stars, while 0-B3 stars make up the remainder (for more on what these stellar types mean, click here).
A zoomable map that uses images from the surveys – and has labeled a lot of the bubbles that have been already cataloged by the researchers- is available at Alien Earths.
For an extensive treatment of just how important these bubbles are to understanding stars and their formation, the paper “IR Dust Bubbles: Probing the Detailed Structure and Young Massive Stellar Populations of Galactic HII Regions” by Watson, et. al is available here.
If you want to get cracking on drawing bubbles and cataloging interesting features of our Milky Way, take the tutorial and sign up today.
Aside from categorizing galaxies, another component of the Galaxy Zoo project has been asking participants to identify potential supernovae (SNe). The first results are out and have identified “nearly 14,000 supernova candidates from [Palomar Transient Factory, (PTF)] were classified by more than 2,500 individuals within a few hours of data collection.”
Although the Galaxy Zoo project is the first to employ citizens as supernova spotters, the background programs have long been in place but were generating vast amounts of data to be processed. “The Supernova Legacy Survey used the MegaCam instrument on the 3.6m Canada-France-Hawaii Telescope to survey 4 deg2” every few days, in which “each square degree would typically generate ~200 candidates for each night of observation.” Additionallly, “[t]he Sloan Digital Sky Survey-II Supernova Survey used the SDSS 2.5m telescope to survey a larger area of 300 deg2” and “human scanners viewed 3000-5000 objects each night spread over six scanners”.
To ease this burden, the highly successful Galaxy Zoo implemented a Supernova Search in which users would be directed through a decision tree to help them determine what computer algorithms were proposing as transient events. Each image would be viewed and decided on by several participants increasing the likelihood of a correct appraisal. Also, “with a large number of people scanning candidates, more candidates can be examined in a shorter amount of time – and with the global Zooniverse (the parent project of Galaxy Zoo) user base this can be done around the clock, regardless of the local time zone the science team happens to be based in” allowing for “interesting candidates to be followed up on the same night as that of the SNe discovery, of particular interest to quickly evolving SNe or transient sources.”
To identify candidates for viewing, images are taken using the 48 inch Samuel Oschin telescope at the
Palomar Observatory. Images are then calibrated to correct instrumental noise and compared automatically to reference images. Those in which an object appears with a change greater than five standard deviations from the general noise are flagged for inspection. While it may seem that this high threshold would eliminate other events, the Supernova Legacy Survey, starting with 200 candidates per night, would only end up identifying ~20 strong candidates. As such, nearly 90% of these computer generated identifications were spurious, likely generated by cosmic rays striking the detector, objects within our own solar system, or other such nuisances and demonstrating the need for human analysis.
Still, the PTF identifies between 300 and 500 candidates each night of operation. When exported to the Galaxy Zoo interface, users are presented with three images: The first is the old, reference image. The second is the recent image, and the third is the difference between the two, with brightness values subtracted pixel for pixel. Stars which didn’t change brightness would be subtracted to nothing, but those with a large change (such as a supernova), would register as a still noticeable star.
Of course, this method is not flawless, which also contributes to the false positives from the computer system that the decision tree helps weed out. The first question (Is there a candidate centered in the crosshairs of the right-hand [subtracted] image?) eliminates misprocessing by the algorithm due to misalignment. The second question (Has the candidate itself subtracted correctly?) serves to drop stars that were so bright, they saturated the CCD, causing odd errors often resulting in a “bullseye” pattern. Third (Is the candidate star-like and approximately circular?), users eliminate cosmic ray strikes which generally only fill one or two pixels or leave long trails (depending on the angle at which they strike the CCD). Lastly, users are asked if “the candidate centered in a circular host galaxy?” This sets aside identifications of variable stars within our own galaxy that are not events in other galaxies as well as supernovae that appear in the outskirts of their host galaxies.
Each of these questions is assigned a number of positive or negative “points” to give an overall score for the identification. The higher the score, the more likely it is to be a true supernova. With the way the structure is set up, “candidates can only end up with a score of -1, 1 or 3 from each classification, with the most promising SN candidates scored 3.” If enough users rank an event with the appropriate score, the event is added to a daily subscription sent out to interested parties.
To confirm the reliability of identifications, the top 20 candidates were followed up spectroscopically with the 4.2m William Herschel Telescope. Of them, 15 were confirmed as SNe, with 1 cataclysmic variable, and 4 remain unknown. When compared to followup observations from the PTF team, the Galaxy Zoo correctly identified 93% of supernova that were confirmed spectroscopically from them. Thus, the identification is strong and this large volume of known events will certainly help astronomers learn more about these events in the future.
If you’d like to join, head over to their website and register. Presently, all supernovae candidates have been processed, but the next observing run is coming up soon!