When do Black Holes Become Active? The Case of the Strangely-Shaped Galaxy Mrk 273

Mrk 273 as seen by the Hubble Space Telescope.

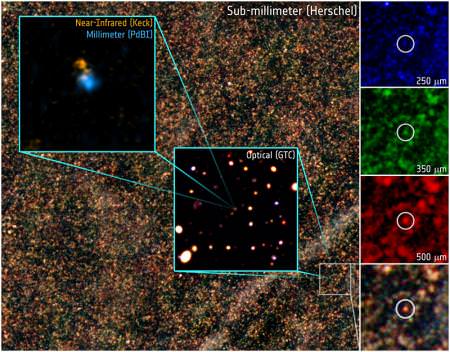
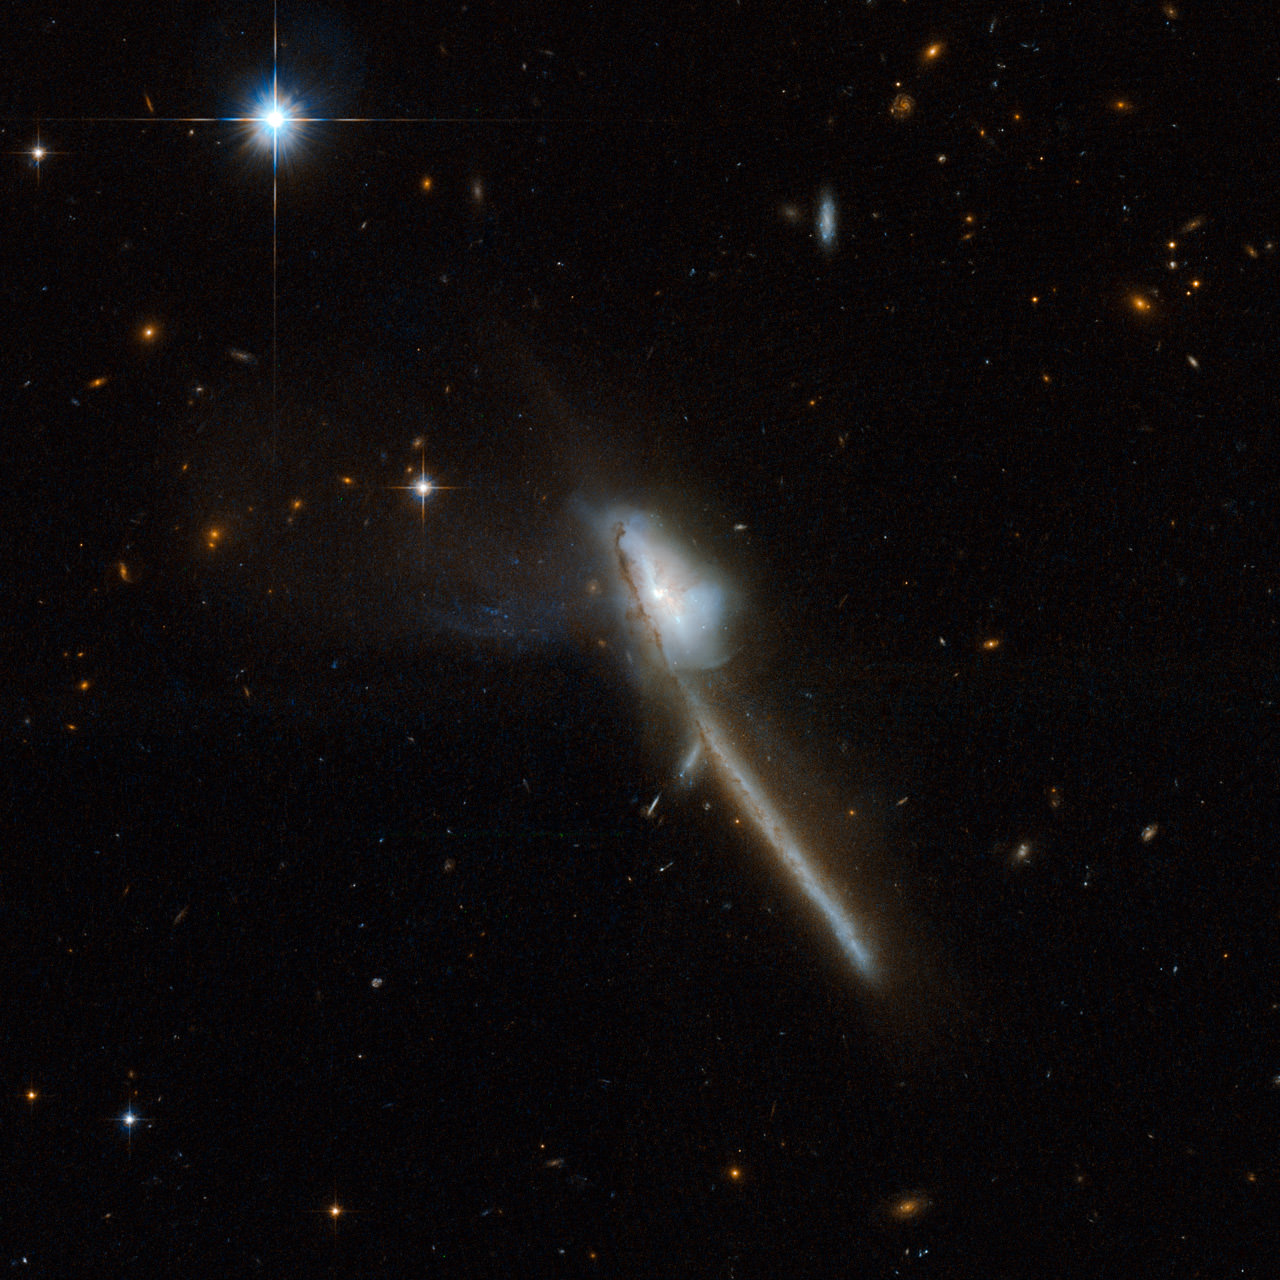
The Hubble image above shows a strange galaxy, known as Mrk 273.  The odd shape – including the infrared bright center and the long tail extending into space for 130 thousand light-years – is strongly indicative of a merger between galaxies.

Near-infrared observations have revealed a nucleus with multiple components, but for years the details of such a sight have remained obscured by dust. With further data from the Keck Telescope, based in Hawaii, astronomers have verified that this object is the result of a merger between galaxies, with the infrared bright center consisting of two active galactic nuclei – intensely luminous cores powered by supermassive black holes.

At the center of every single galaxy is a supermassive black hole. While the name sounds exciting, our supermassive black hole, Sgr A* is pretty quiescent.  But at the center of every early galaxy looms the opposite: an active galactic nuclei (AGN for short). There are plenty of AGN in the nearby Universe as well, but the question stands: how and when do these black holes become active?

In order to find the answer astronomers are looking at merging galaxies. When two galaxies collide, the supermassive black holes fall toward the center of the merged galaxy, resulting in a binary black hole system. At this stage they remain quiescent black holes, but are likely to become active soon.

“The accretion of material onto a quiescent black hole at the center of a galaxy will enable it to grow in size, leading to the event where the nucleus is “turned on” and becomes active,” Dr. Vivian U, lead author on the study, told Universe Today. “Since galaxy interaction provides means for gaseous material in the progenitor galaxies to lose angular momentum and funnels toward the center of the system, it is thought to play a role in triggering AGN.  However, it has been difficult to pinpoint exactly how and when in a merging system this triggering occurs.”

While it has been known that an AGN can “turn on” before the final coalescence of the two black holes, it is unknown as to when this will happen. Quite a few systems do not host dual AGN.  For those that do, we do not know whether synchronous ignition occurs or not.

Mrk 273 provides a powerful example to study. The team used near-infrared instruments on the Keck Telescope in order to probe past the dust.  Adaptive optics also removed the blurring affects caused by the Earth’s atmosphere, allowing for a much cleaner image – matching the Hubble Space Telescope, from the ground.

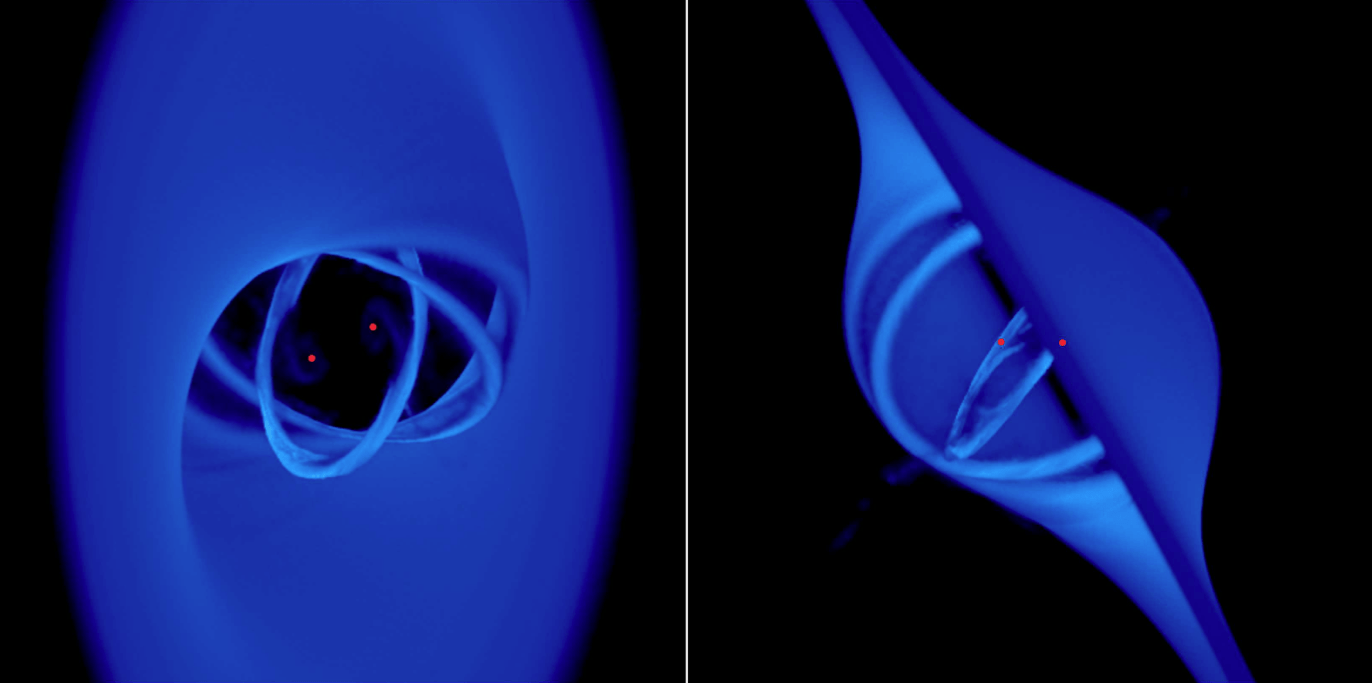
“The punch line is that Mrk 273, an advanced late-stage galaxy merger system, hosts two nuclei from the progenitor galaxies that have yet to fully coalesce,” explains Dr. U. The presence of two supermassive black holes can be easily discerned from the rapidly rotating gas disks that surround the two nuclei.

“Both nuclei have already been turned on as evidenced by collimated outflows (a typical AGN signature) that we observe” Dr. U told me. Such a high amount of energy released from both supermassive black holes suggests that Mrk 273 is a dual AGN system. These exciting results mark a crucial step in understanding how galaxy mergers may “turn on” a supermassive black hole.

The team has collected near-infrared data for a large sample of galaxy mergers at different merging states.  With the new data set, Dr. U aims “to understand how the nature of the nuclear star formation and AGN activity may change as a galaxy system progresses through the interaction.”

The results will be published in the Astrophysical Journal (preprint available here).


How Do Black Holes Get Super Massive?

A binary black hole pair with an accretion disk inclined 45 degrees. Source: Nixon et al.

Since their discovery, supermassive black holes – the giants lurking in the center of every galaxy – have been mysterious in origin. Astronomers remain baffled as to how these supermassive black holes became so massive.

New research explains how a supermassive black hole might begin as a normal black hole, tens to hundreds of solar masses, and slowly accrete more matter, becoming more massive over time. The trick is in looking at a binary black hole system.  When two galaxies collide the two supermassive black holes sink to the center of the merged galaxy and form a binary pair.  The accretion disk surrounding the two black holes becomes misaligned with respect to the orbit of the binary pair. It tears and falls onto the black hole pair, allowing it to become more massive.

In a merging galaxy the gas flows are turbulent and chaotic. Because of this “any gas feeding the supermassive black hole binary is likely to have angular momentum that is uncorrelated with the binary orbit,” Dr. Chris Nixon, lead author on the paper, told Universe Today. “This makes any disc form at a random angle to the binary orbit.

Nixon et al. examined the evolution of a misaligned disk around a binary black hole system using computer simulations. For simplicity they analyzed a circular binary system of equal mass, acting under the effects of Newtonian gravity. The only variable in their models was the inclination of the disk, which they varied from 0 degrees (perfectly aligned) to 120 degrees.

After running multiple calculations, the results show that all misaligned disks tear. Watch tearing in action below:

In most cases this leads to direct accretion onto the binary.

“The gravitational torques from the binary are capable of overpowering the internal communication in the gas disc (by pressure and viscosity),” explains Nixon. “This allows gas rings to be torn off, which can then be accreted much faster.”

Such tearing can produce accretion rates that are 10,000 times faster than if the exact same disk were aligned.

In all cases the gas will dynamically interact with the binary.  If it is not accreted directly onto the black hole, it will be kicked out to large radii.  This will cause observable signatures in the form of shocks or star formation.  Future observing campaigns will look for these signatures.

In the meantime, Nixon et al. plan to continue their simulations by studying the effects of different mass ratios and eccentricities.  By slowly making their models more complicated, the team will be able to better mimic reality.

Quick interjection: I love the simplicity of this analysis. These results provide an understandable mechanism as to how some supermassive black holes may have formed.

While these results are interesting alone – based on that sheer curiosity that drives the discipline of astronomy forward – they may also play a more prominent role in our local universe.

Before we know it (please read with a hint of sarcasm as this event will happen in 4 billion years) we will collide with the Andromeda galaxy. This rather boring event will lead to zero stellar collisions and a single black hole collision – as the two supermassive black holes will form a binary pair and then eventually merge.

Without waiting for this spectacular event to occur, we can estimate and model the black hole collision.  In 4 billion years the video above may be a pretty good representation of our collision with the Andromeda galaxy.

The results have been published in the Astrophysical Journal Letters (preprint available here). (Link was corrected to correct paper on 8/15/2013).

Weekly Space Hangout – July 26, 2013

It’s time for another Weekly Space Hangout, where a dedicated team of space journalists run down all the big stories in space and astronomy for the week of July 26, 2013.

Host: Fraser Cain

Panel: Jason Major, Scott Lewis, David Dickinson

Stories:
Astrological Sign of the Royal Baby
Cosmos Trailer Showcased at Comiccon
Asteroid 2003 DZ15 Close Pass on Monday
Comet ISON Image with Galaxies
Delta Aquarids Meteor Shower
Pale Blue Dot II
Apollo 11 Anniversary
Some Success with the Kepler Recovery

We record the Weekly Space Hangout live as a Google+ Hangout on Air every Friday at Noon Pacific, 3:00 pm Eastern. You can watch the show live on Google+, or here on Universe Today. But you can also watch the archive after the fact, if live video isn’t your thing.

Weekly Space Hangout – July 19, 2013

Here’s our Weekly Space Hangout for July 19, 2013. Watch as a team of space and astronomy journalists discuss the big space stories of the week. We do this every Friday at 12:00 pm Pacific Time / 3:00 pm Eastern Time. You can join us live, or watch the archive here or on Google+.

Host: Fraser Cain

Participants: Sondy Springmann, Amy Shira Teitel, Jason Major, David Dickenson, Dr. Matthew Francis

And here are the stories that we covered.

Stars, Galaxies, and Comet ISON Grace a New Image from Hubble

Comet ISON seen against a background of stars and galaxies (Source: /hubblesite.org)

This image of the steadily-approaching Comet ISON, made from observations with the Hubble Space Telescope on April 30, show not only the comet itself but also a rich background of stars located within our own galaxy and even the distant spirals of entire galaxies much, much farther away — as Josh Sokol describes it on HubbleSite.org’s ISONblog it’s like the astronomy stickers you’d get for your kid’s bedroom, except you’d never get to see such a scene in real life “unless, of course, you had Hubble.”

Comet C/2012 S1 (ISON) is currently on its way into the inner Solar System on course for a close encounter with the Sun, zooming along at 77,250 km/h (48,000 miles per hour). It will make its closest pass by the Sun on November 28 (coming within just .012 AU) and will hopefully put on a pretty spectacular show in the night sky —  especially if it survives the trip.

The track of Comet ISON through the constellations Gemini, Cancer and Leo prior to perihelion. (Credit: NASA/GSFC/Axel Mellinger).
Comet ISON’s projected path through the night sky prior to perihelion. (Credit: NASA/GSFC/Axel Mellinger)

Watch: Comet ISON Timelapse Hubble Movie

The image above was created from multiple Hubble observations earlier this year, some geared toward capturing ISON and others calibrated more for distant, dimmer objects like galaxies and far-flung stars. By combining the results we get a view of a comet speeding through space with an almost too-perfect hyperrealism, courtesy of NASA’s hardest-working space telescope.

“The result is part science, part art. It’s a simulation of what our eyes, with their ability to dynamically adjust to brighter and fainter objects, would see if we could look up at the heavens with the resolution of Hubble. The result is a hodepodge of almost all the meat-and-potatoes subjects of astronomy – no glow-in-the-dark stickers required.”

– Josh Sokol, HubbleSite ISONblog

Learn about other ways NASA will be observing Comet ISON here.

Source: HubbleSite.org

Jets Boost — Not Hinder — Star Formation in Early Galaxies, New Study Suggests

An artist's conception of jets protruding from a quasar. Credit: ESO/M. Kornmesser

Understanding the formation of stars and galaxies early in the Universe’s history continues to be somewhat of an enigma, and a new study may have turned our current understanding on its head. A recent survey used archival data from four different telescopes to analyze hundreds of galaxies. The results provided overwhelming evidence that radio jets protruding from a galactic center enhance star formation – a result that directly contradicts current models, where star formation is hindered or even stopped.

All early galaxies consist of intensely luminous cores powered by huge black holes.  These so-called active galactic nuclei, or AGN for short, are still the topic of intense study. One specific mechanism astronomers are studying is known as AGN feedback.

“Feedback is the astronomer’s slang term for the way in which an AGN – with its large amount of energy release – influences its host galaxy,” Dr. Zinn, lead researcher on this study, recently told Universe Today. He explained there is both positive feedback, in which the AGN will foster the main activity of the galaxy: star formation, and negative feedback, in which the AGN will hinder or even stop star formation.

Current simulations of galaxy growth invoke strong negative feedback.

“In most cosmological simulations, AGN feedback is used to truncate star formation in the host galaxy,” said Zinn. “This is necessary to prevent the simulated galaxies from becoming too bright/massive.”

Zinn et al. found strong evidence that this is not the case for a large number of early galaxies, claiming that the presence of an AGN actually enhances star formation. In such cases the total star formation rate of a galaxy may be boosted by a factor of 2 – 5.

Furthermore the team showed that positive feedback occurs in radio-luminous AGN. There is strong correlation between the far infrared (indicative of star formation) and the radio.

Now, a correlation between the radio and the far infrared is no stranger to galactic astronomy. Stars form in extremely dusty regions. This dust absorbs the starlight and re-emits it in the far infrared. The stars then die in huge supernova explosions, causing powerful shock-fronts, which accelerate electrons and lead to the emission of strong synchrotron radiation in the radio.

This correlation however is a stranger to AGN studies. The key lies in the radio jets, which penetrate far into the host galaxy itself.  A “jet which is launched from the AGN hits the interstellar gas of the host galaxy and thereby induces supersonic shocks and turbulence,” explains Zinn. “This shortens the clumping time of gas so that it can condense into stars much more quick and efficiently.”

This new finding conveys that the exact mechanisms in which AGN interact with their host galaxies is much more complicated than previously thought. Future observations will likely shed a new understanding of the evolution of galaxies.

The team used data primarily from the Chandra Deep Field South image
but also data from Hubble, Herschel and Spitzer.

The results will be published in the Astrophysical Journal (preprint available here).

Astronomers Refine Distances to our Closest Spiral-Galaxy Neighbors

M31 and M33 are two of the nearest spiral galaxies, and can form the basis for determining distances to more remote spiral galaxies and constraining the expansion rate of the Universe (the Hubble constant).  Hence the relevance and importance of several new studies that employed near-infrared data to establish solid distances for M31 (Andromeda) and M33 (Triangulum) (e.g., Gieren et al. 2013), and aimed to reduce existing uncertainties tied to the fundamental parameters for those galaxies.  Indeed, reliable distances for M31 and M33 are particularly important in light of the new Hubble constant estimate from the Planck satellite, which is offset relative to certain other results, and that difference hinders efforts to ascertain the nature of dark energy (the mysterious force theorized as causing the Universe’s accelerated expansion).

Gieren et al. remarked that, “a number of new distance determinations to M33 … span a surprisingly large interval … which is a cause of serious concern. As the second-nearest spiral galaxy, an accurate determination of [M33’s] distance is a crucial step in the process of building the cosmic distance ladder.”  Concerning M31, Riess et al. 2012 likewise remarked that “M31, the nearest analogue of the Milky Way Galaxy, has long provided important clues to understanding the scale of the Universe.

 The new Gieren and Riess et al. distances are based on near-infrared observations, which are pertinent because radiation from that part of the electromagnetic spectrum is less sensitive than optical data to absorption by dust located along our sight-line (see the figure below).  Properly accounting for the impact of dust is a principal problem in cosmic distance scale work, since it causes targets to appear dimmer.  “different assumptions about [dust obscuration] are a prime source for the discrepancies among the various distance determinations for M33.” noted Gieren et al., and the same is true for the distance to M31 (see Riess et al.).

Optical and near-infrared images highlight how dust obscures light emitted from a target along the line-of-sight.  The near-infrared observations are less sensitive to that obscuration (image credit: Alves et al. 2001).
Optical and near-infrared images highlight how dust obscures light emitted from targets along the sight-line, and that the level of obscuration is wavelength dependent. New distances established for M31 and M33 are based on near-infrared observations, which are less sensitive to that obscuration (image credit: Alves et al. 2001).

The Gieren and Riess et al. distances to M33 and M31, respectively, were inferred from observations of Cepheids.   Cepheids are a class of variable stars that exhibit periodic brightness variations (they pulsate radially).  Cepheids can be used as distance indicators because their pulsation period and mean luminosity are correlated.  That relationship was discovered by Henrietta Leavitt in the early 1900s.  A pseudo period-luminosity relation derived for M31 Cepheids is presented below.

Gieren et al. observed 26 Cepheids in M33 and established a distance of ~2,740,000 lightyears.  The team added that, “As the first modern near-infrared Cepheid study [of] M33 since … some 30 years … we consider this work as long overdue …”  Astronomers often cite distances to objects in lightyears, which defines the time required for light emitted from the source to reach the observer. Despite the (finite) speed of light being 300,000,000 m/s, the rays must traverse “astronomical” distances.   Gazing into space affords one the unique opportunity to peer back in time.

A relation exists between a Cepheid's a periodic brightness variations and its luminosity.  Astronomers use that relation, which was discovered in the early 1900s by Henrietta Leavitt, to establish distances to galaxies.  In the above figure the horizontal axis features the pulsation period, and the vertical axis a proxy  for luminosity (image credit: Fig 2 in Riess et al., 2013 arXiv/ApJ).
A relation exists between a Cepheid’s periodic brightness variations and its mean luminosity. Astronomers use that trend, which was discovered in the early 1900s by Henrietta Leavitt, to establish distances to galaxies hosting Cepheids. In the above figure the horizontal axis features the pulsation period, and the vertical axis defines a proxy for luminosity (image credit: Fig 2 from Riess et al., arXiv/ApJ).

The distances to M33 shown below convey seminal points in the evolution of humanity’s knowledge.  The scatter near the 1920s stems partly from a debate concerning whether the Milky Way and the Universe are synonymous.  In other words, do galaxies exist beyond the Milky Way?  The topic is immortalized in the famed great debate (1920) featuring H. Shapley and H. Curtis (the latter argued for an extragalactic scale).  The offset between the pre-1930 and post-1980 data result in part from a nearly two-fold increase in the cosmic distance scale recognized circa 1950 (see also Feast 2000).   Also evident is the scatter associated with the post-1980 distances, which merely reinforces the importance of the new high-precision distance estimates.

Riess et al. obtained data for some 70 Cepheids and determined a distance for M31 of ~2,450,000 lightyears.  The latter is corroborated by a new study by Contreras Ramos et al. 2013 (d~2,540,000 ly), whose distance estimate relied on data for stars in a M31 globular cluster.

A subset of the distances estimated for M33, as compiled from estimates featured in the NASA/IPAC Extragalactic Database (Steer & Madore). On the vertical axis is the distance to the galaxy in units of lightyears, and  the year is cited on the horizontal axis.  The red arrow and black datum indicate the new near-infrared based distance from Gieren et al. 2013 (image credit: DM).
A subset of the distances deduced for M33, as compiled from estimates featured in the NASA/IPAC Extragalactic Database (Steer & Madore). On the vertical axis is the distance to the galaxy in units of lightyears, and the year is cited on the horizontal axis.  The red arrow and black datum indicate the new near-infrared based distance from Gieren et al. (image credit: DM).

Top-class instruments and telescopes are needed to obtain reliable measurements of stars in galaxies nearly 3,000,000 million lightyears away.  Gieren et al. utilized the 8.2-m Very Large Telescope (Yepun) instrument shown below, while Riess and Contreras Ramos et al. analyzed observations from the Hubble Space Telescope.  Riess et al. acquired images of M31 via the new Wide-field Camera 3, which replaced the Wide-field and Planetary Camera 2 (“The Camera That Saved Hubble“) during the famed 2009 servicing mission.

The new results mark the culmination of a century’s worth of effort aimed at securing precise distances for our Galaxy’s local spiral kin (M31 and M33).  However, the offset between the Planck and certain Cepheid/SN-based determinations of the Hubble constant demands that research continue in order to identify uncertainties associated with the methods.

Gieren et al. used the 8.2-m Very Large Telescope (Yepun) to image M33, and deduce the distance to that galaxy (image credit: ESO).
Gieren et al. used the 8.2-m Very Large Telescope (Yepun) to image stars in M33, and deduce the distance to that galaxy (image credit: G. Hüdepohl/ESO).

The Gieren et al. findings have been accepted for publication in the Astrophysical Journal (ApJ), and a preprint is available on arXiv.   Both the Riess and Contreras Ramos et al. studies are likewise published in ApJ.  The interested reader desiring additional information on the cosmic distance scale and Cepheids will find the following resources pertinent: the AAVSO’s article on Delta Cephei (the namesake for the class of Cepheid variables), Freedman & Madore (2010)Tammann & Reindl 2012, Fernie 1969, the NASA/IPAC Extragalactic Database, G. Johnson’s Miss Leavitt’s Stars: The Untold Story of the Woman Who Discovered How to Measure the Universe, D. Fernie’s Setting Sail for the Universe: Astronomers and their Discoveries, Nick Allen’s The Cepheid Distance Scale: A History, D. Turner’s Classical Cepheids After 228 Years of Study, J. Percy’s Understanding Variable Stars.

Ancient Galaxy ‘Bursting’ with Stars

The galaxy HFLS3 appears as a small red dot in these Herschel submillimeter images (main image, and panels on right). Subsequent observations with ground-based telescopes, ranging from optical to millimeter wavelengths (insets), revealed two galaxies appearing very close together. The two are actually at very different distances, however, and HFLS3 (blue, in millimeter wavelengths) is so far away that we are seeing it as it was when the universe was just 880 million years old. Credit: ESA/Herschel/HerMES/IRAM/GTC/W.M. Keck Observatory.

Most of the early galaxies that astronomers have been able to observe are small with a low-to-moderate amount of star production. But now the Herschel Space Observatory has found a massive dust-filled galaxy churning out stars at an incredible rate, with all of this taking place back when the cosmos was a just 880 million years old. The galaxy is about as massive as our Milky Way, but produces stars at a rate 2,000 times greater, prompting the researchers to call it a “maximum-starburst” galaxy.

The astronomers involved in its discovery say its mere existence challenges our theories of galaxy evolution.

“Massive, intense starburst galaxies are expected to only appear at later cosmic times,” says Dominik Riechers, currently an assistant professor at Cornell. “Yet, we have discovered this colossal starburst just 880 million years after the Big Bang, when the universe was at little more than 6 percent of its current age. Riechers is the first author of the paper describing the findings in the April 18 issue of the journal Nature.

The prevailing thought on early galaxy and star formation has been that the first galaxies to form were relatively small and lightweight, containing only a few billion times the mass of our Sun. They form their first stars at rates of a few times that experienced by the Milky Way today, and the galaxies would grow by merging with other small galaxies. In theory, galaxies as massive as the newly found galaxy – named HFLS3 — should not be present so soon after the Big Bang.

HFLS3 appears as little more than a faint, red smudge in images from the Herschel Multi-tiered Extragalactic Survey (HerMES).
The extreme distance to HFLS3 means that its light has travelled for almost 13 billion years across space before reaching us. We therefore see it as it existed in the infant Universe, just 880 million years after the Big Bang or at 6.5% of the Universe’s current age.

This artist's impression shows the "starburst" galaxy HFLS3. The galaxy appears as little more than a faint, red smudge in images from the Herschel space observatory. Image credit: ESA-C. Carreau.
This artist’s impression shows the “starburst” galaxy HFLS3. The galaxy appears as little more than a faint, red smudge in images from the Herschel space observatory. Image credit: ESA-C. Carreau.

Even at that young age, HFLS3 was already close to the mass of the Milky Way, with roughly 140 billion times the mass of the Sun in the form of stars and star-forming material. After another 13 billion years, it should have grown to be as big as the most massive galaxies known in the local Universe.

“Looking for the first examples of these massive star factories is like searching for a needle in a haystack; the Herschel dataset is extremely rich,” said Riechers.

Tens of thousands of massive, star-forming galaxies have been detected by Herschel as part of HerMES and sifting through them to find the most interesting ones is a challenge.

“This particular galaxy got our attention because it was bright, and yet very red compared to others like it,” said co-investigator Dave Clements of Imperial College London.

While the discovery of this single galaxy isn’t enough to overturn current theories of galaxy formation, finding more galaxies like this one could challenge those theories, the astronomers say. At the very least, theories will have to be modified to explain how this galaxy formed, Riechers says.

“This galaxy is just one spectacular example, but it’s telling us that extremely vigorous star formation was possible early in the universe,” says Jamie Bock, professor of physics at Caltech and a coauthor of the paper.

Read the team’s paper: A Dust-Obscured Massive Maximum-Starburst Galaxy at a Redshift of 6.34

Sources: ESA, JPL, Caltech

How Big Are Galaxies?

Galaxy size comparison chart by astrophysicist Rhys Taylor

I’m going to refrain from the initial response that comes to mind… actually, no I won’t — they’re really, really, really big!!!!

</Kermit arms>

Ok, now that that’s out of the way check out this graphic by Arecibo astrophysicist Rhys Taylor, which neatly illustrates the relative sizes of 25 selected galaxies using images made from NASA and ESA observation missions… including a rendering of our own surprisingly mundane Milky Way at the center for comparison. (Warning: this chart may adversely affect any feelings of bigness you may have once held dear.) According to Taylor on his personal blog, Physicists of the Caribbean (because he works had worked at the Arecibo Observatory in Puerto Rico) “Type in ‘asteroid sizes’ into Google and you’ll quickly find a bunch of  images comparing various asteroids, putting them all next to each at the same scale. The same goes for planets and stars. Yet the results for galaxies are useless. Not only do you not get any size comparisons, but scroll down even just a page and you get images of smartphones, for crying out loud.” So to remedy that marked dearth of galactic comparisons, Taylor made his own. Which, if you share my personal aesthetics, you’ll agree is quite nicely done.

“I tried to get a nice selection of well-known, interesting objects,” Taylor explains. “I was also a little limited in that I needed high-resolution images which completely mapped the full extent of each object… still, I think the final selection has a decent mix, and I reckon it was a productive use of a Saturday.” And even with the dramatic comparisons above, Taylor wasn’t able to accurately portray to scale one of the biggest — if not the biggest — galaxies in the observable universe: IC 1101.

For an idea of how we measure up to that behemoth, he made this graphic:

Galaxy sizes including IC 1101, the largest-known galaxy. Click for a zoomable version. (Credit: Rhys Taylor)

That big bright blur in the center? That’s IC 1101, the largest known galaxy — in this instance created by scaling up an image of M87, another supersized elliptical galaxy that just happens to be considerably closer to our own (and thus has had clearer images taken of it.) But the size is right — IC 1101 is gargantuan.

At an estimated 5.5 million light-years wide, over 50 Milky Ways could fit across it! And considering it takes our Solar System about 225 million years to complete a single revolution around the Milky Way… well… yeah. Galaxies are big. Really, really, reallyreally big!

</Kermit arms>

Now if you’ll pardon me, I need to go stop my head from spinning… Read this and more on Rhys Taylor’s blog here, and add Rhys to your awesome astronomy Google+ circles here. And you can find out more about IC 1101 in the video below from Tony Darnell, aka DeepAstronomy:

Behold: The Largest Known Spiral Galaxy

his composite of the giant barred spiral galaxy NGC 6872 combines visible light images from the European Southern Observatory's Very Large Telescope with far-ultraviolet (1,528 angstroms) data from NASA's GALEX and 3.6-micron infrared data acquired by NASA's Spitzer Space Telescope. Credit: NASA's Goddard Space Flight Center/ESO/JPL-Caltech/DSS

Astronomers have long known that a spectacular barred spiral galaxy named NGC 6872 is a behemoth, but by compiling data from several space- and ground-based observatories and running a few computer simulations, they have now determined this is the largest spiral galaxy we know of.

Measuring tip-to-tip across its two outsized spiral arms, NGC 6872 spans more than 522,000 light-years, making it more than five times the size of our Milky Way galaxy.

“Without GALEX’s ability to detect the ultraviolet light of the youngest, hottest stars, we would never have recognized the full extent of this intriguing system,” said lead scientist Rafael Eufrasio, from the Goddard Space Flight Center the Catholic University of America in Washington. He presented the findings Thursday at the American Astronomical Society meeting in Long Beach, California.

But this galaxy didn’t get so gargantuan all on its own. Astronomers think large galaxies, including our own, grew through mergers and acquisitions — assembling over billions of years by absorbing numerous smaller systems.

The galaxy’s unusual size and appearance stem from its interaction with a much smaller disk galaxy named IC 4970, which has only about one-fifth the mass of NGC 6872. The odd couple is located 212 million light-years from Earth in the southern constellation Pavo.
Intriguingly, the gravitational interaction of NGC 6872 and IC 4970 may have done the opposite, spawning what may develop into a new small galaxy.

“The northeastern arm of NGC 6872 is the most disturbed and is rippling with star formation, but at its far end, visible only in the ultraviolet, is an object that appears to be a tidal dwarf galaxy similar to those seen in other interacting systems,” said team member Duilia de Mello, a professor of astronomy at Catholic University.

The researchers used archived data from the Galaxy Evolution Explorer (GALEX) mission, and studied the galaxy across the spectrum using data from the European Southern Observatory’s Very Large Telescope, the Two Micron All Sky Survey, and NASA’s Spitzer Space Telescope.

Read the team’s paper

Source: NASA