Dark Energy Illuminated By Largest Galactic Map Ten Years In The Making

A section of the 3D map constructed by BOSS. The rectangle on the far left shows a cutout of 1000 sq. degrees in the sky containing nearly 120,000 galaxies, or roughly 10% of the total survey. Credit: Jeremy Tinker/SDSS-III

In 1929, Edwin Hubble forever changed our understanding of the cosmos by showing that the Universe is in a state of expansion. By the 1990s, astronomers determined that the rate at which it is expanding is actually speeding up, which in turn led to the theory of “Dark Energy“. Since that time, astronomers and physicists have sought to determine the existence of this force by measuring the influence it has on the cosmos.

The latest in these efforts comes from the Sloan Digital Sky Survey III (SDSS III), where an international team of researchers have announced that they have finished creating the most precise measurements of the Universe to date. Known as the Baryon Oscillation Spectroscopic Survey (BOSS), their measurements have placed new constraints on the properties of Dark Energy.

The new measurements were presented by Harvard University astronomer Daniel Eisenstein at a recent meeting of the American Astronomical Society. As the director of the Sloan Digital Sky Survey III (SDSS-III), he and his team have spent the past ten years measuring the cosmos and the periodic fluctuations in the density of normal matter to see how galaxies are distributed throughout the Universe.

An illustration of the concept of baryon acoustic oscillations, which are imprinted in the early universe and can still be seen today in galaxy surveys like BOSS (Illustration courtesy of Chris Blake and Sam Moorfield).
An illustration of baryon acoustic oscillations, which are imprinted in the early universe and can still be seen today in galaxy surveys like BOSS. Credit: Chris Blake and Sam Moorfield

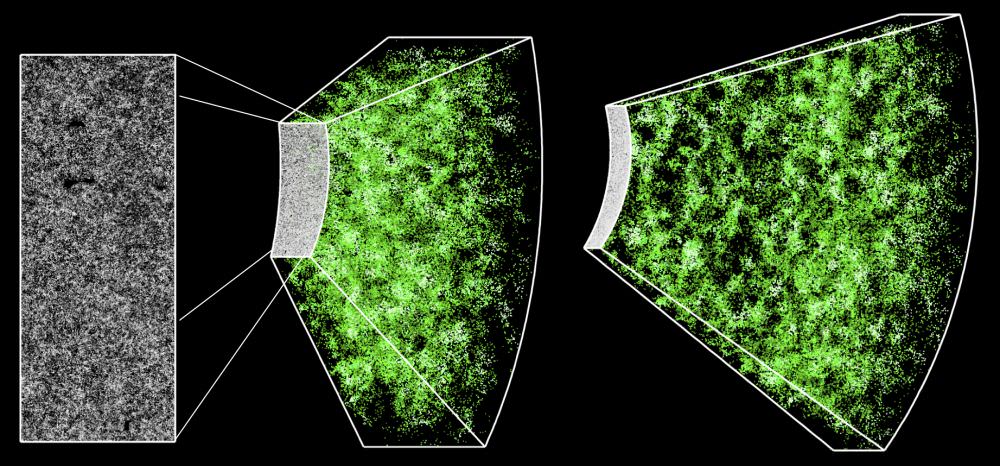
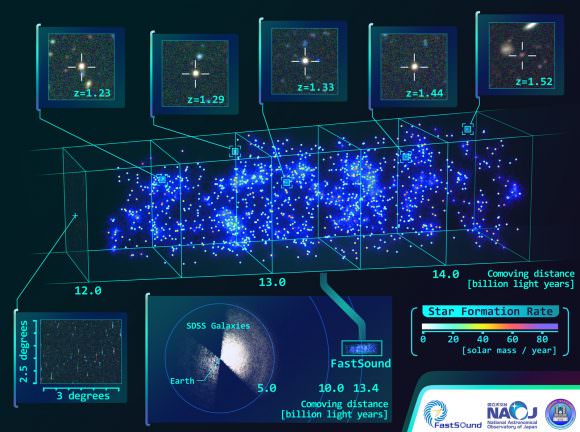
And after a decade of research, the BOSS team was able to produce a three-dimensional map of the cosmos that covers more than six billion light-years. And while other recent surveys have looked further afield – up to distances of 9 and 13 billion light years – the BOSS map is unique in that it boasts the highest accuracy of any cosmological map.

In fact, the BOSS team was able to measure the distribution of galaxies in the cosmos, and at a distance of 6 billion light-years, to within an unprecedented 1% margin of error. Determining the nature of cosmic objects at great distances is no easy matter, due the effects of relativity. As Dr. Eisenstein told Universe Today via email:

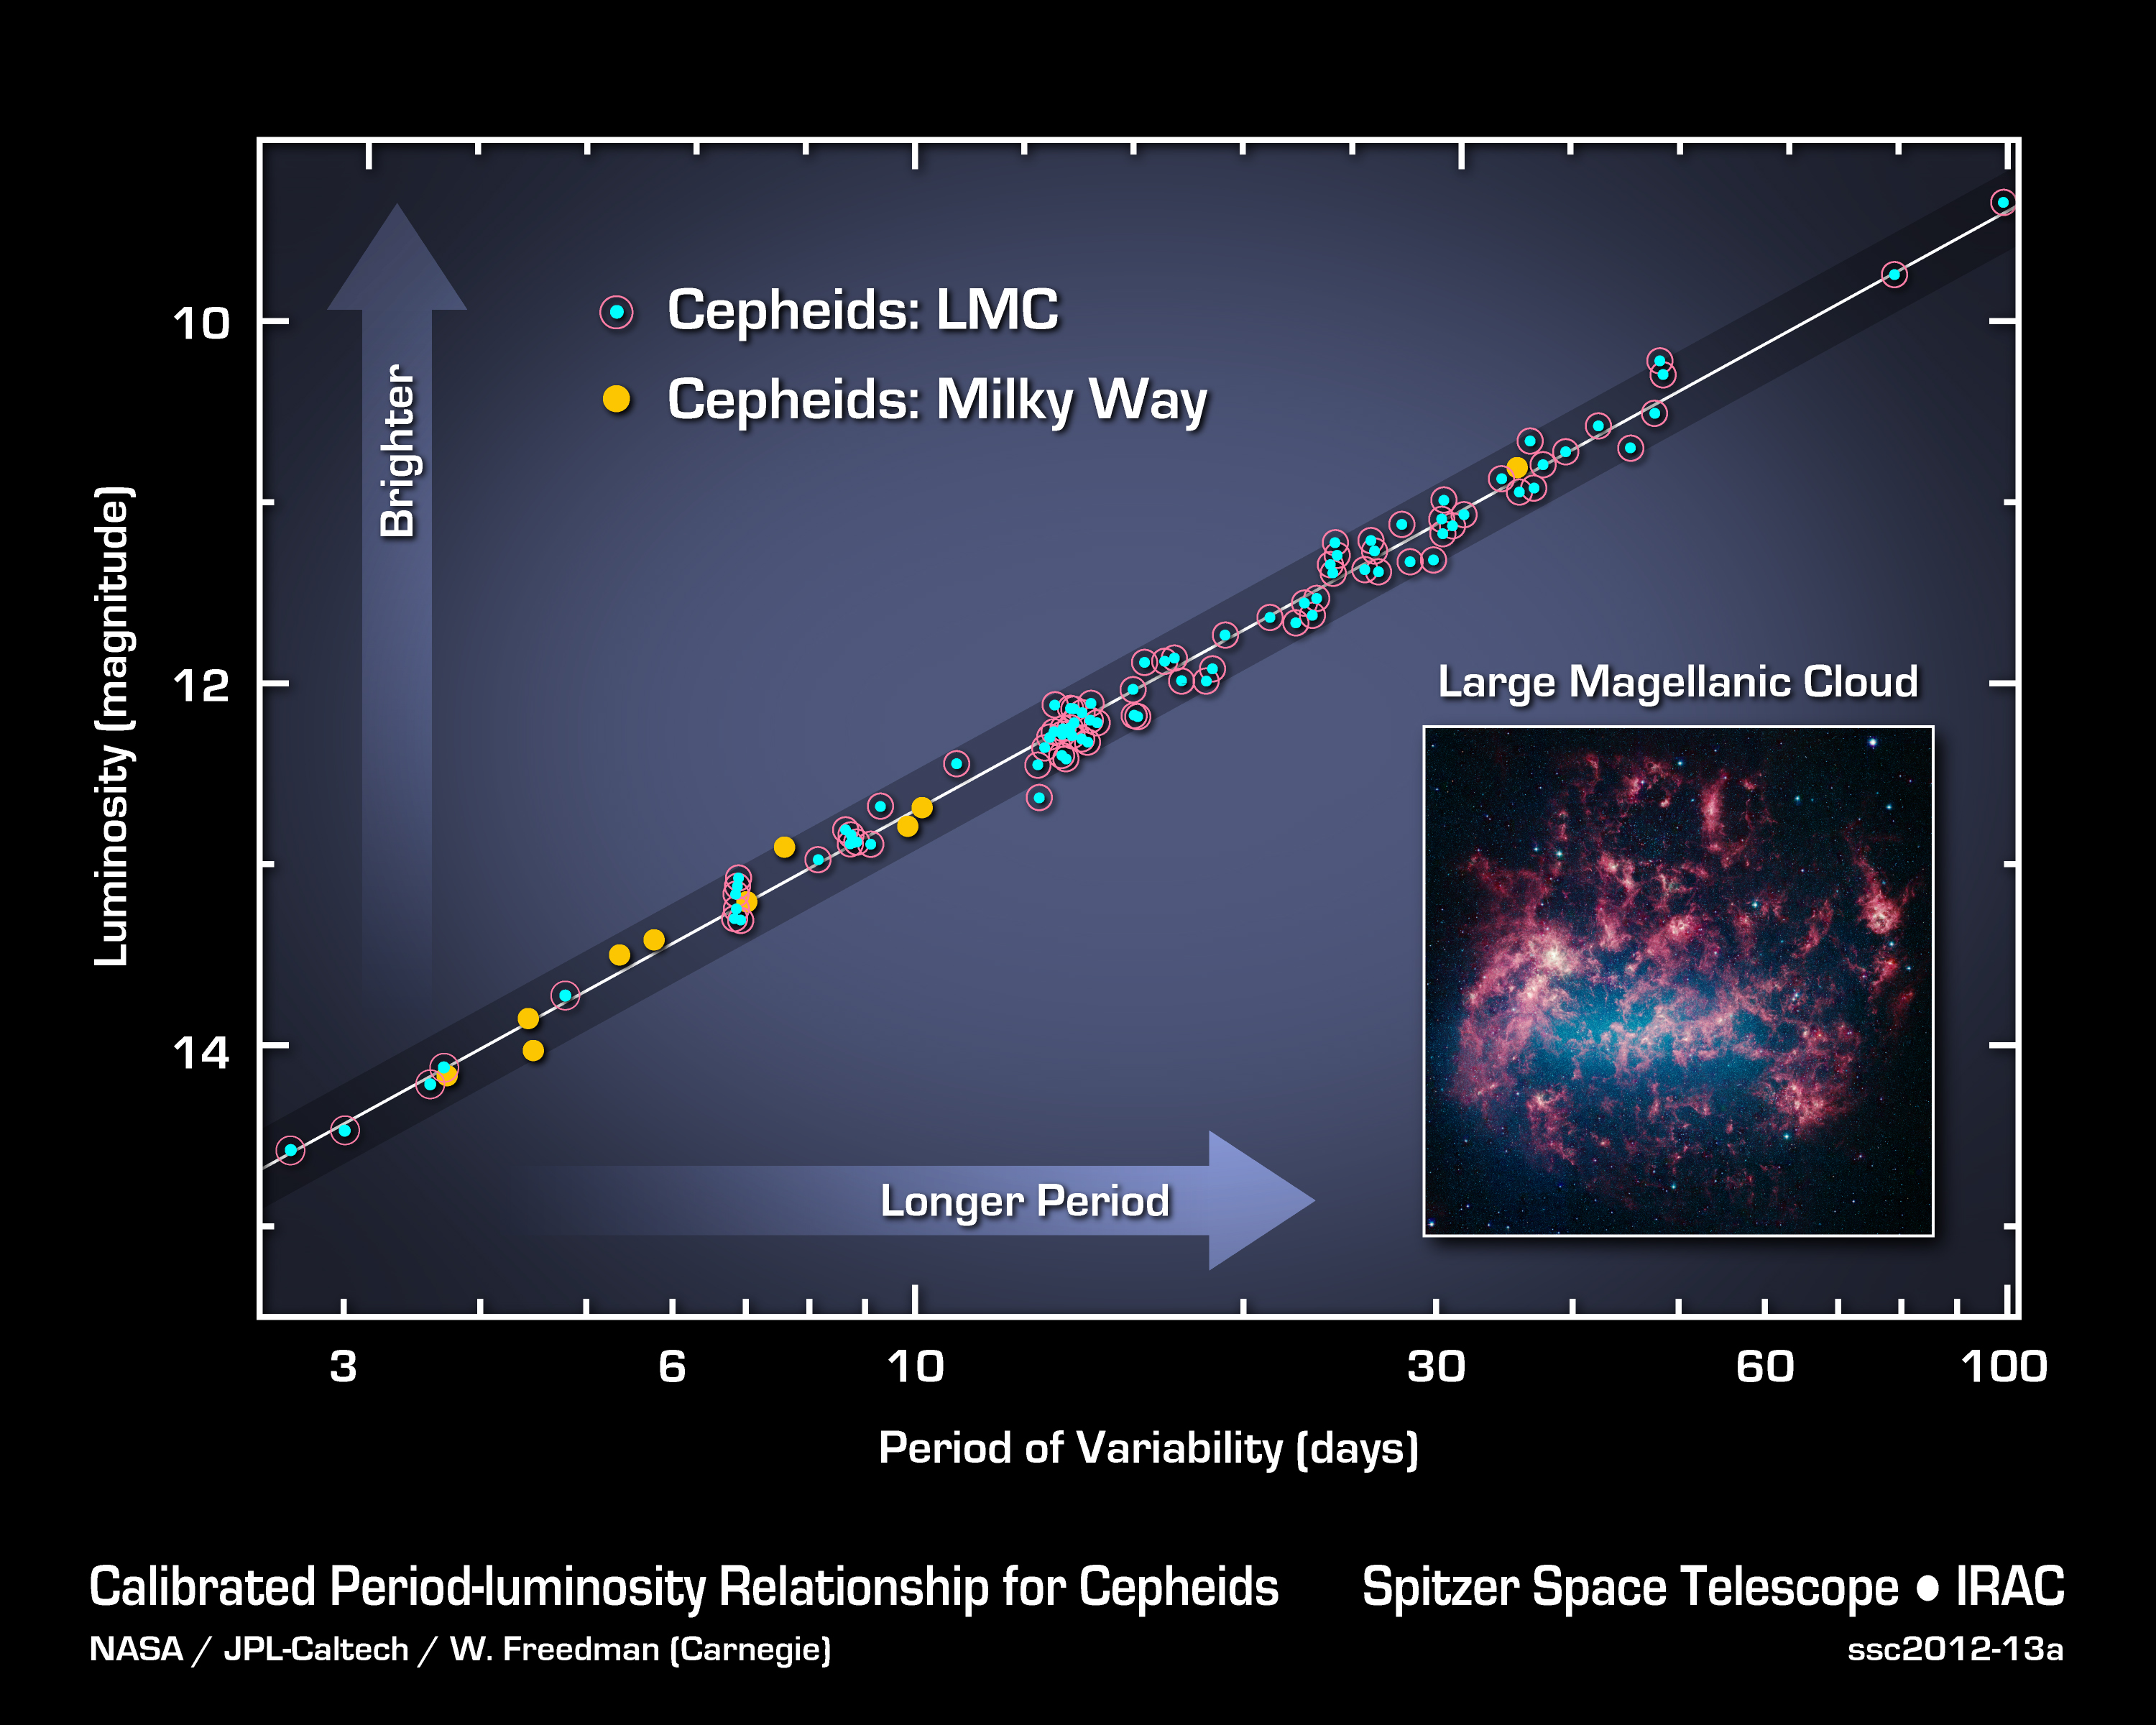
“Distances are a long-standing challenge in astronomy. Whereas humans often can judge distance because of our binocular vision, galaxies beyond the Milky Way are much too far away to use that. And because galaxies come in a wide range of intrinsic sizes, it is hard to judge their distance. It’s like looking at a far-away mountain; one’s judgement of its distance is tied up with one’s judgement of its height.”

In the past, astronomers have made accurate measurements of objects within the local universe (i.e. planets, neighboring stars, star clusters) by relying on everything from radar to redshift – the degree to which the wavelength of light is shifted towards the red end of the spectrum. However, the greater the distance of an object, the greater the degree of uncertainty.

 An artist's concept of the latest, highly accurate measurement of the Universe from BOSS. The spheres show the current size of the "baryon acoustic oscillations" (BAOs) from the early universe, which have helped to set the distribution of galaxies that we see in the universe today. Galaxies have a slight tendency to align along the edges of the spheres — the alignment has been greatly exaggerated in this illustration. BAOs can be used as a "standard ruler" (white line) to measure the distances to all the galaxies in the universe. Credit: Zosia Rostomian, Lawrence Berkeley National Laboratory
An artist’s concept of the latest, highly accurate measurement of the Universe from BOSS. Credit: Zosia Rostomian/Lawrence Berkeley National Laboratory

And until now, only objects that are a few thousand light-years from Earth – i.e. within the Milky Way galaxy – have had their distances measured to within a one-percent margin of error. As the largest of the four projects that make up the Sloan Digital Sky Survey III (SDSS-III), what sets BOSS apart is the fact that it relies primarily on the measurement of what are called “baryon acoustic oscillations” (BAOs).

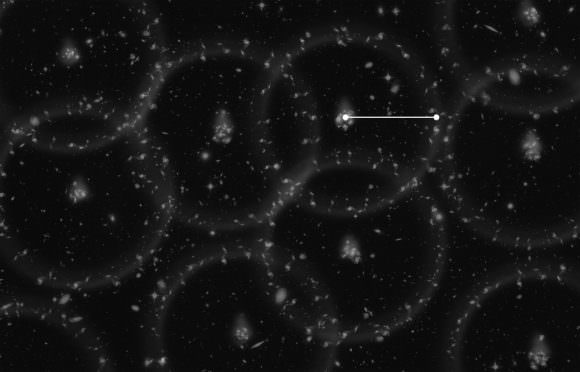
These are essentially subtle periodic ripples in the distribution of visible baryonic (i.e. normal) matter in the cosmos. As Dr. Daniel Eisenstein explained:

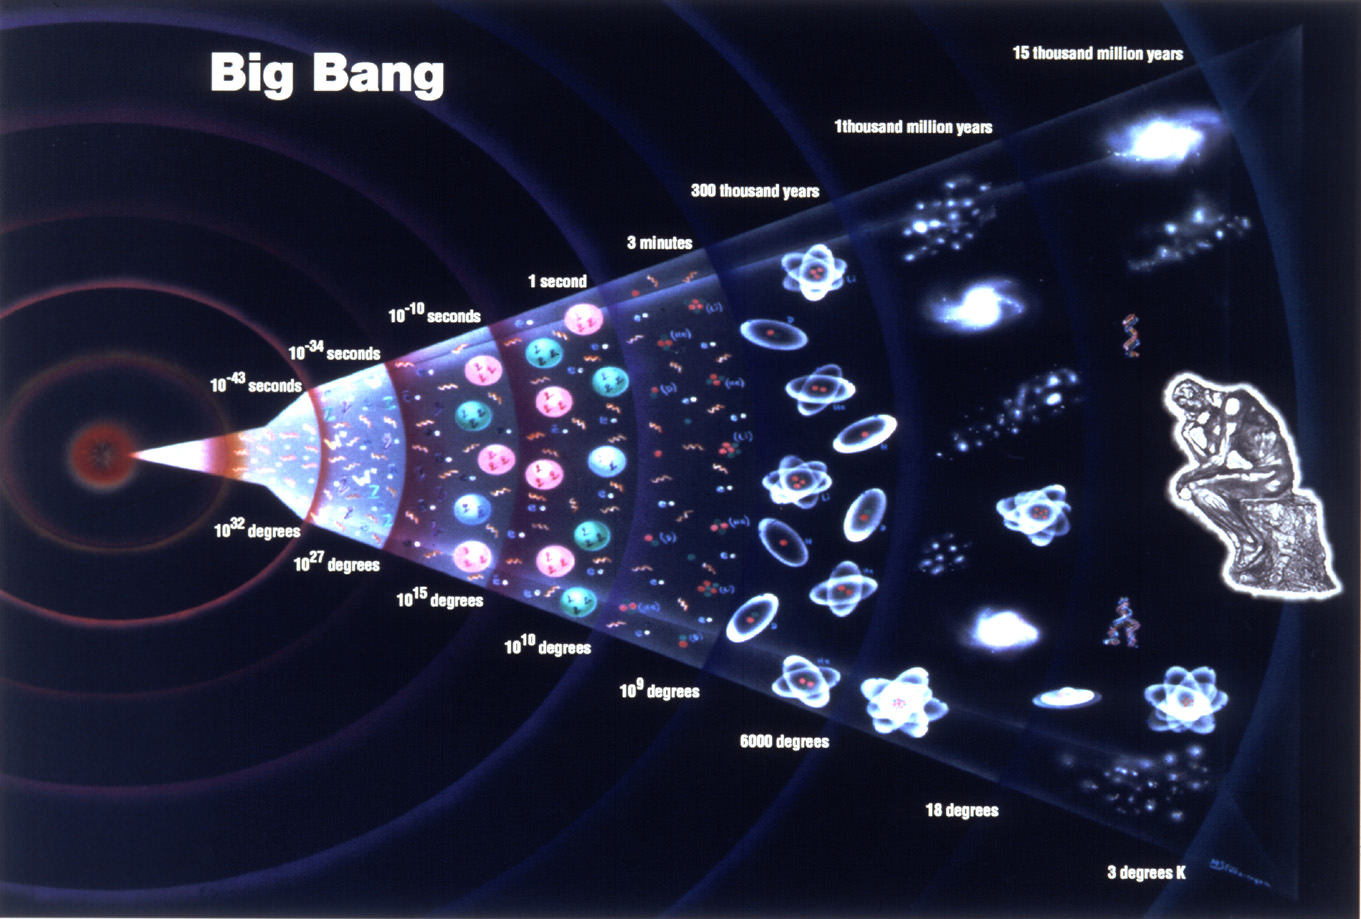
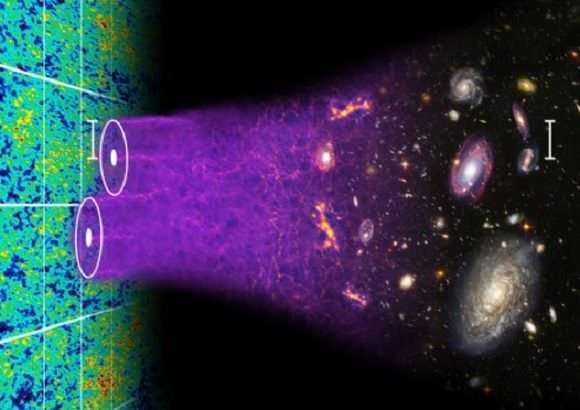
“BOSS measures the expansion of the Universe in two primary ways. The first is by using the baryon acoustic oscillations (hence the name of the survey). Sound waves traveling in the first 400,000 years after the Big Bang create a preferred scale for separations of pairs of galaxies. By measuring this preferred separation in a sample of many galaxies, we can infer the distance to the sample. 

“The second method is to measure how clustering of galaxies differs between pairs oriented along the line of sight compared to transverse to the line of sight. The expansion of the Universe can cause this clustering to be asymmetric if one uses the wrong expansion history when converting redshifts to distance.”

With these new, highly-accurate distance measurements, BOSS astronomers will be able to study the influence of Dark Matter with far greater precision. “Different dark energy models vary in how the acceleration of the expansion of the Universe proceeds over time,” said Eisenstein. “BOSS is measuring the expansion history, which allows us to infer the acceleration rate. We find results that are highly consistent with the predictions of the cosmological constant model, that is, the model in which dark energy has a constant density over time.”

An international team of researchers have produced the largest 3-D map of the universe to date, which validates Einstein's theory of General Relativity. Credit: NAOJ/CFHT/ SDSS
Discerning the large-scale structure of the universe, and the role played by Dark Energy, is key to unlocking its mysteries. Credit: NAOJ/CFHT/ SDSS

In addition to measuring the distribution of normal matter to determine the influence of Dark Energy, the SDSS-III Collaboration is working to map the Milky Way and search for extrasolar planets. The BOSS measurements are detailed in a series of articles that were submitted to journals by the BOSS collaboration last month, all of which are now available online.

And BOSS is not the only effort to understand the large-scale structure of our Universe, and how all its mysterious forces have shaped it. Just last month, Professor Stephen Hawking announced that the COSMOS supercomputing center at Cambridge University would be creating the most detailed 3D map of the Universe to date.

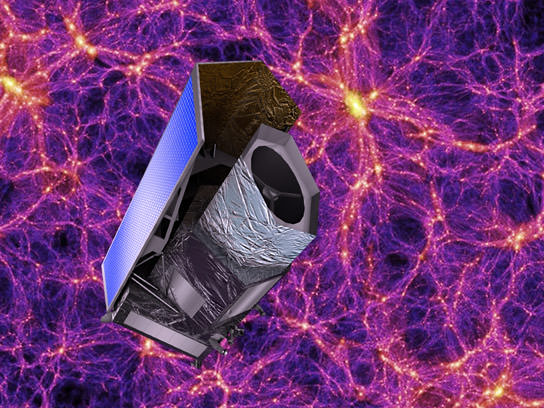
Relying on data obtained by the CMB data obtained by the ESA’s Planck satellite and information from the Dark Energy Survey, they also hope to measure the influence Dark Energy has had on the distribution of matter in our Universe. Who knows? In a few years time, we may very well come to understand how all the fundamental forces governing the Universe work together.

Further Reading: SDSIII

Professor Stephen Hawking Intends To Map The Known Universe

In honor of Dr. Stephen Hawking, the COSMOS center will be creating the most detailed 3D mapping effort of the Universe to date. Credit: BBC, Illus.: T.Reyes

Back in 1997, a team of leading scientists and cosmologists came together to establish the COSMOS supercomputing center at Cambridge University. Under the auspices of famed physicist Stephen Hawking, this facility and its supercomputer are dedicated to the research of cosmology, astrophysics and particle physics – ultimately, for the purpose of unlocking the deeper mysteries of the Universe.

Yesterday, in what was themed as a “tribute to Stephen Hawking”, the COSMOS center announced that it will be embarking on what is perhaps the boldest experiment in cosmological mapping. Essentially, they intend to create the most detailed 3D map of the early universe to date, plotting the position of billions of cosmic structures including supernovas, black holes, and galaxies.

This map will be created using the facility’s supercomputer, located in Cambridge’s Department of Applied Mathematics and Theoretical Physics. Currently, it is the largest shared-memory computer in Europe, boasting 1,856 Intel Xeon E5 processor cores, 31 Intel Many Integrated Core (MIC) co-processors, and 14.5 terabytes of globally shared memory.

The COSMOS IX supercomputer. Credit: cosmos.damtp.cam.ac.uk

The 3D will also rely on data obtained by two previous surveys – the ESA’s Planck satellite and the Dark Energy Survey. From the former, the COSMOS team will use the detailed images of the Cosmic Microwave Background (CMB) – the radiation leftover by the Big Ban – that were released in 2013. These images of the oldest light in the cosmos allowed physicists to refine their estimates for the age of the Universe (13.82 billion years) and its rate of expansion.

This information will be combined with data from the Dark Energy Survey which shows the expansion of the Universe over the course of the last 10 billion years. From all of this, the COSMOS team will compare the early distribution of matter in the Universe with its subsequent expansion to see how the two link up.

While cosmological simulations that looked at the evolution and large-scale structure of the Universe have been performed in the past – such as the Evolution and Assembly of GaLaxies and their Environments (EAGLE) project and the survey performed by the Institute for the Physics and Mathematics of the Universe at Tokyo University – this will be the first time where scientists compare data the early Universe to its evolution since.

The project is also expected to receive a boost from the deployment of the ESA’s Euclid probe, which is scheduled for launch in 2020. This mission will measure the shapes and redshifts of galaxies (looking 10 billion years into the past), thereby helping scientists to understand the geometry of the “dark Universe” – i.e. how dark matter and dark energy influence it as a whole.

Artist impression of the Euclid probe, which is set to launch in 2020. Credit: ESA

The plans for the COSMOS center’s 3D map are will be unveiled at the Starmus science conference, which will be taking place from July 2nd to 27th, 2016, in Tenerife – the largest of the Canary Islands, located off the coast of Spain. At this conference, Hawking will be discussing the details of the COSMOS project.

In addition to being the man who brought the COSMOS team together, the theme of the project – “Beyond the Horizon – Tribute to Stephen Hawking” – was selected because of Hawking’s long-standing commitment to physics and cosmology. “Hawking is a great theorist but he always wants to test his theories against observations,” said Prof. Shellard in a Cambridge press release. “What will emerge is a 3D map of the universe with the positions of billions of galaxies.”

Hawking will also present the first ever Stephen Hawking Medal for Science Communication, an award established by Hawking that will be bestowed on those who help promote science to the public through media – i.e. cinema, music, writing and art. Other speakers who will attending the event include Neil deGrasse Tyson, Chris Hadfield, Martin Rees, Adam Riess, Rusty Schweickart, Eric Betzig, Neil Turok, and Kip Thorne.

Professor Hawking, flanked by , announcing the launch of the Stephen Hawking Medal for Science Communication, Dec. 16th, 2015. Credit:
Professor Hawking and colleagues from the Royal Society announcing the launch of the Stephen Hawking Medal for Science Communication, Dec. 16th, 2015. Credit: starmus.com

Naturally, it is hoped that the creation of this 3D map will confirm current cosmological theories, which include the current age of the Universe and whether or not the Standard Model of cosmology – aka. the Lambda Cold Dark Matter (CDM) model – is in fact the correct one. As Hawking is surely hoping, this could bring us one step closer to a Theory of Everything!

Further Reading: Cambridge News

Next Time You’re Late To Work, Blame Dark Energy!

Illustration of the Big Bang Theory
The Big Bang Theory: A history of the Universe starting from a singularity and expanding ever since. Credit: grandunificationtheory.com

Ever since Lemaitre and Hubble’s first proposed it in the 1920s, scientists and astronomers have been aware that the Universe is expanding. And from these observations, cosmological theories like the Big Bang Theory and the “Arrow of Time” emerged. Whereas the former addresses the origins and evolution of our Universe, the latter argues that the flow of time in one-direction and is linked to the expansion of space.

For many years, scientists have been trying to ascertain why this is. Why does time flow forwards, but not backwards? According to new study produced by a research team from the Yerevan Institute of Physics and Yerevan State University in Armenia, the influence of dark energy may be the reason for the forward-flow of time, which may make one-directional time a permanent feature of our universe.

Today, theories like the Arrow of Time and the expansion of the universe are considered fundamental facts about the Universe. Between measuring time with atomic clocks, observing the red shift of galaxies, and created detailed 3D maps that show the evolution of our Universe over the course of billions of years, one can see how time and the expansion of space are joined at the hip.

Artist's impression of the influence gravity has on space time. Credit: space.com
Artist’s impression of the influence gravity has on space time. Credit: space.com

The question of why this is the case though is one that has continued to frustrate physicists. Certain fundamental forces, like gravity, are not governed by time. In fact, one could argue without difficulty that Newton’s Laws of Motion and quantum mechanics work the same forwards or backwards. But when it comes to things on the grand scale like the behavior of planets, stars, and entire galaxies, everything seems to come down to the Second Law of Thermodynamics.

This law, which states that the total chaos (aka. entropy) of an isolated system always increases over time, the direction in which time moves is crucial and non-negotiable, has come to be accepted as the basis for the Arrow of Time. In the past, some have ventured that if the Universe began to contract, time itself would begin to flow backwards. However, since the 1990s and the observation that the Universe has been expanding at an accelerating rate, scientists have come to doubt that this.

If, in fact, the Universe is being driven to greater rates of expansion – the predominant explanation is that “Dark Energy” is what is driving it – then the flow of time will never cease being one way. Taking this logic a step further, two Armenian researchers – Armen E. Allahverdyan of the Center for Cosmology and Astrophysics at the Yerevan Institute of Physics and Vahagn G. Gurzadyan of Yerevan State University – argue that dark energy is the reason why time always moves forward.

In their paper, titled “Time Arrow is Influenced by the Dark Energy“, they argue that dark energy accelerating the expansion of the universe supports the asymmetrical nature of time. Often referred to as the “cosmological constant” – referring to Einstein’s original theory about a force which held back gravity to achieve a static universe – dark energy is now seen as a “positive” constant, pushing the Universe forward, rather than holding it back.

Diagram showing the Lambda-CBR universe, from the Big Bang to the the current era. Credit: Alex Mittelmann/Coldcreation

To test their theory, Allahverdyan and Gurzadyan used a large scale scenario involving gravity and mass – a planet with increasing mass orbiting a star. What they found was that if dark energy had a value of 0 (which is what physicists thought before the 1990s), or if gravity were responsible for pulling space together, the planet would simply orbit the star without any indication as to whether it was moving forwards or backwards in time.

But assuming that the value of dark energy is a positive (as all the evidence we’ve seen suggests) then the planet would eventually be thrown clear of the star. Running this scenario forward, the planet is expelled because of its increasing mass; whereas when it is run backwards, the planet closes in on the star and is captured by it’s gravity.

In other words, the presence of dark energy in this scenario was the difference between having an “arrow of time” and not having one. Without dark energy, there is no time, and hence no way to tell the difference between past, present and future, or whether things are running in a forward direction or backwards.

But of course, Allahverdyan and Gurzadyan were also sure to note in their study that this is a limited test and doesn’t answer all of the burning questions. “We also note that the mechanism cannot (and should not) explain all occurrences of the thermodynamic arrow,” they said. “However, note that even when the dark energy (cosmological constant) does not dominate the mean density (early universe or today’s laboratory scale), it still exists.”

Limited or not, this research is representative of some exciting new steps that astrophysicists have been taking of late. This involves not only questioning the origins of dark energy and the expansion force it creates, but also questioning its implication in basic physics. In so doing, researchers may finally be able to answer the age-old question about why time exists, and whether or not it can be manipulated (i.e. time travel!)

Further Reading: Physical Review E

Japanese 3D Galaxy Map Confirms Einstein Was One Smart Dude

An international team of researchers have produced the largest 3-D map of the universe to date, which validates Einstein's theory of General Relativity. Credit: NAOJ/CFHT/ SDSS

On June 30th, 1905, Albert Einstein started a revolution with the publication of theory of Special Relativity. This theory, among other things, stated that the speed of light in a vacuum is the same for all observers, regardless of the source. In 1915, he followed this up with the publication of his theory of General Relativity, which asserted that gravity has a warping effect on space-time. For over a century, these theories have been an essential tool in astrophysics, explaining the behavior of the Universe on the large scale.

However, since the 1990s, astronomers have been aware of the fact that the Universe is expanding at an accelerated rate. In an effort to explain the mechanics behind this, suggestions have ranged from the possible existence of an invisible energy (i.e. Dark Energy) to the possibility that Einstein’s field equations of General Relativity could be breaking down. But thanks to the recent work of an international research team, it is now known that Einstein had it right all along.

Continue reading “Japanese 3D Galaxy Map Confirms Einstein Was One Smart Dude”

Spitzer Provides Most Precise Measurement Yet of the Universe’s Expansion

Calibrated Period-luminosity Relationship for Cepheids

This graph illustrates the Cepheid period-luminosity relationship, which scientists use to calculate the size, age and expansion rate of the Universe. Credit: NASA/JPL-Caltech/Carnegie

How fast is our Universe expanding? Over the decades, there have been different estimates used and heated debates over those approximations, but now data from the Spitzer Space Telescope have provided the most precise measurement yet of the Hubble constant, or the rate at which our universe is stretching apart. The result? The Universe is getting bigger a little bit faster than previously thought.

The newly refined value for the Hubble constant is 74.3 plus or minus 2.1 kilometers per second per megaparsec.

The most previous estimation came from a study from the Hubble Space Telescope, at 74.2 plus or minus 3.6 kilometers per second per megaparsec. A megaparsec is roughly 3 million light-years.

To make the new measurements, Spitzer scientists looked at pulsating stars called cephied variable stars, taking advantage of being able to observe them in long-wavelength infrared light. In addition, the findings were combined with previously published data from NASA’s Wilkinson Microwave Anisotropy Probe (WMAP) on dark energy. The new determination brings the uncertainty down to 3 percent, a giant leap in accuracy for cosmological measurements, scientists say.

WMAP obtained an independent measurement of dark energy, which is thought to be winning a battle against gravity, pulling the fabric of the universe apart. Research based on this acceleration garnered researchers the 2011 Nobel Prize in physics.

The Hubble constant is named after the astronomer Edwin P. Hubble, who astonished the world in the 1920s by confirming our universe has been expanding since it exploded into being 13.7 billion years ago. In the late 1990s, astronomers discovered the expansion is accelerating, or speeding up over time. Determining the expansion rate is critical for understanding the age and size of the universe.

“This is a huge puzzle,” said the lead author of the new study, Wendy Freedman of the Observatories of the Carnegie Institution for Science in Pasadena. “It’s exciting that we were able to use Spitzer to tackle fundamental problems in cosmology: the precise rate at which the universe is expanding at the current time, as well as measuring the amount of dark energy in the universe from another angle.” Freedman led the groundbreaking Hubble Space Telescope study that earlier had measured the Hubble constant.

Glenn Wahlgren, Spitzer program scientist at NASA Headquarters in Washington, said the better views of cepheids enabled Spitzer to improve on past measurements of the Hubble constant.

“These pulsating stars are vital rungs in what astronomers call the cosmic distance ladder: a set of objects with known distances that, when combined with the speeds at which the objects are moving away from us, reveal the expansion rate of the universe,” said Wahlgren.

Cepheids are crucial to the calculations because their distances from Earth can be measured readily. In 1908, Henrietta Leavitt discovered these stars pulse at a rate directly related to their intrinsic brightness.

To visualize why this is important, imagine someone walking away from you while carrying a candle. The farther the candle traveled, the more it would dim. Its apparent brightness would reveal the distance. The same principle applies to cepheids, standard candles in our cosmos. By measuring how bright they appear on the sky, and comparing this to their known brightness as if they were close up, astronomers can calculate their distance from Earth.

Spitzer observed 10 cepheids in our own Milky Way galaxy and 80 in a nearby neighboring galaxy called the Large Magellanic Cloud. Without the cosmic dust blocking their view, the Spitzer research team was able to obtain more precise measurements of the stars’ apparent brightness, and thus their distances. These data opened the way for a new and improved estimate of our universe’s expansion rate.

“Just over a decade ago, using the words ‘precision’ and ‘cosmology’ in the same sentence was not possible, and the size and age of the universe was not known to better than a factor of two,” said Freedman. “Now we are talking about accuracies of a few percent. It is quite extraordinary.”

“Spitzer is yet again doing science beyond what it was designed to do,” said project scientist Michael Werner at NASA’s Jet Propulsion Laboratory. Werner has worked on the mission since its early concept phase more than 30 years ago. “First, Spitzer surprised us with its pioneering ability to study exoplanet atmospheres,” said Werner, “and now, in the mission’s later years, it has become a valuable cosmology tool.”

The study appears in the Astrophysical Journal.

Paper on arXiv: A Mid-Infrared Calibration of the Hubble Constant

Source: JPL