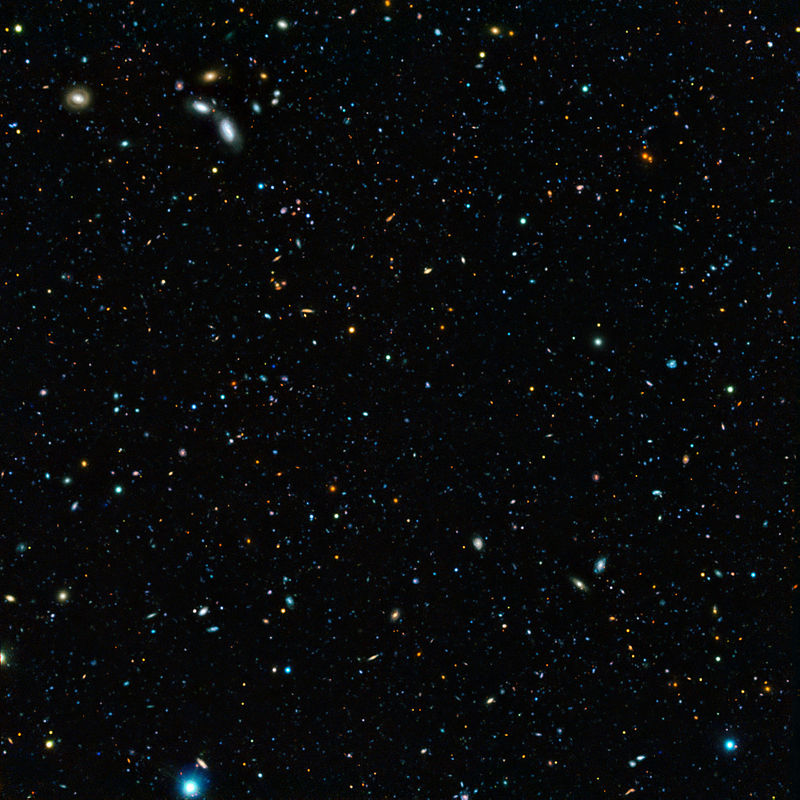
Composite image of the GOODS-South field, result of a deep survey using two 8.2-metre telescopes (Credit : ESO/M Hayes)
Those readers who have dabbled with astronomical imaging will be familiar with the technique of taking multiple images and then stacking them together to improve the strength of the signal, yielding better images. Taking this technique further many research projects require date of the same object spanning longer time frames than a nights observing. This data is usually captured from different locations and under different conditions. The problem has been matching the observations across all these survey runs. Researchers have shared a new approach to calculate if separate images of the same object will yield additional signals or just generate useless noise.
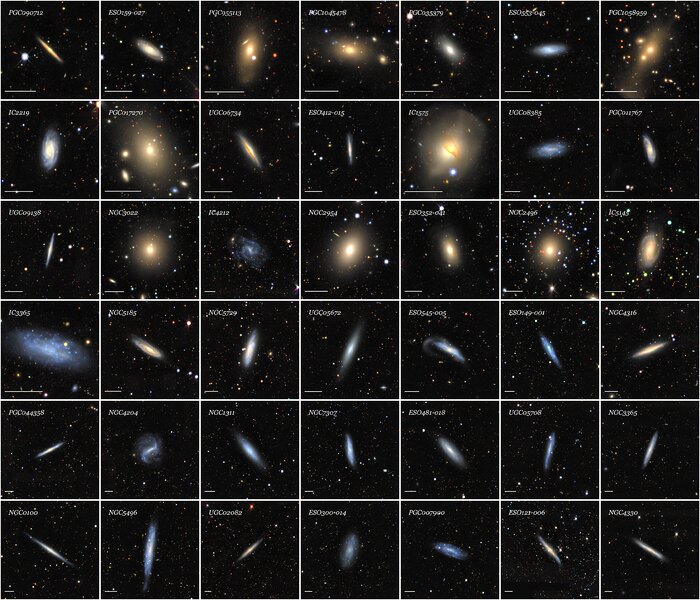
Optical mosaics of 42 galaxies from the SGA-2020 sorted by increasing angular diameter from the top-left to the bottom-right. This figure illustrates the tremendous range of types, sizes, colors and surface brightness profiles, internal structure, and environments of the galaxies in the SGA. Credit:
CTIO/NOIRLab/DOE/NSF/AURA/J. Moustakas.
The Milky Way is just one galaxy in a vast cosmic web that makes up the Universe’s large-scale structure. While ESA’s Gaia spacecraft is building a map of our stellar neighborhood, a team of astronomers with the Dark Energy Spectroscopic Instrument (DESI) Legacy Survey have released a comprehensive galactic map that includes all the data from three wide-ranging surveys completed between 2014 and 2017. Called the Siena Galaxy Atlas (SGA), it contains the distance, location, and chemical profile of 380,000 galaxies across half of the night sky.
“Previous galaxy compilations have been plagued by incorrect positions, sizes and shapes of galaxies, and also contained entries which were not galaxies but stars or artifacts,” explained Arjun Dey, an astronomer with NOIRLab, who was involved in the project. “The SGA cleans all this up for a large part of the sky. It also provides the best brightness measurements for galaxies, something we have not reliably had before for a sample of this size.”
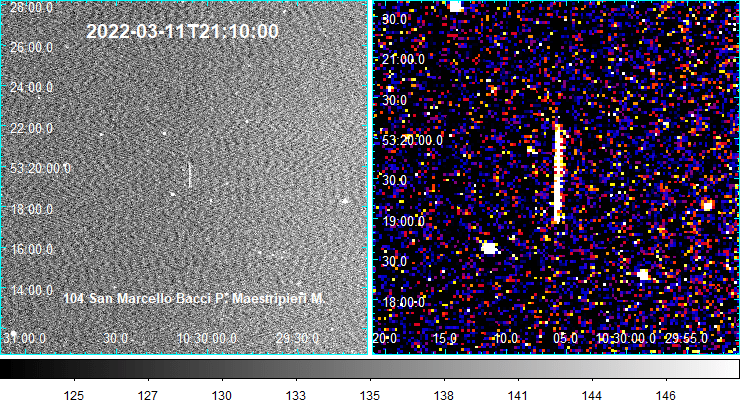
2022 EB5 captured by Paolo Bacci and Martina Maestripieri from at 21h 10min UT, which is 12 minutes before it entered the atmosphere, while it was only 12 300 km form Earth and its apparent speed close to 65?/sec. Credit: P. Bacci, M. Maestripieri
Last week, a small asteroid was detected just two hours before it impacted Earth’s atmosphere. Luckily, it was only about 3 meters (10 feet) wide, and the space rock, now known as 2022 EB5 likely burned up in Earth’s atmosphere near Iceland at 21:22 UTC on March 11.
While it is wonderful that astronomers can detect asteroids of that size heading towards our planet — as well as determine the asteroid’s trajectory and precisely predicted its impact location — the last-minute nature of the discovery definitely causes a pause. What if it had been bigger?
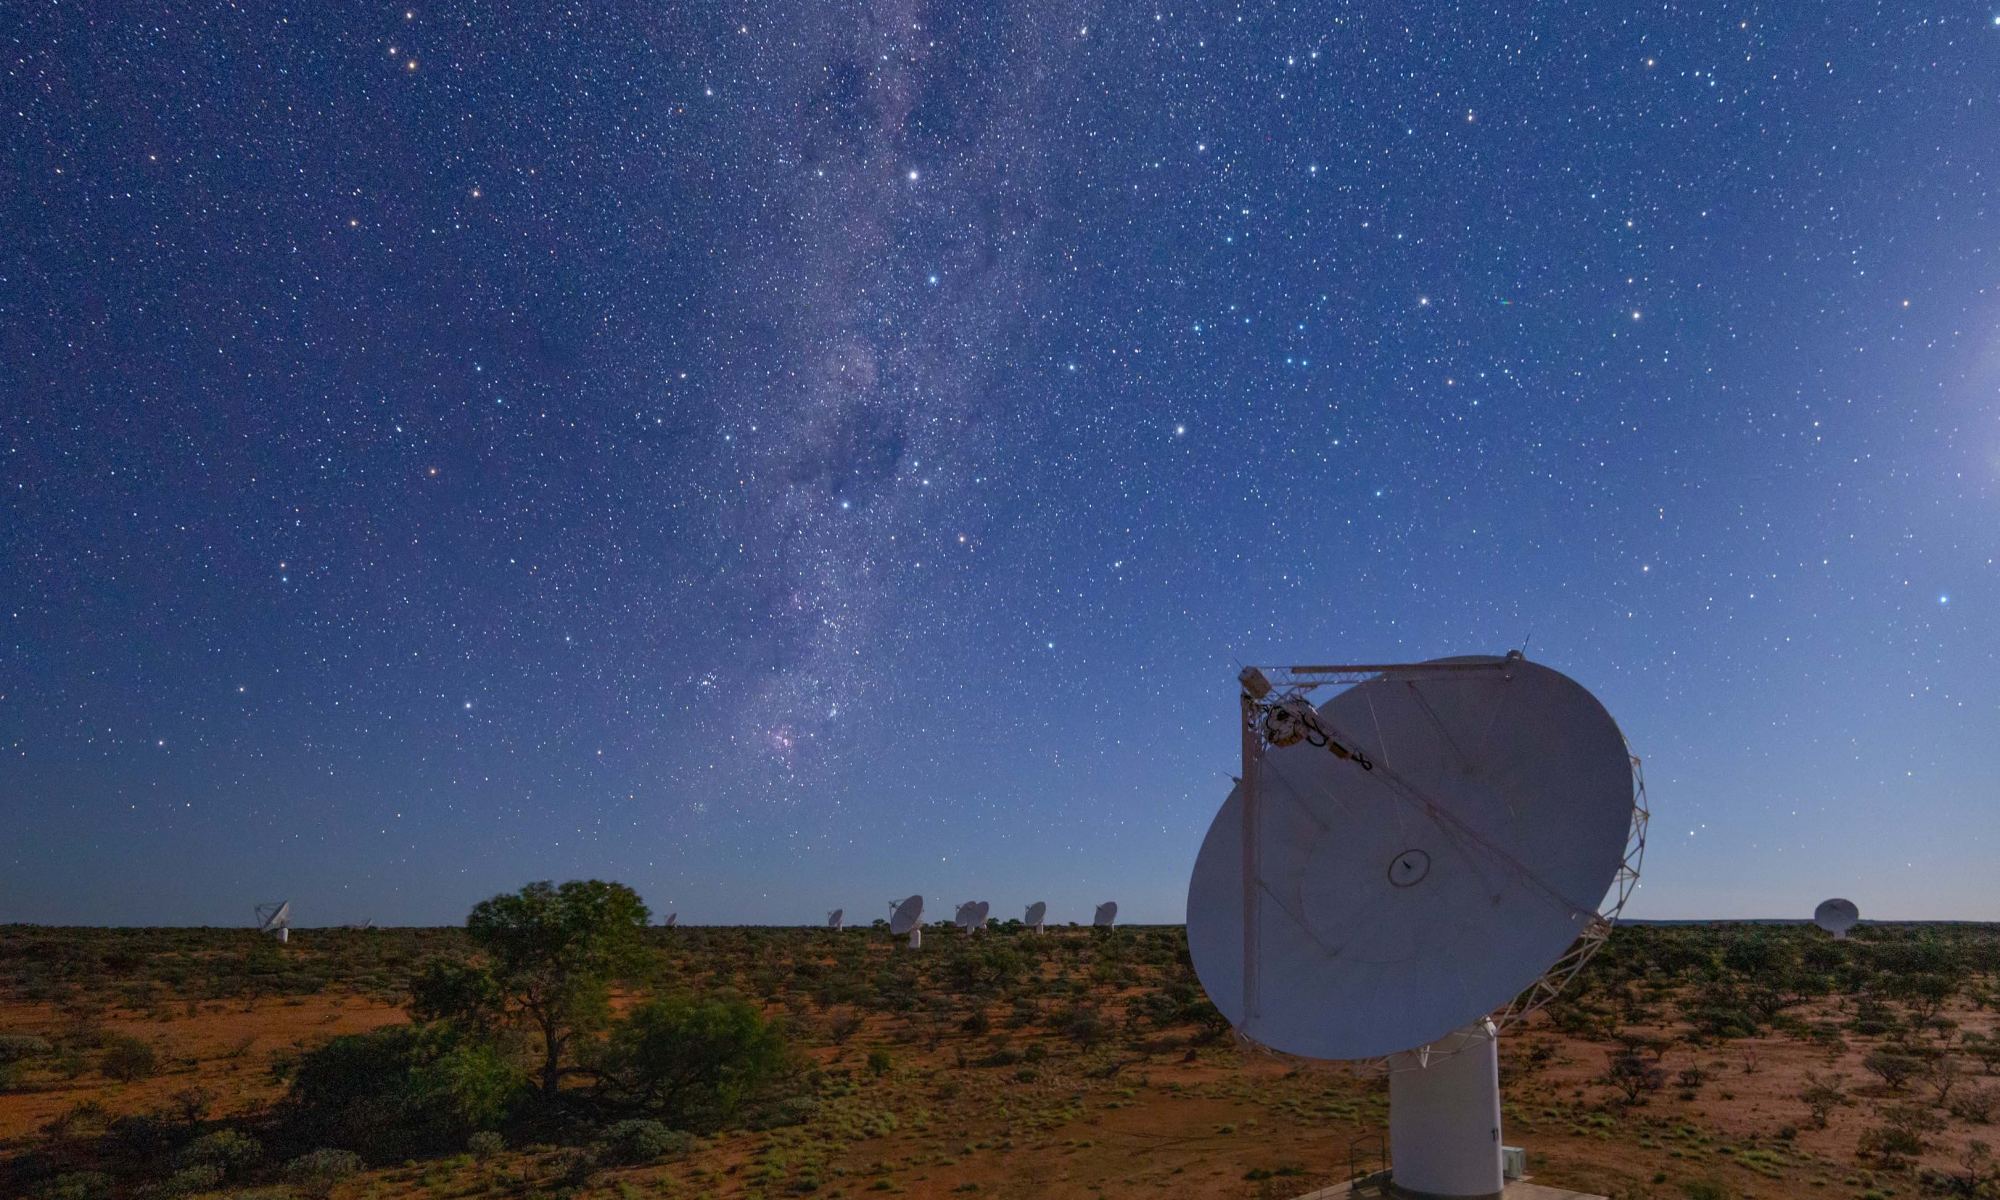
An ASKAP antenna views the southern sky. Credit: CSIRO
Although radio astronomy has been around since the 1930s, it is only in recent years that astronomers have been able to make high-resolution maps of the radio sky. Sky maps are difficult for radio telescopes because radio antennas need to be focused on an extremely small patch of sky to capture images in high resolution. But with modern antennas and computer processing, we can now scan the sky quickly enough to map the heavens in a reasonable amount of time.
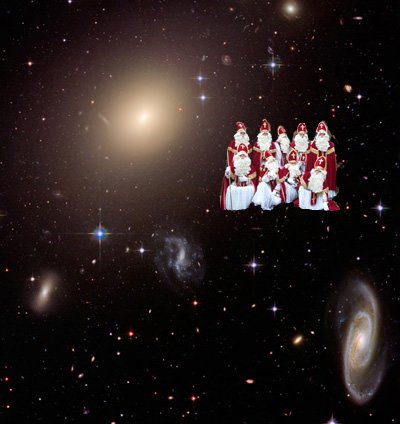
Santa pictures made by Sarah Emery Bunn, Matthew Graham, and Roy Williams Image credit: NASA, ESA, and the Hubble Heritage Team (STScI/AURA)
[/caption]
Normally, SkyAlert collects and distributes reports of astronomical transients in near-real time, such as supernovae, gamma-ray bursts, cataclysmic variables and blazar eruptions. You can even get alerts of these events via Twitter or Facebook. But starting this morning, Dec 24, through Dec 25, Skyalert.org will be distributing Santa Sighting Events via Twitter and Facebook so you can track where in the universe Santa will be. SkyAlert also has some interesting images of where Santa has been — there’s evidence of Santa on the Moon; he may have been flying through the Coalsack Nebula (see below) and that even in the early Universe there may have been multiple Santas.
Image credit: Don Pettit, ISS Expedition 6, NASA Santa pictures made by Sarah Emery Bunn, Matthew Graham, and Roy Williams
The Santa stream will be broadcast live on Twitter at http://twitter.com/skyalert with the tag #SantaAlert. You can also go to the SkyAlert website’s special Santa tracking page, or Facebook.
The sky is full of explosions and movement, and SkyAlert is a great way to follow all the transient events taking place. The folks at SkyAlert say the discovery rate of such transients is increasing rapidly as new surveys come online. Visit SkyAlert for more information. And enjoy the holidays!
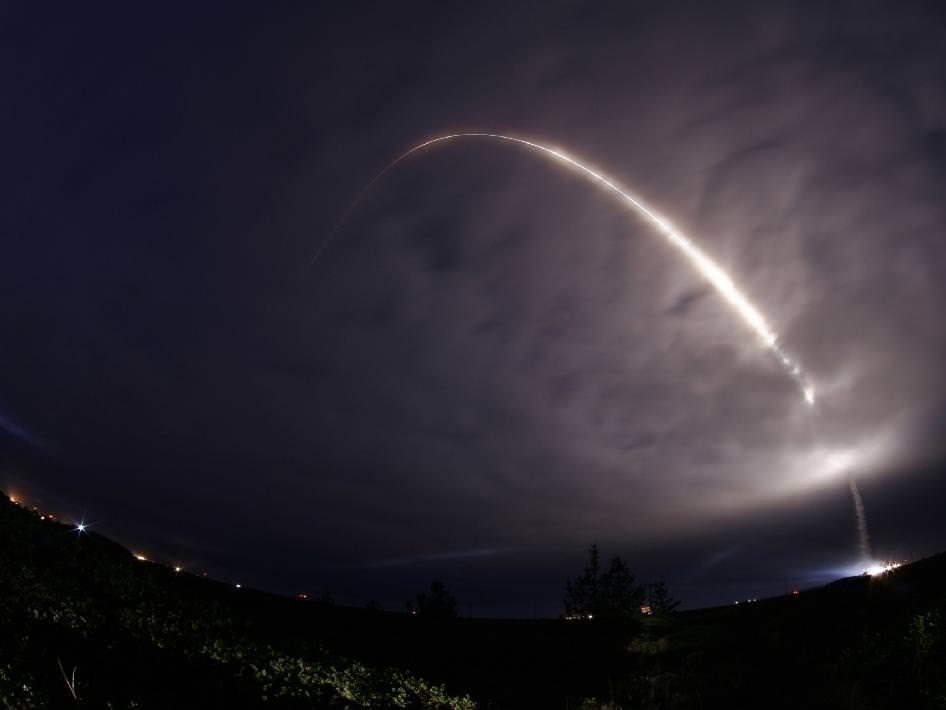
WISE launch. Image Credit: Bill Hartenstein/United Launch Alliance
NASA’s Wide-field Infrared Survey Explorer, or WISE, successfully lifted off this morning on its way to map the entire sky in infrared light. A Delta II rocket carrying the spacecraft launched at 6:09 a.m. PST (9:09 a.m. EST) from Vandenberg Air Force Base in California. WISE quickly began transmitting data – just 10 seconds after spacecraft separation — and all through the events that lead to bringing the satellite into a polar orbit 326 miles above Earth.
[/caption]
“WISE thundered overhead, lighting up the pre-dawn skies,” said William Irace, the mission’s project manager at NASA’s Jet Propulsion Laboratory in Pasadena, Calif. “All systems are looking good, and we are on our way to seeing the entire infrared sky better than ever before.”
Because the instrument sees the infrared, or heat, signatures of objects, it must be kept at chilly temperatures. Its coldest detectors are less than minus 447 degrees Fahrenheit.
“WISE needs to be colder than the objects it’s observing,” said Ned Wright of UCLA, the mission’s principal investigator. “Now we’re ready to see the infrared glow from hundreds of thousands of asteroids, and hundreds of millions of stars and galaxies.”
With the spacecraft stable, cold and communicating with mission controllers at JPL, a month-long checkout and calibration is underway.
WISE will see the infrared colors of the whole sky with sensitivity and resolution far better than the last infrared sky survey, performed 26 years ago. The space telescope will spend nine months scanning the sky once, then one-half the sky a second time. The primary mission will end when WISE’s frozen hydrogen runs out, about 10 months after launch.
WISE will catalog a variety of astronomical targets. Near-Earth asteroids, stars, planet-forming disks and distant galaxies all will be easy for the mission to see. Hundreds of millions of objects will populate the WISE atlas, providing astronomers and other space missions, such as NASA’s planned James Webb Space Telescope, with a long-lasting infrared roadmap.