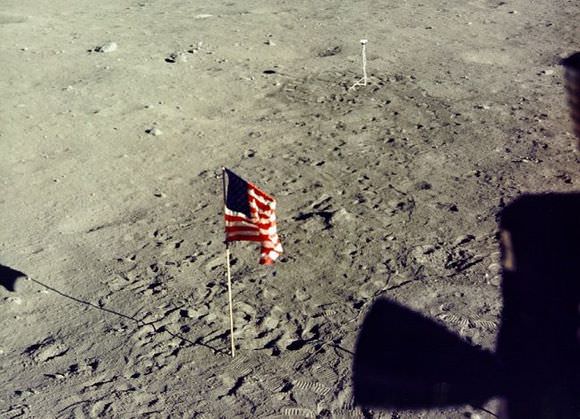
Nature, the publishing group, is mixing the old with the new by “tweeting” the Apollo 11 moon mission as it happened — 40 years later. Followers on Twitter will be able to read about technical milestones, political challenges, and related events in the space race starting today, just over a month before the 40th anniversary of the first lunar landing.
Apollo 11’s Twitter profile is here — and since the announcement this morning, already boasts 110 followers. The tweets will chronicle the Apollo 11 crew’s journey to the moon and back, and taper off during the weeks following the mission to give followers the context surrounding the moon mission and its implications for science and the wider world.
Source: Nature News. More information is available in an accompanying blog.
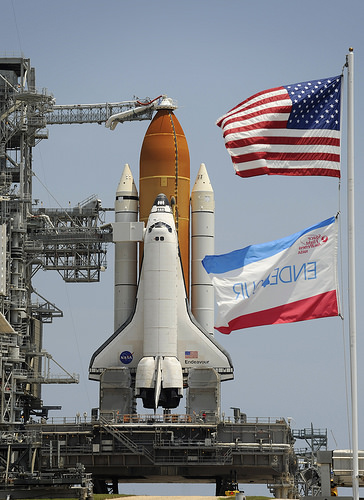
NASA was forced to postpone the launch of space shuttle Endeavour on Wednesday for the second time after a problem with a hydrogen gas leak surfaced again while the ship was being fueled for flight.
An identical problem delayed a launch attempt on Saturday. Technicians had replaced seals in a hydrogen vent line in hopes of fixing the leak. The next opportunity to launch Endeavour will be on July 11 because of because of temperature constraints related to the International Space Station’s orbit.
“We’re going to step back and figure out what the problem is and go fix it,” said deputy shuttle program manager LeRoy Cain. “Obviously we have something here we didn’t understand as well as we thought we may have.”
Next up: Thursday June 18’s launch attempt for LRO/LCROSS at 5:12 p.m., 5:22 p.m. or 5:32 p.m. EDT. (9:12. 9:22 or 9:32 GMT)
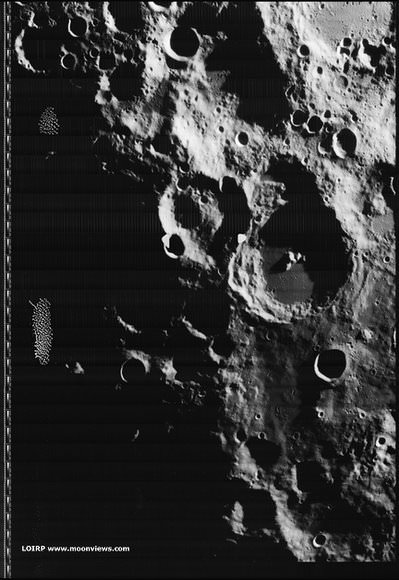
Lunar South pole 1967. Credit: LOIRP and MoonViews.com
[/caption]
More images have been released by the Lunar Orbiter Imagery Recovery Project (LOIRP), the endeavor that has been called a “time machine” by team member Keith Cowing of NASA Watch. In 1966 and 1967, NASA sent five Lunar Orbiter missions to photograph the lunar surface to prepare for the Apollo missions to land humans on moon. Data were recorded on large magnetic tapes, and a special machine was needed to just to view the images. The LOIRP team is working on digitizing the data, and restoring the images to their full resolution. These images are especially timely, given the upcoming launch of the Lunar Reconnaissance Orbiter, hopefully this week. NASA can compare detailed high-resolution images from 1966 to the present and see what changes occurred in 40-plus years. “What this gives you is literally before and after photos,” Cowing said.
The above image was taken by Lunar Orbiter IV in May 1967 and shows the south pole of the Moon. This image shows the region without labels, and below, the image shows major features plus notation regarding processing artifacts from the spacecraft’s film processing system. The moon’s south pole is located near the rim of Shackleton Crater. The moon’s polar regions are currently of great interest as the Lunar CRater Observation and Sensing Satellite (LCROSS) will be targeted to impact at the moon’s south pole, to occur in October if LRO/LCROSS launches this week. Lunar south pole, annotated. Credit: LOIRP and MoonViews.com
Apollo 12 site annotated. Credit: LOIRP and MoonViews.com
This image LO3-154-H was taken by Lunar Orbiter III on 20 February 1967 and shows the landing site for both Surveyor III, which landed on April 20, 1967 and Apollo 12, which landed on November 19, 1969. The annotations show major features plus EVA routes taken by the astronauts Pete Conrad and Allan Bean.
Did you get a chance to watch the IYA Live Telescope Today? Our target was the extremely compact and bright globular cluster, M80 in the constellation of Scorpius. What a treat! Of course, if you didn’t get a chance to watch it live, we made sure to capture a quick video for you to share….
Messier 80 (also known as M80 or NGC 6093) is a globular cluster in the constellation Scorpius. It was discovered by Charles Messier in 1781.
M80 is located midway between Alpha Scorpii (Antares) and Beta Scorpii in a field in the Milky Way that is rich in nebulae. It can be viewed with modest amateur telescopes as a mottled ball of light. With an apparent diameter of about 10′ and at an estimated distance of 32,600 light-years, M80’s spatial diameter is about 95 light-years and contains several hundred thousand stars. It is among the more densely populated globular clusters in the Milky Way Galaxy. M80 contains a relatively large amount of blue stragglers, stars that appear to be much younger than the cluster itself. It is thought these stars have lost part of their outer layers due to close encounters with other cluster members or perhaps the result of collisions between stars in the dense cluster. Images from the Hubble Space Telescope have shown districts of very high blue straggler densities, suggesting that the center of the cluster is likely to have a very high capture and collision rate.
On May 21, 1860, a nova was discovered in M80 that attained a magnitude of +7.0. The nova, variable star designation T Scorpii, reached an absolute magnitude of -8.5, briefly outshining the entire cluster.
As always, you can join us whenever the skies are clear and dark in Central Victoria by clicking on the live remote cam link under the IYA telescope logo to your right. Have a great time!
[/caption]
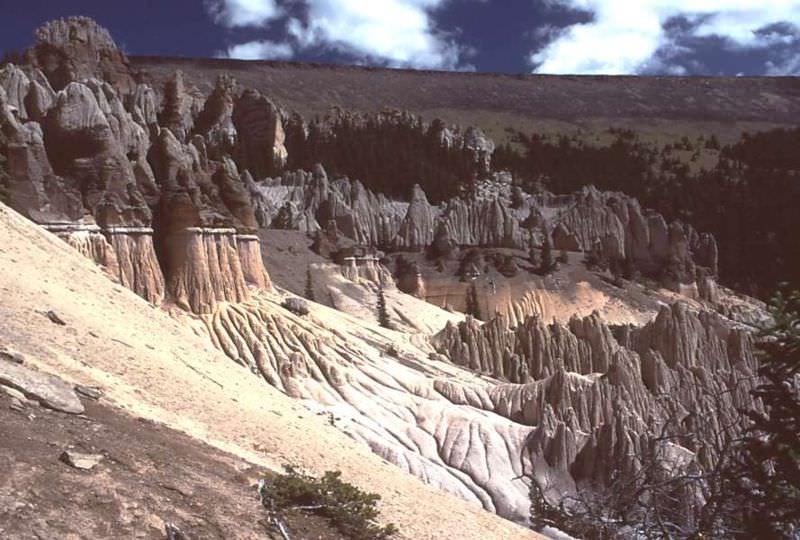
There have been some big eruptions in recent history, like Mount Pinatubo, Mount St. Helens, and even Krakatoa. But those were tiny compared to some of the largest eruptions that have ever happened in the Earth’s history. So what was the largest eruption ever?
First, let’s get a sense of scale. When Krakatoa exploded in 1883, it released more than 21 cubic kilometers of rock, ash and pumice measuring 6 on the Volcanic Explosivity Index. At least 36,000 people died in the eruption and the tsunamis that followed.
Well, that was nothing.
Lake Toba in Indonesia measures 100 km long and 30 km wide and goes down to a depth of 505 meters. But it’s actually the collapsed caldera of a supernova that detonated about 74,000 years ago. Geologists believe that it erupted with an intensity of 8 on the Volcanic Explosivity Index, releasing 2,800 cubic kilometers of ash, rock and pumice. It deposited a layer of ash 15 centimeters thick over the entire Indian subcontinent.
Want bigger? No problem. The La Garita Caldera eruption in Colorado erupted about 28 million years ago, blasting out 5,000 cubic kilometers of ash.
We have written many articles about volcanoes for Universe Today. Here’s an article about supervolcanoes, and here’s an article about the Krakatoa eruption.
[/caption]
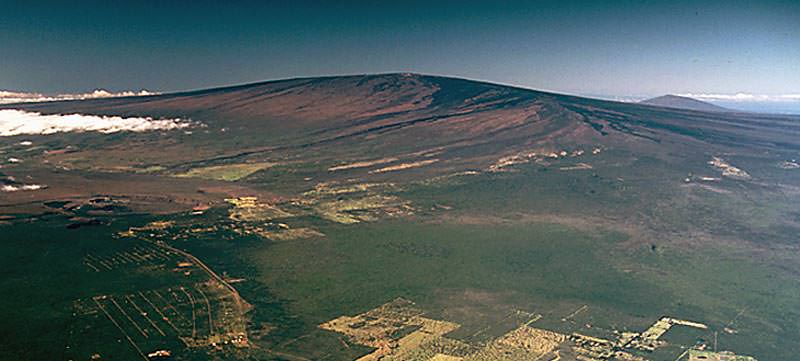
The biggest volcano on Earth is Hawaii’s Mauna Loa, rising to an elevation of 4,169 above sea level and with an estimated volume of 75,000 cubic kilometers. But did you know that Mauna Loa is also the largest active volcano? Mauna Loa’s most recent eruption started on March 24, 1984 and lasted until April 15, 1984. An eruption that recent makes it a very active volcano.
Mauna Loa is the biggest volcano in the world because it’s so active. The enormous mass of the volcano is pushing down on the sea floor, creating a deep depression that it’s sinking down into. Furthermore, the mass of the volcano is causing it to further settle and flatten out. When volcanoes start out, the new eruptions cause them to gain elevation faster than they shrink through settling and erosion. But when a volcano gets really large, it has to erupt regularly to continue gaining elevation.
The size and shape of Mauna Loa is still changing; although, very slowly. The caldera at the summit of Mauna Loa recently opened up about 10 cm during a period of eruption in 1975, and it’s believed that the peak was lifted up by about 13 cm. But then in the 1984 eruption, the peak subsided at least 61 cm. Geologists expect that large portions of Mauna Loa’s flanks will slide off the mountain into the ocean. This will shrink the volcano somewhat, but it will still be the largest volcano in the world.
It’s still a very active volcano, having erupted 33 times since historical records were first kept.
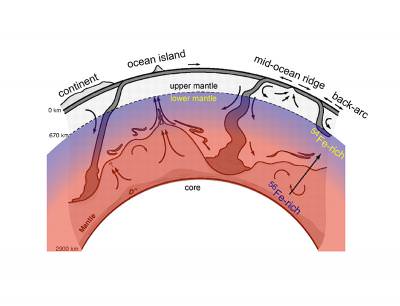
Credit: Louise Kellogg, modified by James Rustad & Qing-zhu Yin/UC Davis
[/caption]
Earth may have given up its innermost secrets to a pair of California geochemists, who have used extensive computer simulations to piece together the earliest history of our planet’s core.
This schematic of Earth’s crust and mantle shows the results of their study, which found extreme pressures would have concentrated iron’s heavier isotopes near the bottom of the mantle as it crystallized from an ocean of magma.
World Book illustration by Raymond Perlman and Steven Brayfield, Artisan-Chicago
By using a super-computer to virtually squeeze and heat iron-bearing minerals under conditions that would have existed when the Earth crystallized from an ocean of magma to its solid form 4.5 billion years ago, the two scientists — from the University of California at Davis — have produced the first picture of how different isotopes of iron were initially distributed in the solid Earth.
The discovery could usher in a wave of investigations into the evolution of Earth’s mantle, a layer of material about 1,800 miles deep that extends from just beneath the planet’s thin crust to its metallic core.
“Now that we have some idea of how these isotopes of iron were originally distributed on Earth,” said lead study author James Rustad, “we should be able to use the isotopes to trace the inner workings of Earth’s engine.”
A paper describing the study by Rustad and co-author Qing-zhu Yin was posted online by the journal Nature Geoscience on Sunday, June 14, in advance of print publication in July.
Sandwiched between Earth’s crust and core, the vast mantle accounts for about 85 percent of the planet’s volume. On a human time scale, this immense portion of our orb appears to be solid. But over millions of years, heat from the molten core and the mantle’s own radioactive decay cause it to slowly churn, like thick soup over a low flame. This circulation is the driving force behind the surface motion of tectonic plates, which builds mountains and causes earthquakes.
One source of information providing insight into the physics of this viscous mass are the four stable forms, or isotopes, of iron that can be found in rocks that have risen to Earth’s surface at mid-ocean ridges where seafloor spreading is occurring, and at hotspots like Hawaii’s volcanoes that poke up through the Earth’s crust. Geologists suspect that some of this material originates at the boundary between the mantle and the core some 1,800 miles beneath the surface.
“Geologists use isotopes to track physico-chemical processes in nature the way biologists use DNA to track the evolution of life,” Yin said.
Because the composition of iron isotopes in rocks will vary depending on the pressure and temperature conditions under which a rock was created, Yin said, in principle, geologists could use iron isotopes in rocks collected at hot spots around the world to track the mantle’s geologic history. But in order to do so, they would first need to know how the isotopes were originally distributed in Earth’s primordial magma ocean when it cooled down and hardened.
Yin and Rustad investigated how the competing effects of extreme pressure and temperature deep in Earth’s interior would have affected the minerals in the lower mantle, the zone that stretches from about 400 miles beneath the planet’s crust to the core-mantle boundary. Temperatures up to 4,500 degrees Kelvin in the region reduce the isotopic differences between minerals to a miniscule level, while crushing pressures tend to alter the basic form of the iron atom itself, a phenomenon known as electronic spin transition.
The pair calculated the iron isotope composition of two minerals under a range of temperatures, pressures and different electronic spin states that are now known to occur in the lower mantle. The two minerals, ferroperovskite and ferropericlase, contain virtually all of the iron that occurs in this deep portion of the Earth.
The calculations were so complex that each series Rustad and Yin ran through the computer required a month to complete.
Yin and Rustad determined that extreme pressures would have concentrated iron’s heavier isotopes near the bottom of the crystallizing mantle.
The researchers plan to document the variation of iron isotopes in pure chemicals subjected to temperatures and pressures in the laboratory that are equivalent to those found at the core-mantle boundary. Eventually, Yin said, they hope to see their theoretical predictions verified in geological samples generated from the lower mantle.
[/caption]
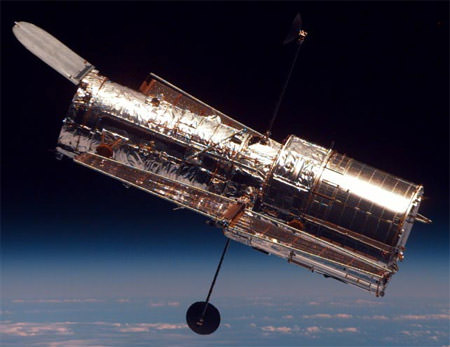
As we wait (impatiently) for the Hubble Space Telescope to return to action following its repair and updating by the STS-125 astronauts, it is easy to think about how Hubble has impacted society. Hubble has become a household name, bringing astronomy to the masses with its dramatic images of the cosmos. It has also changed our understanding of the universe. But there’s more ways that HST has impacted the world. Various technologies developed for the famous orbiting telescope have helped create or improve several different medical and and scientific tools. Here are five technology spinoffs from Hubble:
Micro-Endoscope for Medical Diagnosis: Micro-endoscope. Credit: NASA
The same technology that enhances HST’s images are now helping physicians perform micro-invasive arthroscopic surgery with more accurate diagnoses. Hubble technology helped improve the micro-endoscope, a surgical tool that enables surgeons to view what is happening inside the body on a screen, eliminating the need for a more invasive diagnostic procedure. This saves time, money and lessens the discomfort patients experience.
CCDs Enable Clearer, More Efficient Biopsies A biopsy from HST CCD technology. Credit: NASA
Charge coupled devices (CCDs) used on the HST to convert light into electronic files—such as a distant star’s light directly into digital images—have been adapted to improve imaging and optics here on Earth. When scientists realized that existing CCD technology could not meet scientific requirements for the Hubble’s needs, NASA worked with an industry partner to develop a new, more advanced CCD. The industry partner then applied many of the NASA-driven enhancements to the manufacture of CCDs for digital mammography biopsy techniques, using CCDs to image breast tissue more clearly and efficiently. This allows doctors to analyze the tissue by stereotactic biopsy, which requires a needle rather than surgery.
The semiconductor industry has benefitted from the ultra-precise mirror technology that gives the HST its full optical vision and telescopic power. This technological contribution helped improve optics manufacturing in microlithography—a method for printing tiny circuitry, such as in computer chips. The system uses molecular films that absorb and scatter incoming light, enabling superior precision and, consequently, higher productivity and better performance. This translates into better-made and potentially less costly computer circuitry and semiconductors.
Software Enhances Other Observatories Hubble software used by other observatories. Credit: NASA
With the help of a software suite created by a NASA industry partner in 1995, students and astronomers were able to operate a telescope at the Mount Wilson Observatory Institute via the Internet. The software is still widely in use for various astronomy applications; using the CCD technology, the software locates, identifies, and acquires images of deep sky objects, allowing a user to control computer-driven telescopes and CCD cameras.
Optics Tool Sharpens Record-Breaking Ice Skates Hubble technology helps Olympic skaters. Credit: NASA
Current Olympic record-holding speed skater Chris Witty raced her way to a gold medal in the 1,000-meter at the 2002 Salt Lake City Winter Olympics. Witty and other American short- and long-track speed skaters used a blade-sharpening tool designed with the help of NASA Goddard Space Flight Center and technology from HST. NASA had met with the U.S. Olympic Committee and helped to develop a new tool for sharpening speed skates, inspired by principles used to create optics for the HST. Speed skates sharpened with this new instrument demonstrated a marked improvement over conventionally sharpened skates.
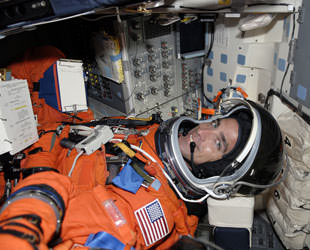
Astronaut Chris Cassidy getting strapped into the shuttle. Credit: NASA
[/caption]
An historic milestone will be reached during the STS-127 space shuttle mission to the International Space Station, which will hopefully launch on Wednesday. The crew will include the 500th person ever to fly in space. Since there are four rookie astronauts on the mission, it’s a bit of a coin toss as to who is actually the 500th, but seemingly the crew has agreed that former naval commander Chris Cassidy, 39, who has led combat missions in Afghanistan, will take the honor.
A few notables of the 499 who have gone before, below, and a quick report that things look good so far for Endeavour’s second launch attempt. NASA is shooting for 5:40:52 a.m. Wednesday (9:40 GMT) on Wednesday June 17.
Workers on Kennedy Space Center's Launch Pad 39A prepare to remove the 7-inch quick disconnect and flight seal from the Ground Umbilical Carrier Plate, or GUCP, on space shuttle Endeavour's external fuel tank. Teams are removing the hardware to change out seals in the internal connection points. The GUCP is the overboard vent to the pad and the flare stack where the vented hydrogen is burned off. Credit: NASA
Click on image for a really huge version.
On Tuesday, engineers pulled a protective gantry away from the shuttle Endeavour and restarted the orbiter’s countdown Tuesday, setting the stage for launch. There are no technical problems of any significance and forecasters are predicting an 80 percent chance of good weather at launch time. You can watch NASA TV or follow Nancy on Twitter for updates.
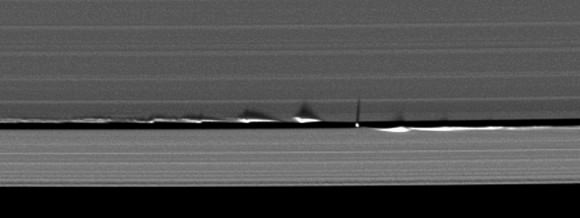
Looming vertical structures, seen here for the first time and created by Saturn's moon Daphnis, rise above the planet's otherwise flat, thin disk of rings to cast long shadows in this Cassini image. Credit: CICLOPS.
Cassini has imaged towering vertical structures in the planet’s otherwise flat rings that come from the gravitational effects of a small nearby moon. This is the first time these structures have been seen. They reach up over one kilometer high, and are visible now as the sun nears “high noon” directly overhead at the planet’s equator, as Saturn approaches its equinox.
The search for ring material extending above and below Saturn’s ring plane has been a major goal of the imaging team during Cassini’s “Equinox Mission,” the two-year period containing the exact equinox. This novel illumination geometry, which occurs every half-Saturn-year, or about 15 Earth years, lowers the sun’s angle to the ring plane and causes out-of-plane structures to cast long shadows across the rings, making them easy to detect.
Images taken in recent weeks have demonstrated how small moons in very narrow gaps can have considerable and complex effects on the edges of their gaps, and that such moons can be smaller than previously believed. Looming vertical structures, seen here for the first time and created by Saturn's moon Daphnis, rise above the planet's otherwise flat, thin disk of rings to cast long shadows in this Cassini image. Credit: CICLOPS
The 8-kilometer-wide (5-mile) moon Daphnis orbits within the 42-kilometer-wide (26-mile) Keeler Gap in Saturn’s outer A ring, and its gravitational pull perturbs the orbits of the particles forming the gap’s edges. Earlier images have shown “waves” in the rings from Daphnis eccentric orbit.
But new images show the shadows of the vertical waves created by Daphnis cast onto the nearby ring. These characteristics match what was predicted by scientists.
Scientists have estimated, from the lengths of the shadows, wave heights that reach enormous distances above Saturn’s ring plane – as large as 1.5 kilometers (1 mile) — making these waves twice as high as previously known vertical ring structures, and as much as 150 times as high as the rings are thick. The main rings — named A, B and C — are only about 10 meters (30 feet) thick.
“We thought that this vertical structure was pretty neat when we first saw it in our simulations,” said John Weiss, lead author of a paper reporting on these images. “But it’s a million times cooler to have your theory supported by such gorgeous images. It makes you suspect you might be doing something right.”
Click here to watch a movie of the vertical structures and waves in motion.
Also presented in the paper is a refinement to a theory used since the Voyager missions of the 1980s to infer the mass of gap-embedded moons based on how much the moons affect the surrounding ring material. The authors conclude that an embedded moon in a very narrow gap can have a smaller mass than that inferred by earlier techniques. One of the prime future goals of the imaging team is to scour the remaining gaps and divisions within the rings to search for the moons expected to be there. “It is one of those questions that have been nagging us since getting into orbit: ‘Why haven’t we yet seen a moon in every gap?’” said Carolyn Porco, lead for the Cassini imaging team. “We now think they may actually be there, only a lot smaller than we expected.”